Success Metrics
Inventory Management Metrics Ppt PowerPoint Presentation Portfolio Elements Cpb
Presenting this set of slides with name inventory management metrics ppt powerpoint presentation portfolio elements cpb. This is an editable Powerpoint six stages graphic that deals with topics like inventory management metrics to help convey your message better graphically. This product is a premium product available for immediate download and is 100 percent editable in Powerpoint. Download this now and use it in your presentations to impress your audience.

Customer Feedback Metrics Ppt PowerPoint Presentation Slides Example Introduction Cpb
Presenting this set of slides with name customer feedback metrics ppt powerpoint presentation slides example introduction cpb. This is an editable Powerpoint three stages graphic that deals with topics like customer feedback metrics to help convey your message better graphically. This product is a premium product available for immediate download and is 100 percent editable in Powerpoint. Download this now and use it in your presentations to impress your audience.

Example Marketing Metrics Ppt PowerPoint Presentation Gallery Good
Presenting this set of slides with name example marketing metrics ppt powerpoint presentation gallery good. This is an editable Powerpoint five stages graphic that deals with topics like example marketing metrics to help convey your message better graphically. This product is a premium product available for immediate download and is 100 percent editable in Powerpoint. Download this now and use it in your presentations to impress your audience.

Key Financial Metrics Ppt PowerPoint Presentation Portfolio Design Inspiration Cpb
Presenting this set of slides with name key financial metrics ppt powerpoint presentation portfolio design inspiration cpb. This is an editable Powerpoint four stages graphic that deals with topics like key financial metrics to help convey your message better graphically. This product is a premium product available for immediate download and is 100 percent editable in Powerpoint. Download this now and use it in your presentations to impress your audience.
Social Media Marketing Metrics Ppt PowerPoint Presentation Gallery Aids Cpb
Presenting this set of slides with name social media marketing metrics ppt powerpoint presentation gallery aids cpb. This is an editable Powerpoint five stages graphic that deals with topics like social media marketing metrics to help convey your message better graphically. This product is a premium product available for immediate download and is 100 percent editable in Powerpoint. Download this now and use it in your presentations to impress your audience.

Asset Utilization Metrics Ppt PowerPoint Presentation Portfolio Gridlines Cpb
Presenting this set of slides with name asset utilization metrics ppt powerpoint presentation portfolio gridlines cpb. This is an editable Powerpoint three stages graphic that deals with topics like asset utilization metrics to help convey your message better graphically. This product is a premium product available for immediate download and is 100 percent editable in Powerpoint. Download this now and use it in your presentations to impress your audience.

Search Engine Marketing Metrics Ppt PowerPoint Presentation Layouts Display Cpb
Presenting this set of slides with name search engine marketing metrics ppt powerpoint presentation layouts display cpb. This is an editable Powerpoint three stages graphic that deals with topics like search engine marketing metrics to help convey your message better graphically. This product is a premium product available for immediate download and is 100 percent editable in Powerpoint. Download this now and use it in your presentations to impress your audience.
Supply Chain Benchmarking Metrics Ppt PowerPoint Presentation Outline Layout Cpb
Presenting this set of slides with name supply chain benchmarking metrics ppt powerpoint presentation outline layout cpb. This is an editable Powerpoint four stages graphic that deals with topics like supply chain benchmarking metrics to help convey your message better graphically. This product is a premium product available for immediate download and is 100 percent editable in Powerpoint. Download this now and use it in your presentations to impress your audience.
Diversity Recruiting Metrics Ppt PowerPoint Presentation Layouts Graphics Cpb
Presenting this set of slides with name diversity recruiting metrics ppt powerpoint presentation layouts graphics cpb. This is an editable Powerpoint four stages graphic that deals with topics like diversity recruiting metrics to help convey your message better graphically. This product is a premium product available for immediate download and is 100 percent editable in Powerpoint. Download this now and use it in your presentations to impress your audience.
Usability Testing Metrics Ppt PowerPoint Presentation Gallery Picture Cpb
Presenting this set of slides with name usability testing metrics ppt powerpoint presentation gallery picture cpb. This is an editable Powerpoint seven stages graphic that deals with topics like usability testing metrics to help convey your message better graphically. This product is a premium product available for immediate download and is 100 percent editable in Powerpoint. Download this now and use it in your presentations to impress your audience.
Campaign Metrics Analysis Ppt PowerPoint Presentation Template Cpb
Presenting this set of slides with name campaign metrics analysis ppt powerpoint presentation template cpb. This is an editable Powerpoint seven stages graphic that deals with topics like campaign metrics analysis to help convey your message better graphically. This product is a premium product available for immediate download and is 100 percent editable in Powerpoint. Download this now and use it in your presentations to impress your audience.
Email Tracking Metrics Ppt PowerPoint Presentation Show Template Cpb
Presenting this set of slides with name email tracking metrics ppt powerpoint presentation show template cpb. This is an editable Powerpoint six stages graphic that deals with topics like email tracking metrics to help convey your message better graphically. This product is a premium product available for immediate download and is 100 percent editable in Powerpoint. Download this now and use it in your presentations to impress your audience.

Operational Efficiency Metrics Ppt PowerPoint Presentation Infographics Ideas Cpb Pdf
Presenting this set of slides with name operational efficiency metrics ppt powerpoint presentation infographics ideas cpb pdf. This is an editable Powerpoint three stages graphic that deals with topics like operational efficiency metrics to help convey your message better graphically. This product is a premium product available for immediate download and is 100 percent editable in Powerpoint. Download this now and use it in your presentations to impress your audience.
Common Talent Management Metrics Ppt PowerPoint Presentation Background Cpb Pdf
Presenting this set of slides with name common talent management metrics ppt powerpoint presentation background cpb pdf. This is an editable Powerpoint six stages graphic that deals with topics like common talent management metrics to help convey your message better graphically. This product is a premium product available for immediate download and is 100 percent editable in Powerpoint. Download this now and use it in your presentations to impress your audience.
System Availability Metrics Ppt PowerPoint Presentation Gallery Example Cpb Pdf
Presenting this set of slides with name system availability metrics ppt powerpoint presentation gallery example cpb pdf. This is an editable Powerpoint four stages graphic that deals with topics like system availability metrics to help convey your message better graphically. This product is a premium product available for immediate download and is 100 percent editable in Powerpoint. Download this now and use it in your presentations to impress your audience.
Sales Enablement Metrics Ppt PowerPoint Presentation Icon Mockup Cpb Pdf
Presenting this set of slides with name sales enablement metrics ppt powerpoint presentation icon mockup cpb pdf. This is an editable Powerpoint seven stages graphic that deals with topics like sales enablement metrics to help convey your message better graphically. This product is a premium product available for immediate download and is 100 percent editable in Powerpoint. Download this now and use it in your presentations to impress your audience.

B2B Marketing KPI Metrics TOP PRODUCTS IN REVENUE Infographics PDF
This is a b2b marketing kpi metrics top products in revenue infographics pdf template with various stages. Focus and dispense information on four stages using this creative set, that comes with editable features. It contains large content boxes to add your information on topics like top products revenue, KPI metrics. You can also showcase facts, figures, and other relevant content using this PPT layout. Grab it now.

Water Management KPI Metrics Showing Domestic Water Consumption Information PDF
Presenting water management KPI metrics showing domestic water consumption information pdf. to provide visual cues and insights. Share and navigate important information on three stages that need your due attention. This template can be used to pitch topics like water management kpi metrics showing domestic water consumption. In addtion, this PPT design contains high resolution images, graphics, etc, that are easily editable and available for immediate download.
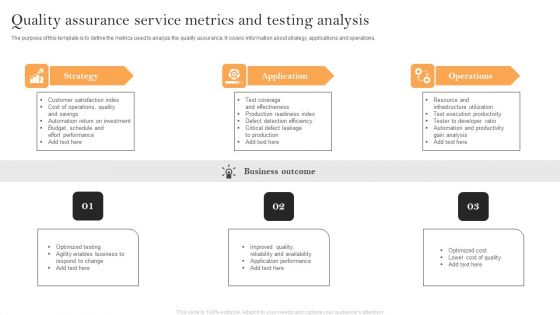
Quality Assurance Service Metrics And Testing Analysis Topics PDF
The purpose of this template is to define the metrics used to analyze the quality assurance. It covers information about strategy, applications and operations. Presenting Quality Assurance Service Metrics And Testing Analysis Topics PDF to dispense important information. This template comprises Three stages. It also presents valuable insights into the topics including Customer Satisfaction Index, Cost Of Operations, Schedule And Effort. This is a completely customizable PowerPoint theme that can be put to use immediately. So, download it and address the topic impactfully.

Ecommerce Operations Management Metrics To Measure Performance Professional PDF
This slide showcases essential metrics of e-commerce to make informed decisions. Major key performance indicators covered are website traffic, shopping cart abandonment rate, revenue per visitor and on time delivery rate. Presenting Ecommerce Operations Management Metrics To Measure Performance Professional PDF to dispense important information. This template comprises one stage. It also presents valuable insights into the topics including Abandonment Rate, Industry Benchmark, Performance. This is a completely customizable PowerPoint theme that can be put to use immediately. So, download it and address the topic impactfully.
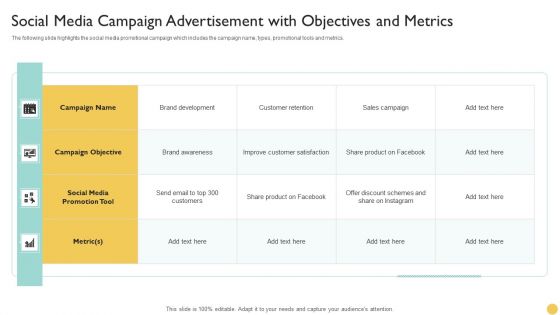
Social Media Campaign Advertisement With Objectives And Metrics Structure PDF
The following slide highlights the social media promotional campaign which includes the campaign name, types, promotional tools and metrics. Showcasing this set of slides titled Social Media Campaign Advertisement With Objectives And Metrics Structure PDF. The topics addressed in these templates are Campaign Objective, Brand Development, Brand Awareness. All the content presented in this PPT design is completely editable. Download it and make adjustments in color, background, font etc. as per your unique business setting.
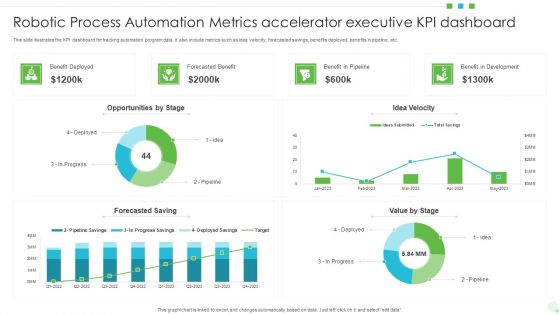
Robotic Process Automation Metrics Accelerator Executive KPI Dashboard Formats PDF
This slide illustrates the KPI dashboard for tracking automation program data. It also include metrics such as idea velocity, forecasted savings, benefits deployed, benefits in pipeline, etc. Showcasing this set of slides titled Robotic Process Automation Metrics Accelerator Executive KPI Dashboard Formats PDF. The topics addressed in these templates are Opportunities, Benefit In Development, Value. All the content presented in this PPT design is completely editable. Download it and make adjustments in color, background, font etc. as per your unique business setting.
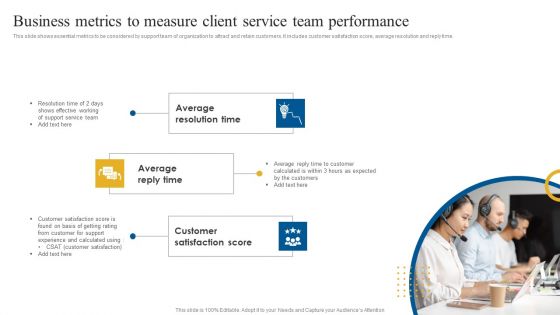
Business Metrics To Measure Client Service Team Performance Guidelines PDF
This slide shows essential metrics to be considered by support team of organization to attract and retain customers. It includes customer satisfaction score, average resolution and reply time. Presenting Business Metrics To Measure Client Service Team Performance Guidelines PDF to dispense important information. This template comprises three stages. It also presents valuable insights into the topics including Average Reply Time, Average Resolution Time, Customer Satisfaction Score. This is a completely customizable PowerPoint theme that can be put to use immediately. So, download it and address the topic impactfully.
Agile Virtual Project Management Agile Performance Evaluation Metrics Icons PDF
This slide covers the metrics used by the organisation to measure agile capability on the basis of product performance, security level and user satisfaction Present like a pro with Agile Virtual Project Management Agile Performance Evaluation Metrics Icons PDF Create beautiful presentations together with your team, using our easy-to-use presentation slides. Share your ideas in real-time and make changes on the fly by downloading our templates. So whether youre in the office, on the go, or in a remote location, you can stay in sync with your team and present your ideas with confidence. With Slidegeeks presentation got a whole lot easier. Grab these presentations today.
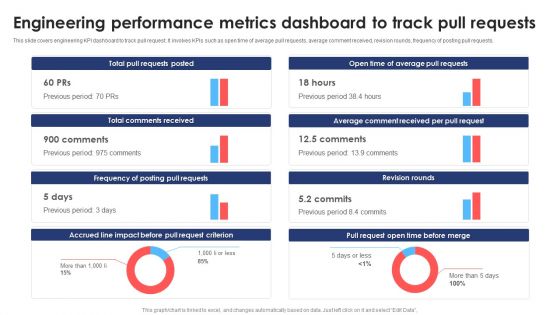
Engineering Performance Metrics Dashboard To Track Pull Requests Background PDF
This slide covers engineering KPI dashboard to track pull request. It involves KPIs such as open time of average pull requests, average comment received, revision rounds, frequency of posting pull requests. Pitch your topic with ease and precision using this Engineering Performance Metrics Dashboard To Track Pull Requests Background PDF. This layout presents information on Dashboard Track Pull Requests, Engineering Performance Metrics. It is also available for immediate download and adjustment. So, changes can be made in the color, design, graphics or any other component to create a unique layout.
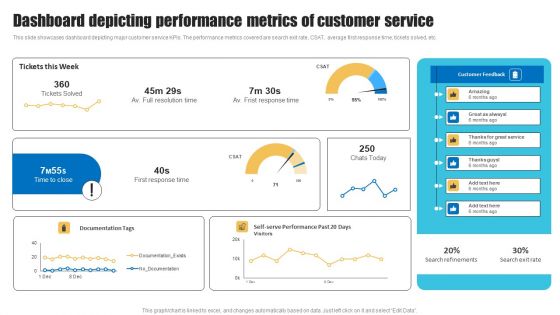
Dashboard Depicting Performance Metrics Of Customer Service Template PDF
This slide showcases dashboard depicting major customer service KPIs. The performance metrics covered are search exit rate, CSAT, average first response time, tickets solved, etc. Take your projects to the next level with our ultimate collection of Dashboard Depicting Performance Metrics Of Customer Service Template PDF. Slidegeeks has designed a range of layouts that are perfect for representing task or activity duration, keeping track of all your deadlines at a glance. Tailor these designs to your exact needs and give them a truly corporate look with your own brand colors they will make your projects stand out from the rest.

Current Team Performance Using Velocity Metrics Graphics PDF
This slide depicts the current performance of the team through a graph that shows the committed work to be done and the actual work that has been done. The tasks have been divided into various sprints and performance is measured in story points. Deliver and pitch your topic in the best possible manner with this current team performance using velocity metrics graphics pdf. Use them to share invaluable insights on current team performance using velocity metrics and impress your audience. This template can be altered and modified as per your expectations. So, grab it now.

Current Team Performance Using Velocity Metrics Clipart PDF
This slide depicts the current performance of the team through a graph that shows the committed work to be done and the actual work that has been done. The tasks have been divided into various sprints and performance is measured in story points. Deliver an awe-inspiring pitch with this creative current team performance using velocity metrics clipart pdf bundle. Topics like current team performance using velocity metrics can be discussed with this completely editable template. It is available for immediate download depending on the needs and requirements of the user.
Performance Tracking Metrics Of Marketing Return On Investment Graphics PDF
This slide shows various key performance indicators to measure performance of marketing ROI. It includes metrics such as unique monthly visitors, cost per lead, return on ad spend, average order value, etc. Showcasing this set of slides titled Performance Tracking Metrics Of Marketing Return On Investment Graphics PDF. The topics addressed in these templates are Cost Per Lead, Customer Lifetime Value, Unique Monthly Visitors. All the content presented in this PPT design is completely editable. Download it and make adjustments in color, background, font etc. as per your unique business setting.

Devops Business Performance Metrics Ppt Slides Inspiration PDF
This template covers metrics for evaluation of devOps performance on each stage such as operational efficiency, service quality, service velocity, business performance etc. Presenting devops business performance metrics ppt slides inspiration pdf to provide visual cues and insights. Share and navigate important information on five stages that need your due attention. This template can be used to pitch topics like customer value, organizational, service, business performance. In addtion, this PPT design contains high resolution images, graphics, etc, that are easily editable and available for immediate download.
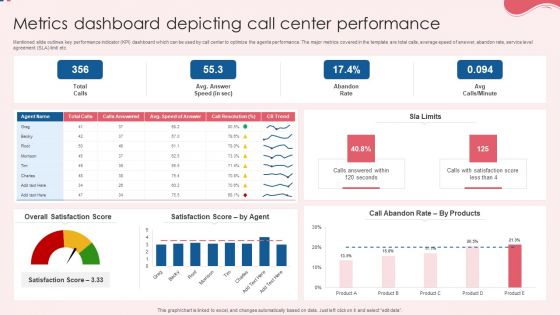
Metrics Dashboard Depicting Call Center Performance Pictures PDF
Mentioned slide outlines key performance indicator KPI dashboard which can be used by call center to optimize the agents performance. The major metrics covered in the template are total calls, average speed of answer, abandon rate, service level agreement SLA limit etc. Pitch your topic with ease and precision using this Metrics Dashboard Depicting Call Center Performance Pictures PDF. This layout presents information on Overall Satisfaction Score, Satisfaction Score, Performance. It is also available for immediate download and adjustment. So, changes can be made in the color, design, graphics or any other component to create a unique layout.

Dashboards Showing Consultancy Company Performance With Key Metrics Microsoft PDF
This slide shows the dashboard related to consultancy company performance which includes budget preparation, sales and goals. Company profits and goals etc.Presenting dashboards showing consultancy company performance with key metrics microsoft pdf to provide visual cues and insights. Share and navigate important information on four stages that need your due attention. This template can be used to pitch topics like dashboards showing consultancy company performance with key metrics. In addtion, this PPT design contains high resolution images, graphics, etc, that are easily editable and available for immediate download.

Key Performance Metrics For FY 2020 One Pager Documents
The slide shows the graphical representation of business performance. It represents the total human workforce, customer and social relationship and community partners associated with the business. Presenting you an exemplary Key Performance Metrics For FY 2020 One Pager Documents. Our one-pager comprises all the must-have essentials of an inclusive document. You can edit it with ease, as its layout is completely editable. With such freedom, you can tweak its design and other elements to your requirements. Download this Key Performance Metrics For FY 2020 One Pager Documents brilliant piece now.
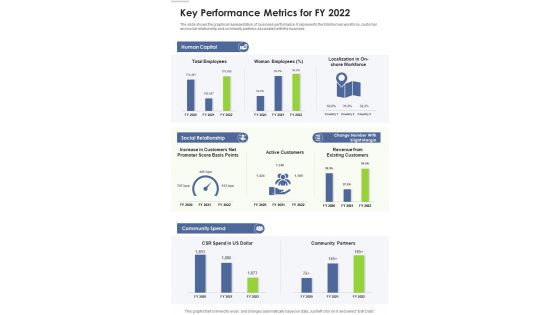
Key Performance Metrics For FY 2022 One Pager Documents
The slide shows the graphical representation of business performance. It represents the total human workforce, customer and social relationship and community partners associated with the business. Presenting you an exemplary Key Performance Metrics For FY 2022 One Pager Documents. Our one-pager comprises all the must-have essentials of an inclusive document. You can edit it with ease, as its layout is completely editable. With such freedom, you can tweak its design and other elements to your requirements. Download this Key Performance Metrics For FY 2022 One Pager Documents brilliant piece now.

Comparing Logistics Performance Metrics With Competitors Topics PDF
This slide focuses on the comparison of logistics performance metrics with competitors on the basis of parameters such as shipping time, order accuracy, equipment utilization rate, etc.Presenting Comparing Logistics Performance Metrics With Competitors Topics PDF to provide visual cues and insights. Share and navigate important information on one stage that need your due attention. This template can be used to pitch topics like Equipment Utilization, Warehousing Costs, Transportation Costs In addtion, this PPT design contains high resolution images, graphics, etc, that are easily editable and available for immediate download.
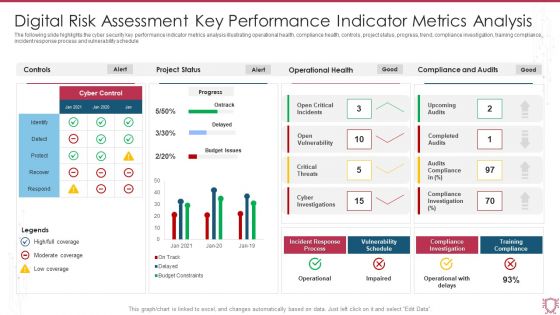
Digital Risk Assessment Key Performance Indicator Metrics Analysis Infographics PDF
The following slide highlights the cyber security key performance indicator metrics analysis illustrating operational health, compliance health, controls, project status, progress, trend, compliance investigation, training compliance, incident response process and vulnerability schedule. Showcasing this set of slides titled Digital Risk Assessment Key Performance Indicator Metrics Analysis Infographics PDF. The topics addressed in these templates are Project Status, Operational Health, Compliance And Audits. All the content presented in this PPT design is completely editable. Download it and make adjustments in color, background, font etc. as per your unique business setting.
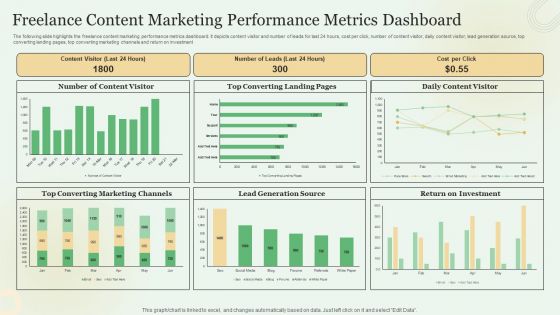
Freelance Content Marketing Performance Metrics Dashboard Elements PDF
The following slide highlights the freelance content marketing performance metrics dashboard. It depicts content visitor and number of leads for last 24 hours, cost per click, number of content visitor, daily content visitor, lead generation source, top converting landing pages, top converting marketing channels and return on investment. Showcasing this set of slides titled Freelance Content Marketing Performance Metrics Dashboard Elements PDF. The topics addressed in these templates are Lead Generation Source, Return On Investment, Converting Marketing Channels. All the content presented in this PPT design is completely editable. Download it and make adjustments in color, background, font etc. as per your unique business setting.
Education Metrics Tracker For Students Performance Evaluation Professional PDF
This slide covers student performance analysis dashboard. It include metrics student count, student attendance, average subject score, branch examination results, student count by grade, etc. Showcasing this set of slides titled Education Metrics Tracker For Students Performance Evaluation Professional PDF. The topics addressed in these templates are Students Count, Grade And Gender, Students Details, Examination Results Branch. All the content presented in this PPT design is completely editable. Download it and make adjustments in color, background, font etc. as per your unique business setting.

Business Referral Marketing Program Performance Metrics Dashboard Introduction PDF
This slide shows KPI dashboard to effectively track performance of business referral program in order to attract more leads and potential customers to the busines. It includes details related to key metrics such as referral participation rate, referred customers, referral conversion rate and total revenue generated. Showcasing this set of slides titled Business Referral Marketing Program Performance Metrics Dashboard Introduction PDF. The topics addressed in these templates are Referral Participation Rate, Referred Customers, Referral Conversion Rate, Total Revenue Generated. All the content presented in this PPT design is completely editable. Download it and make adjustments in color, background, font etc. as per your unique business setting.

Partner Relationship Management Performance Metrics Dashboard Pictures PDF
This slide represents the dashboard prepared with the help of a PRM software. It includes details related to partner opportunity pipeline, MDF budget, leads, demo units, co brand requests, certified partners, partners logins etc. Showcasing this set of slides titled Partner Relationship Management Performance Metrics Dashboard Pictures PDF. The topics addressed in these templates are Partner Opportunity Pipeline, MDF Budget, Performance Metrics Dashboard. All the content presented in this PPT design is completely editable. Download it and make adjustments in color, background, font etc. as per your unique business setting.
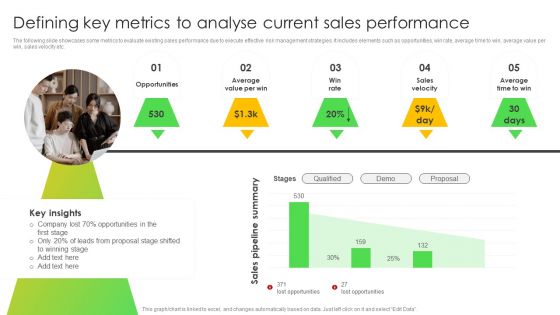
Defining Key Metrics To Analyse Current Sales Performance Background PDF
The following slide showcases some metrics to evaluate existing sales performance due to execute effective risk management strategies. It includes elements such as opportunities, win rate, average time to win, average value per win, sales velocity etc. Want to ace your presentation in front of a live audience Our Defining Key Metrics To Analyse Current Sales Performance Background PDF can help you do that by engaging all the users towards you. Slidegeeks experts have put their efforts and expertise into creating these impeccable powerpoint presentations so that you can communicate your ideas clearly. Moreover, all the templates are customizable, and easy to edit and downloadable. Use these for both personal and commercial use.

Highlighting Performance Metrics To Track Brand Awareness Designs PDF
This slide provides information regarding metrics to monitor brand awareness in terms of story reach, recommendations impressions, brand mentions, post engagement, page likes, page views, post reach, etc. The best PPT templates are a great way to save time, energy, and resources. Slidegeeks have 100 percent editable powerpoint slides making them incredibly versatile. With these quality presentation templates, you can create a captivating and memorable presentation by combining visually appealing slides and effectively communicating your message. Download Highlighting Performance Metrics To Track Brand Awareness Designs PDF from Slidegeeks and deliver a wonderful presentation.
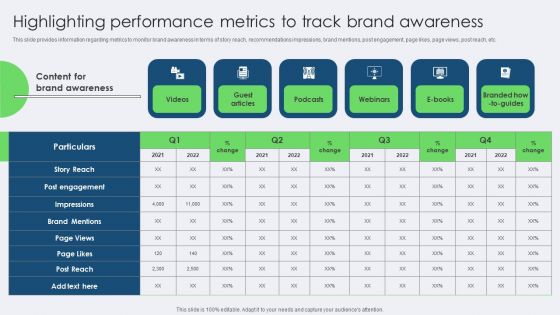
Highlighting Performance Metrics To Track Brand Awareness Portrait PDF
This slide provides information regarding metrics to monitor brand awareness in terms of story reach, recommendations impressions, brand mentions, post engagement, page likes, page views, post reach, etc. Boost your pitch with our creative Highlighting Performance Metrics To Track Brand Awareness Portrait PDF. Deliver an awe-inspiring pitch that will mesmerize everyone. Using these presentation templates you will surely catch everyones attention. You can browse the ppts collection on our website. We have researchers who are experts at creating the right content for the templates. So you do not have to invest time in any additional work. Just grab the template now and use them.

Essential Metrics For Loyalty Incentives Program Performance Microsoft PDF
This slide represents the key metrics to gauge customer satisfaction with a loyalty program. It includes information on four parameters, including the customer engagement score, net promoter score, and customer loyalty index, among others.Persuade your audience using this Essential Metrics For Loyalty Incentives Program Performance Microsoft PDF. This PPT design covers four stages, thus making it a great tool to use. It also caters to a variety of topics including Net Promoter Score, Customer Engagement Score. Download this PPT design now to present a convincing pitch that not only emphasizes the topic but also showcases your presentation skills.

Product Engineering Performance And Development Metrics Dashboard Topics PDF
This slide covers product engineering and development KPI dashboard to improve effectiveness. It involves data such as product development team, average result area scores and key result areas. Showcasing this set of slides titled Product Engineering Performance And Development Metrics Dashboard Topics PDF. The topics addressed in these templates are Product Development Team, Average, Cost. All the content presented in this PPT design is completely editable. Download it and make adjustments in color, background, font etc. as per your unique business setting.
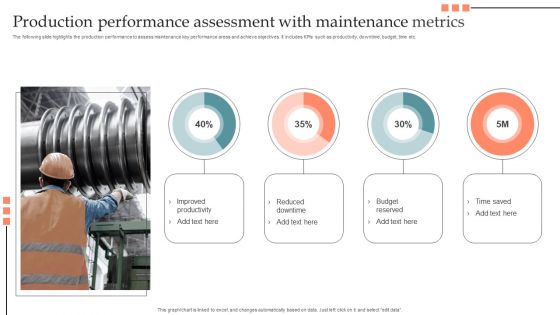
Production Performance Assessment With Maintenance Metrics Portrait PDF
The following slide highlights the production performance to assess maintenance key performance areas and achieve objectives. It includes KPIs such as productivity, downtime, budget, time etc. Showcasing this set of slides titled Production Performance Assessment With Maintenance Metrics Portrait PDF. The topics addressed in these templates are Improved Productivity, Reduced Downtime, Budget Reserved, Time Saved. All the content presented in this PPT design is completely editable. Download it and make adjustments in color, background, font etc. as per your unique business setting.

Stock Performance Metrics For Warehouse Management Ppt Tips PDF
This slide indicates the inventory KPIs for warehouse management which helps in improving logistics business activities. It includes parameters such as financial, productivity, utilization, etc. Showcasing this set of slides titled Stock Performance Metrics For Warehouse Management Ppt Tips PDF. The topics addressed in these templates are Receiving, Financial, Productivity. All the content presented in this PPT design is completely editable. Download it and make adjustments in color, background, font etc. as per your unique business setting.

KPI Metrics Dashboard Highlighting Employee Retention Rate Structure PDF
The purpose of this slide is to exhibit a key performance indicator KPI dashboard through which managers can analyze the monthly employee retention rate. The metrics covered in the slide are active employees, new candidates hired, internal, exit, employee turnover rate, etc. Do you have to make sure that everyone on your team knows about any specific topic I yes, then you should give KPI Metrics Dashboard Highlighting Employee Retention Rate Structure PDF a try. Our experts have put a lot of knowledge and effort into creating this impeccable KPI Metrics Dashboard Highlighting Employee Retention Rate Structure PDF. You can use this template for your upcoming presentations, as the slides are perfect to represent even the tiniest detail. You can download these templates from the Slidegeeks website and these are easy to edit. So grab these today.
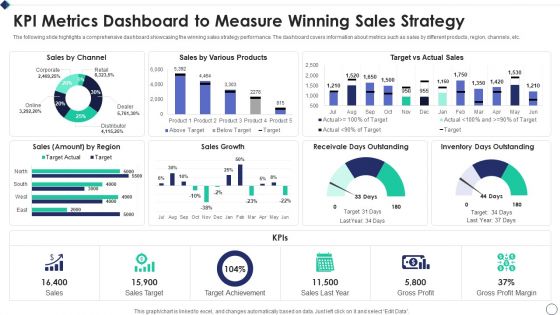
KPI Metrics Dashboard To Measure Winning Sales Strategy Ideas PDF
The following slide highlights a comprehensive dashboard showcasing the winning sales strategy performance. The dashboard covers information about metrics such as sales by different products, region, channels, etc.Showcasing this set of slides titled KPI Metrics Dashboard To Measure Winning Sales Strategy Ideas PDF The topics addressed in these templates are Sales By Channel, Various Products, Inventory Outstanding All the content presented in this PPT design is completely editable. Download it and make adjustments in color, background, font etc. as per your unique business setting.
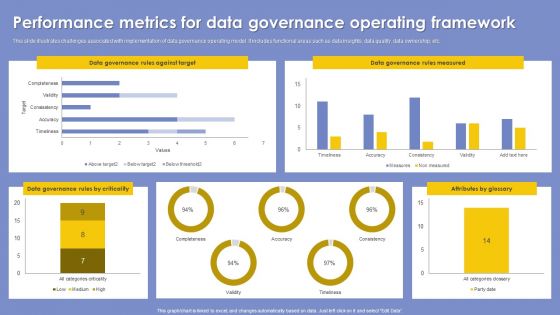
Performance Metrics For Data Governance Operating Framework Summary PDF
This slide illustrates challenges associated with implementation of data governance operating model. It includes functional areas such as data insights, data quality, data ownership, etc. Showcasing this set of slides titled Performance Metrics For Data Governance Operating Framework Summary PDF. The topics addressed in these templates are Attributes By Glossary, Rules Measured, Rules Against Target. All the content presented in this PPT design is completely editable. Download it and make adjustments in color, background, font etc. as per your unique business setting.

Yearly Project Engineering Performance Metrics Dashboard Information PDF
This slide covers project engineering KPI dashboard on yearly basis. It involves KPIs such as total revenue, support cost, research and development cost and units economics. Pitch your topic with ease and precision using this Yearly Project Engineering Performance Metrics Dashboard Information PDF. This layout presents information on Support Cost, Revenue, Measures. It is also available for immediate download and adjustment. So, changes can be made in the color, design, graphics or any other component to create a unique layout.

Devops Deployment And Frequency Performance Metrics Ppt Portfolio Files PDF
This template covers devOps deployment, change in value, lead time customer ticket software performance indicators This is a devops deployment and frequency performance metrics ppt portfolio files pdf template with various stages. Focus and dispense information on nine stages using this creative set, that comes with editable features. It contains large content boxes to add your information on topics like deployments, performance, customer. You can also showcase facts, figures, and other relevant content using this PPT layout. Grab it now.

Commodity Bundle Costing Metrics For Brands Structure PDF
This slide presents key metrics to be tracked by brands using product bundle pricing, helpful in monitoring effectiveness od strategy and overall profits. It includes average order value, best and least performing bundles, annual growth and comparison of sales. Presenting Commodity Bundle Costing Metrics For Brands Structure PDF to dispense important information. This template comprises four stages. It also presents valuable insights into the topics including AOV, Best Least Performing Bundles, Annual Growth Of Product, Comparison Sales Positive Reception. This is a completely customizable PowerPoint theme that can be put to use immediately. So, download it and address the topic impactfully.
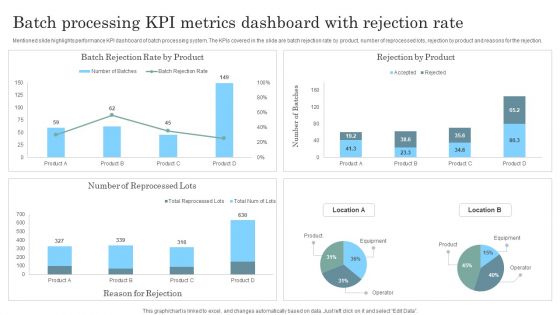
Batch Processing KPI Metrics Dashboard With Rejection Rate Topics PDF
Mentioned slide highlights performance KPI dashboard of batch processing system. The KPIs covered in the slide are batch rejection rate by product, number of reprocessed lots, rejection by product and reasons for the rejection. Pitch your topic with ease and precision using this Batch Processing KPI Metrics Dashboard With Rejection Rate Topics PDF. This layout presents information on Batch Processing KPI Metrics, Dashboard Rejection Rate. It is also available for immediate download and adjustment. So, changes can be made in the color, design, graphics or any other component to create a unique layout.

Call Center Metrics Dashboard With Average Response Time Inspiration PDF
Mentioned slide outlines KPI dashboard which can be used by call center to measure the performance of their agents. The key metrics highlighted in the dashboard are first call resolution, daily abandonment rate, total number of calls by topic, top performing call agents etc. Showcasing this set of slides titled Call Center Metrics Dashboard With Average Response Time Inspiration PDF. The topics addressed in these templates are Efficiency, Quality, Activity, Daily Average Response, Daily Average Transfer. All the content presented in this PPT design is completely editable. Download it and make adjustments in color, background, font etc. as per your unique business setting.
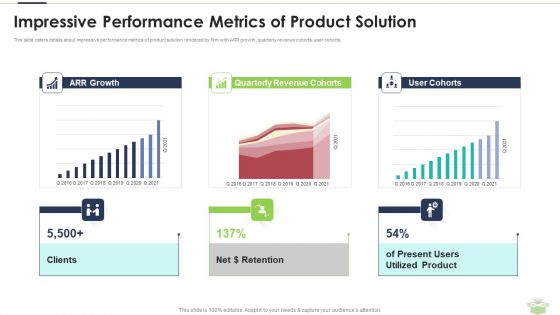
Impressive Performance Metrics Of Product Solution Rules PDF
Deliver and pitch your topic in the best possible manner with this impressive performance metrics of product solution rules pdf. Use them to share invaluable insights on revenue, growth, product and impress your audience. This template can be altered and modified as per your expectations. So, grab it now.
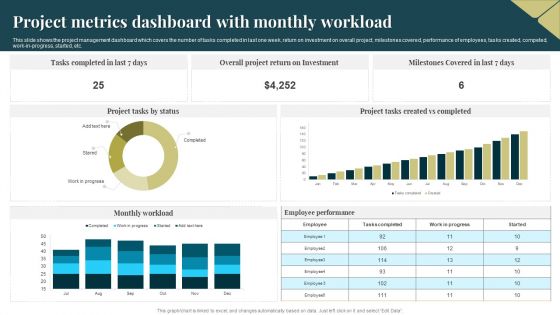
Project Metrics Dashboard With Monthly Workload Topics PDF
This slide shows the project management dashboard which covers the number of tasks completed in last one week, return on investment on overall project, milestones covered, performance of employees, tasks created, competed, work in progress, started, etc. Pitch your topic with ease and precision using this Project Metrics Dashboard With Monthly Workload Topics PDF. This layout presents information on Investment, Employee Performance, Project Metrics Dashboard. It is also available for immediate download and adjustment. So, changes can be made in the color, design, graphics or any other component to create a unique layout.
Dashboard For Tracking Sales Target Metrics Introduction PDF
This slide presents KPI dashboard for tracking Sales Target Metrics achievement monthly and region wise helpful in adjusting activities as per ongoing performance. It includes average weekly sales revenue, average sales target, annual sales growth, regional sales performance and average revenue per unit that should be regularly tracked. Showcasing this set of slides titled Dashboard For Tracking Sales Target Metrics Introduction PDF. The topics addressed in these templates are Average Revenue, Per Unit, Average Weekly, Sales Revenue. All the content presented in this PPT design is completely editable. Download it and make adjustments in color, background, font etc. as per your unique business setting.
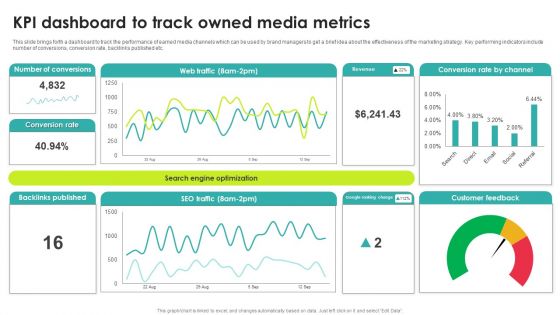
Kpi Dashboard To Track Owned Media Metrics Rules PDF
This slide brings forth a dashboard to track the performance of earned media channels which can be used by brand managers to get a brief idea about the effectiveness of the marketing strategy. Key performing indicators include number of conversions, conversion rate, backlinks published etc. Pitch your topic with ease and precision using this Kpi Dashboard To Track Owned Media Metrics Rules PDF. This layout presents information on Conversions, Backlinks Published, Metrics. It is also available for immediate download and adjustment. So, changes can be made in the color, design, graphics or any other component to create a unique layout.

Progressive Business Performance Measurement Metrics Sales Ppt Pictures Guidelines PDF
Presenting this set of slides with name progressive business performance measurement metrics sales ppt pictures guidelines pdf. The topics discussed in these slides are sales, growth, targeted, revenue, performance. This is a completely editable PowerPoint presentation and is available for immediate download. Download now and impress your audience.

 Home
Home