Sliding Scale
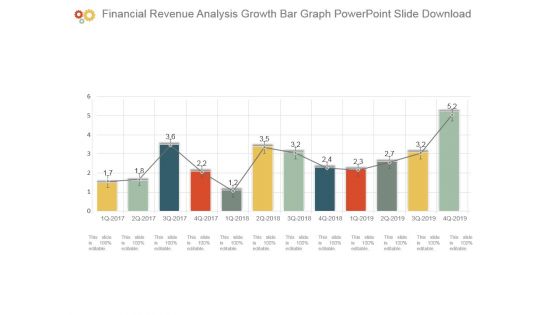
Financial Revenue Analysis Growth Bar Graph Powerpoint Slide Download
This is a financial revenue analysis growth bar graph powerpoint slide download. This is a twelve stage process. The stages in this process are bar graph, business, marketing, growth, success.
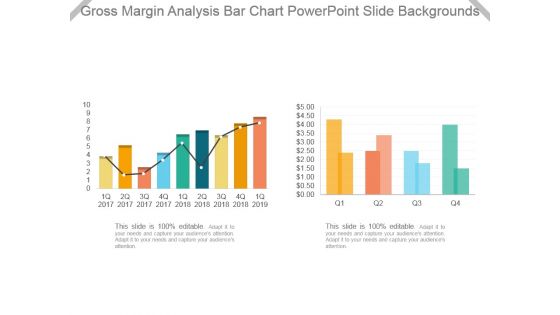
Gross Margin Analysis Bar Chart Powerpoint Slide Backgrounds
This is a gross margin analysis bar chart powerpoint slide backgrounds. This is a two stage process. The stages in this process are bar graph, business, marketing, growth, success.
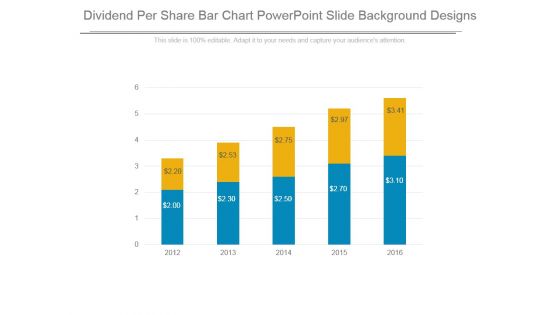
Dividend Per Share Bar Chart Powerpoint Slide Background Designs
This is a dividend per share bar chart powerpoint slide background designs. This is a five stage process. The stages in this process are business, marketing, success, growth, bar graph.
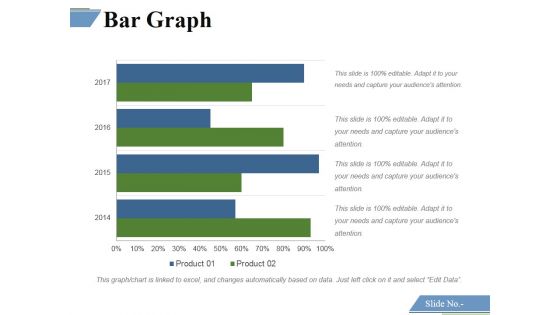
Bar Graph Ppt PowerPoint Presentation Infographics Slide Download
This is a bar graph ppt powerpoint presentation infographics slide download. This is a four stage process. The stages in this process are bar graph, finance, marketing, strategy, analysis.
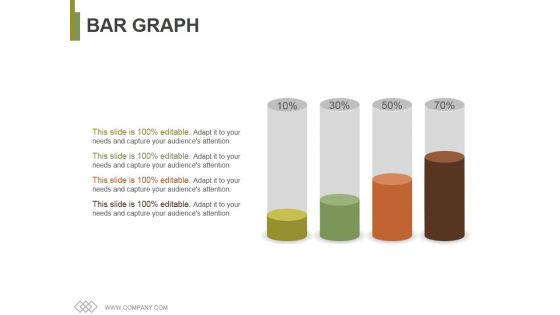
Bar Graph Ppt PowerPoint Presentation Pictures Slide Portrait
This is a bar graph ppt powerpoint presentation pictures slide portrait. This is a four stage process. The stages in this process are bar graph, growth, success, business, marketing.
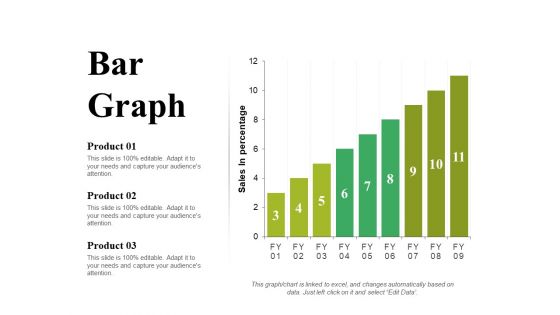
Bar Graph Ppt PowerPoint Presentation Portfolio Slide Portrait
This is a bar graph ppt powerpoint presentation portfolio slide portrait. This is a three stage process. The stages in this process are product, sales in percentage, bar graph, growth, success.

Stacked Bar Ppt PowerPoint Presentation Inspiration Slide Download
This is a stacked bar ppt powerpoint presentation inspiration slide download. This is a two stage process. The stages in this process are stacked bar, finance, marketing, management, investment, analysis.
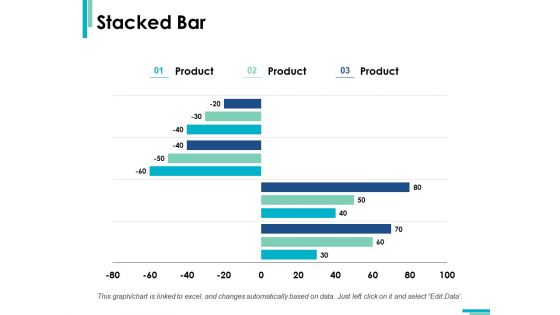
Stacked Bar Finance Marketing Ppt PowerPoint Presentation Summary Slide Download
This is a stacked bar finance marketing ppt powerpoint presentation summary slide download. This is a three stage process. The stages in this process are stacked bar, finance, marketing, analysis, investment.

Stock Photo Business Graph With Colorful Bars PowerPoint Slide
This image is designed with business graph with colorful bars. Use this image slide in presentations related to business success, strategy planning etc. This template is innovatively designed to highlight your worthy views.
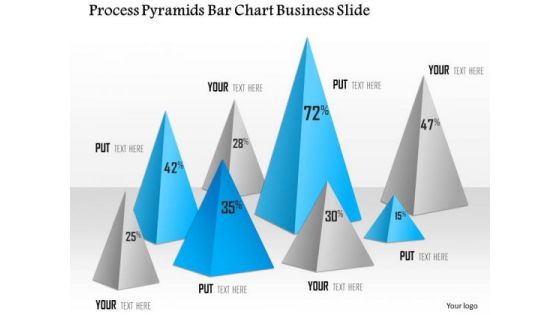
Business Diagram Process Pyramids Bar Chart Business Slide Presentation Template
Graphic of pyramid and bar chart has been used to design this power point template diagram. This PPT diagram contains the concept of business result analysis and process flow. Use this template slide and display result in your presentations.

Stock Photo Bar Graph With Percentage For Finance PowerPoint Slide
This Power Point template has been designed with graphic of bar graph and percentage value. This image slide contains the concept of finance and accounting. Use this editable diagram for your business and finance related presentations.
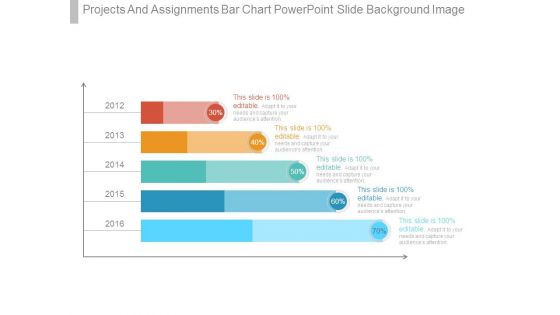
Projects And Assignments Bar Chart Powerpoint Slide Background Image
This is a projects and assignments bar chart powerpoint slide background image. This is a five stage process. The stages in this process are finance, presentation, business, strategy, marketing.
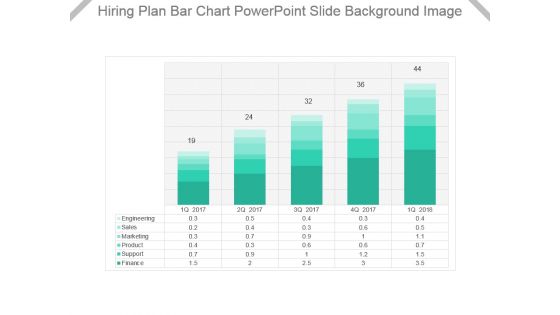
Hiring Plan Bar Chart Powerpoint Slide Background Image
This is a hiring plan bar chart powerpoint slide background image. This is a five stage process. The stages in this process are engineering, sales, marketing, product, support, finance.
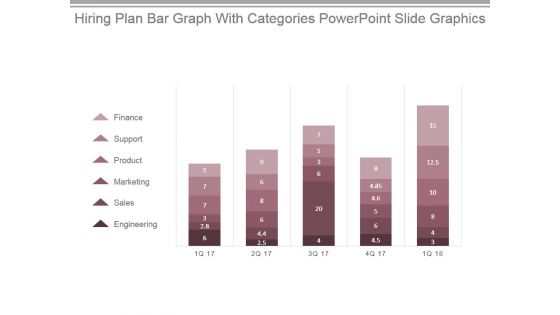
Hiring Plan Bar Graph With Categories Powerpoint Slide Graphics
This is a hiring plan bar graph with categories powerpoint slide graphics. This is a five stage process. The stages in this process are finance, support, product, marketing, sales, engineering.
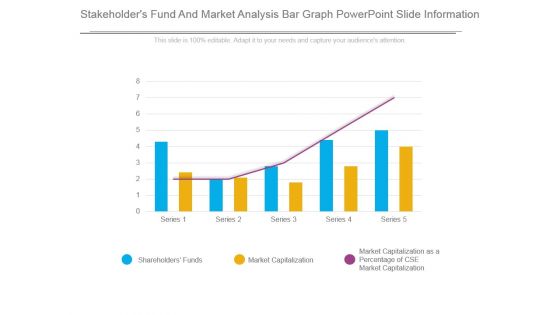
Stakeholders Fund And Market Analysis Bar Graph Powerpoint Slide Information
This is a stakeholders fund and market analysis bar graph powerpoint slide information. This is a five stage process. The stages in this process are shareholders funds, market capitalization, market capitalization as a percentage of cse market capitalization.
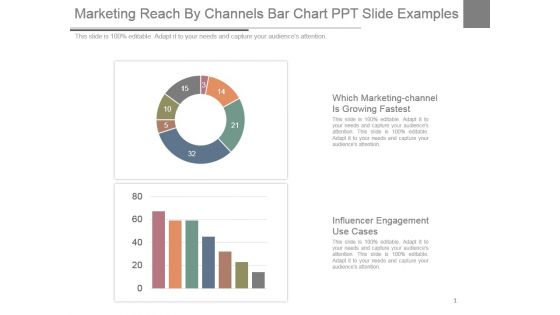
Marketing Reach By Channels Bar Chart Ppt Slide Examples
This is a marketing reach by channels bar chart ppt slide examples. This is a two stage process. The stages in this process are which marketing-channel is growing fastest, influencer engagement use cases.

Inflation Rate Analysis Bar Graph Powerpoint Slide Backgrounds
This is a inflation rate analysis bar graph powerpoint slide backgrounds. This is a twelve stage process. The stages in this process are jan, feb, mar, apr, may, jun, jul, aug, sep, oct, nov, dec.

Clustered Bar Ppt PowerPoint Presentation Show Slide Portrait
This is a clustered bar ppt powerpoint presentation show slide portrait. This is a four stage process. The stages in this process are product, unit count, graph, business, marketing.

Stacked Bar Ppt PowerPoint Presentation Styles Slide Portrait
This is a stacked bar ppt powerpoint presentation styles slide portrait. This is a three stage process. The stages in this process are unit count, business, marketing, strategy, graph, finance.

Clustered Bar Ppt PowerPoint Presentation Outline Slide Download
This is a clustered bar ppt powerpoint presentation outline slide download. This is a three stage process. The stages in this process are unit count, finance, marketing, business, graph.

Stacked Bar Graph Ppt PowerPoint Presentation Portfolio Slide Portrait
This is a stacked bar graph ppt powerpoint presentation portfolio slide portrait. This is a three stage process. The stages in this process are finance, marketing, management, investment, analysis.

Donut Pie Chart Bar Ppt PowerPoint Presentation Infographics Slide Portrait
This is a donut pie chart bar ppt powerpoint presentation infographics slide portrait. This is a four stage process. The stages in this process are finance, marketing, analysis, investment, million.
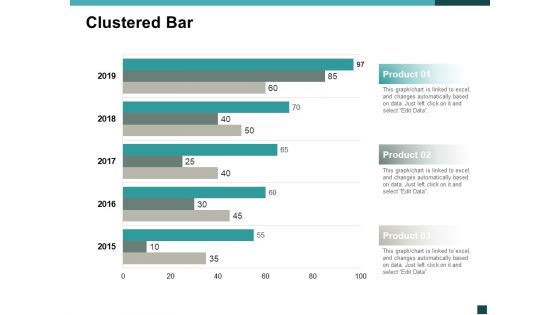
Clustered Bar Finance Ppt Powerpoint Presentation Portfolio Slide Portrait
This is a clustered bar finance ppt powerpoint presentation portfolio slide portrait. This is a three stage process. The stages in this process are finance, marketing, management, investment, analysis.

Stacked Bar Slide Planning Ppt PowerPoint Presentation Portfolio Ideas
This is a stacked bar slide planning ppt powerpoint presentation portfolio ideas. The topics discussed in this diagram are marketing, business, management, planning, strategy This is a completely editable PowerPoint presentation, and is available for immediate download.

Stock Photo Green Grass Business Growth Chart PowerPoint Slide
This PowerPoint slide display chart created with green grass. This image slide has been crafted with graphic of green grass bar graph. This image depicts business. Use this image slide to express views on targets, goals, growth and management in your presentations. This image slide exhibits various information which requires visual aid. Enhance the quality of your presentations using this image.
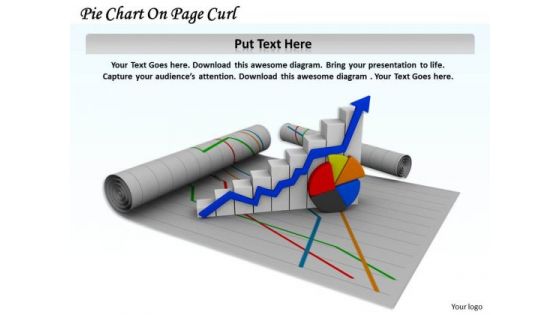
Stock Photo Pie Chart On Page Curl Arrow PowerPoint Slide
This image slide displays pie chart and growth bar graph on page curl. Use this image slide, in your presentations to express views on progress, growth and achievements. This image slide may also be used to depict strategic business planning. Make professional presentations using this image slide.

Stock Photo Pie Chart On Page Curl PowerPoint Slide
This image slide displays pie chart and growth bar graph on page curl on blue shaded background. Use this image slide, in your presentations to express views on progress, growth and achievements. This image slide may also be used to depict strategic business planning. Make professional presentations using this image slide.

Ppt Slide Bar Graph For Growth Of Business Plan
Edit Your Work With Our PPT Slide bar graph for growth of business plan Powerpoint Templates. They Will Help You Give The Final Form. Be Your Own Editor With Our Business Plan Powerpoint Templates. Align Your Thoughts As Per Your Wishes.
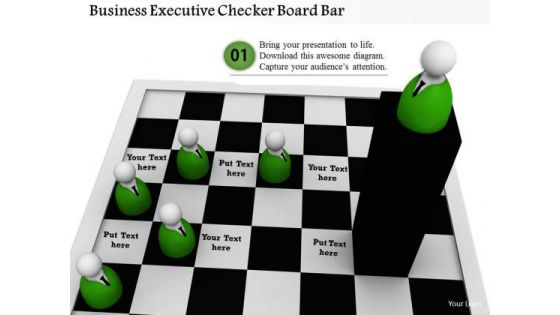
Stock Photo Business Executive Checker Board Bar PowerPoint Slide
This image slide displays 3d leader standing with his follower on a chess board. This image is designed with 3d team standing with leader on chess board depicting of team strategy and team planning. Use this image to make business presentations.
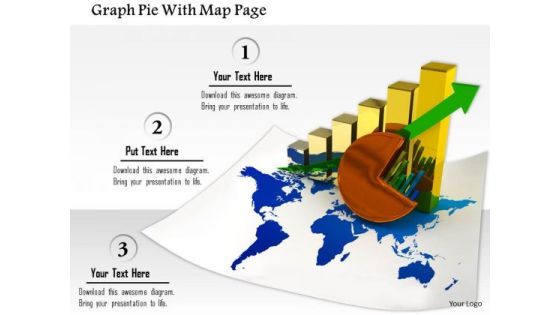
Stock Photo Graph Pie With Map Page PowerPoint Slide
This image slide contains business charts on world map. This image is designed with bar graph and pie chart on world map depicting global economy. Use this image slide to represent financial growth in any business presentation.
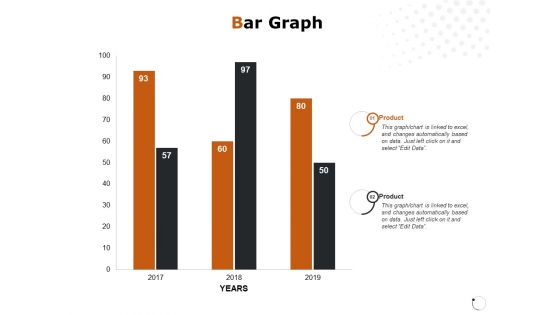
Bar Graph Financial Ppt PowerPoint Presentation Professional Master Slide
Presenting this set of slides with name bar graph financial ppt powerpoint presentation professional master slide. The topics discussed in these slides are bar graph, product, year, finance, marketing. This is a completely editable PowerPoint presentation and is available for immediate download. Download now and impress your audience.

Stacked Bar Financial Ppt PowerPoint Presentation Outline Master Slide
Presenting this set of slides with name stacked bar financial ppt powerpoint presentation outline master slide. The topics discussed in these slides are marketing, business, management, planning, strategy. This is a completely editable PowerPoint presentation and is available for immediate download. Download now and impress your audience.
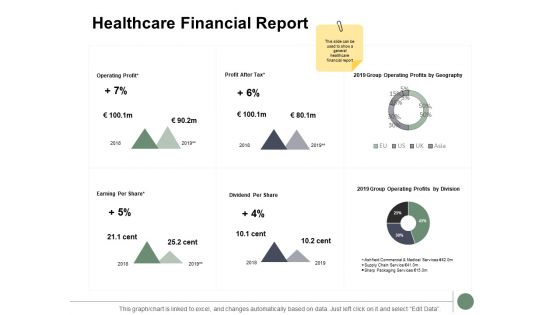
Healthcare Financial Report Ppt PowerPoint Presentation Portfolio Slide Download
Presenting this set of slides with name healthcare financial report ppt powerpoint presentation portfolio slide download. The topics discussed in these slides are bar graph, finance, marketing, analysis, investment. This is a completely editable PowerPoint presentation and is available for immediate download. Download now and impress your audience.
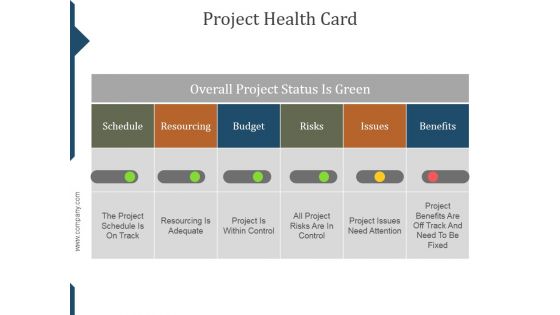
Project Health Card Ppt PowerPoint Presentation Slide Download
This is a project health card ppt powerpoint presentation slide download. This is a four stage process. The stages in this process are column, pie, column, bar.
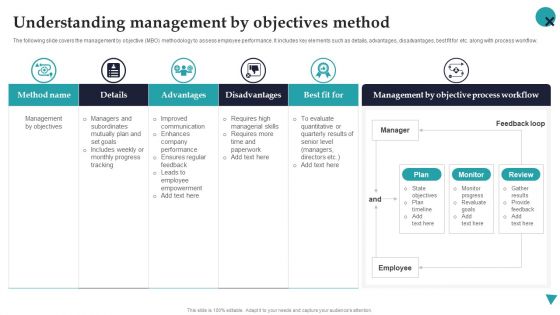
Understanding Management By Objectives Method Employee Performance Management Topics PDF
The following slide illustrates the behaviorally anchored rating scale BARS method to evaluate individual performance based on pre-determined standards. It includes key elements such as details, advantages, disadvantages, best fit for etc.Do you have to make sure that everyone on your team knows about any specific topic I yes, then you should give Understanding Management By Objectives Method Employee Performance Management Topics PDF a try. Our experts have put a lot of knowledge and effort into creating this impeccable Understanding Management By Objectives Method Employee Performance Management Topics PDF. You can use this template for your upcoming presentations, as the slides are perfect to represent even the tiniest detail. You can download these templates from the Slidegeeks website and these are easy to edit. So grab these today.
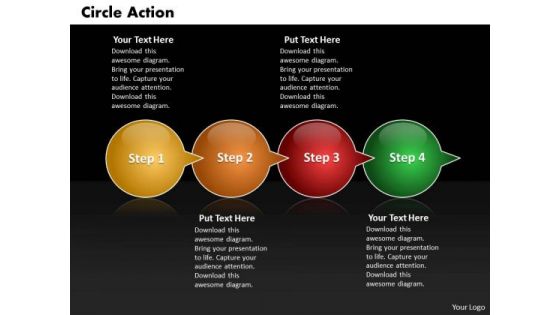
Ppt Circle Action Through Bubbles 4 PowerPoint Slide Numbers Templates
PPT circle action through bubbles 4 powerpoint slide numbers Templates-Use this multicolored Bubbles PPT Slide to explain a formal business process. Process operations are represented by circle, and arrows connecting them represent flow of control.-PPT circle action through bubbles 4 powerpoint slide numbers Templates-Add, Aqua, Arrows, Badges, Bar, Blend, Blue, Bright, Bubbles, Buttons, Caution, Circle, Drop, Elements, Glossy, Glowing, Graphic, Heart, Help, Icons, Idea, Illustration, Navigation, Oblong, Plus, Round, Service, Shadow, Shiny, Sign, Speech, Squares

Business Diagram Persons Standing On Books Presentation Slide Template
This power point diagram template has been crafted with graphic of bar graph made with books and 3d man. This diagram template contains the concept of education and success. Use this diagram slide for your business and education presentation.

Stock Photo Business Graph Of Two Thousand Fifteen PowerPoint Slide
This Business Power Point image template has been designed with graphic of bar graph of 2015 year text. This image template contains the concept of new year planning. This image slide can be used for business and finance related presentations.

Revenue Growth Over The Years Powerpoint Slide Designs
This is a revenue growth over the years powerpoint slide designs. This is a five stage process. The stages in this process are bar graph, years, business, growth, marketing.

Financial Revenue Analysis Growth Chart Powerpoint Slide Deck
This is a financial revenue analysis growth chart powerpoint slide deck. This is a nine stage process. The stages in this process are growth, success, business, marketing, bar graph.

Year Based Revenue Growth Chart Powerpoint Slide Show
This is a year based revenue growth chart powerpoint slide show. This is a five stage process. The stages in this process are bar graph, growth, revenue, year, success.

Target Market Size And Growth Ppt PowerPoint Presentation Slide Download
This is a target market size and growth ppt powerpoint presentation slide download. This is a eight stage process. The stages in this process are business, marketing, success, planning, bar graph.
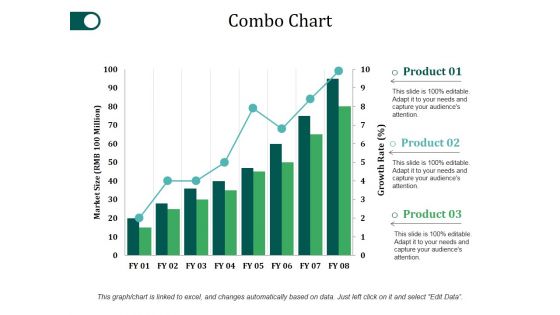
Combo Chart Ppt PowerPoint Presentation Inspiration Slide Portrait
This is a combo chart ppt powerpoint presentation inspiration slide portrait. This is a three stage process. The stages in this process are product, market size, bar chart, growth, success.

Profitability Ratios Template 3 Ppt PowerPoint Presentation Gallery Slide Portrait
This is a profitability ratios template 3 ppt powerpoint presentation gallery slide portrait. This is a four stage process. The stages in this process are category, roce, net income, business, bar graph.

Column Chart Ppt PowerPoint Presentation Portfolio Slide Download
This is a column chart ppt powerpoint presentation portfolio slide download. This is a two stage process. The stages in this process are product, year, bar graph, success, business.

Column Chart Ppt PowerPoint Presentation Gallery Slide Portrait
This is a column chart ppt powerpoint presentation gallery slide portrait. This is a two stage process. The stages in this process are sales in percentage, financial year, product, bar graph, growth.
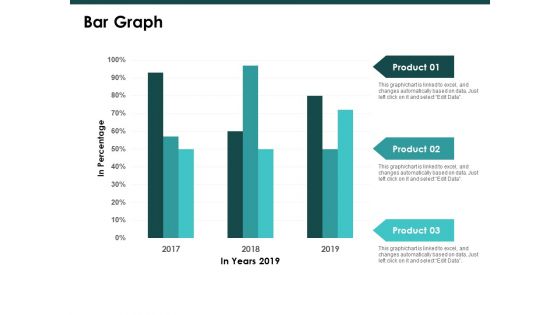
Bar Graph Finance Ppt PowerPoint Presentation Styles Slide
This is a bar graph finance ppt powerpoint presentation styles slide. This is a three stage process. The stages in this process are finance, marketing, management, investment, analysis.

Bar Chart Finance Marketing Ppt PowerPoint Presentation Portfolio Slide
This is a bar chart finance marketing ppt powerpoint presentation portfolio slide. This is a two stage process. The stages in this process are bar chart, finance, marketing, business, analysis.
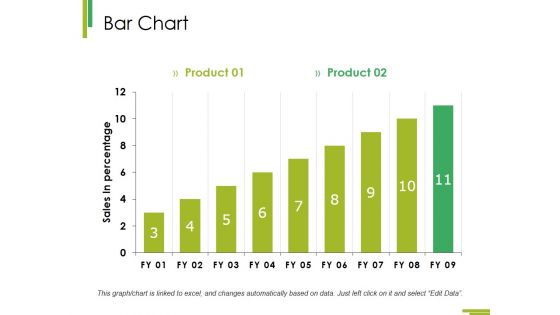
Bar Chart Ppt PowerPoint Presentation Infographic Template Master Slide
This is a bar chart ppt powerpoint presentation infographic template master slide. This is a two stage process. The stages in this process are growth, finance, business, analysis, marketing.

Bar Chart Finance Ppt PowerPoint Presentation Model Master Slide
This is a bar chart finance ppt powerpoint presentation model master slide. This is a two stage process. The stages in this process are finance, marketing, management, investment, analysis.
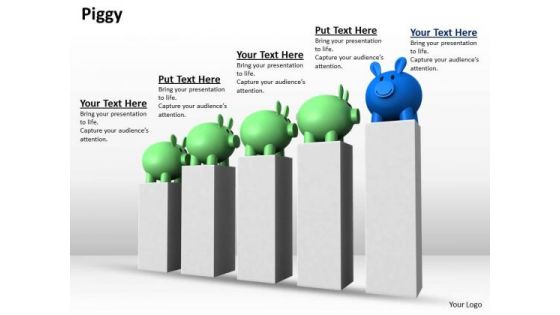
Stock Photo Piggy Banks Of Bar Graph PowerPoint Slide
This image is designed with piggy banks on bar graph. This image portrays the concepts of saving and investment. You may use this image to make outstanding presentations.
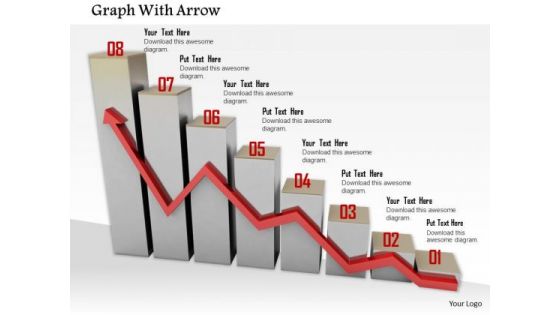
Stock Photo Red Growth Arrow On Bar Graph PowerPoint Slide
Explain the concepts of business growth with this unique image. This image has been designed with red growth arrow on bar graph. Use this image in business and finance related topics
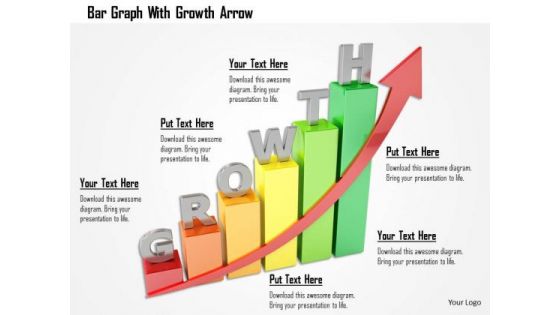
Stock Photo Bar Graph With Growth Arrow PowerPoint Slide
This creative image displays design of Bar Graph with Growth Arrow. This image has been designed to depict business on an Upward Trend. Create an impact with this quality image and make professional presentations.

Stock Photo Chairs Around Table With Bar Graph PowerPoint Slide
The above image shows unique design of chairs around table with bar graph. This professional image of designed to portray concept of business meeting on facts and figures. Employ the right colors for your brilliant ideas. Help your viewers automatically empathize with your thoughts.

Stock Photo Arrow Growth Bar Graph On Phone Pwerpoint Slide
This graphic image has been designed with graphic of smart phone with growth bar graph. This image contains the concept of business growth analysis. Use this image for business and marketing related analysis presentations. Display finance growth analysis in an graphical way with this exclusive image.

Ppt Circle Series Through Bubbles 4 PowerPoint Slide Numbers Templates
PPT circle series through bubbles 4 powerpoint slide numbers Templates-This PowerPoint Diagram shows Circular Bubbles diagram which can be used to show relationships between four parts of an overall concept. It shows the consecutive concepts to be explained together in one process. This Diagram will fit for Business Presentations.-PPT circle series through bubbles 4 powerpoint slide numbers Templates-Add, Aqua, Arrows, Badges, Bar, Blend, Blue, Bright, Bubbles, Buttons, Caution, Circle, Drop, Elements, Glossy, Glowing, Graphic, Heart, Help, Icons, Idea, Illustration, Navigation, Oblong, Plus, Round, Service, Shadow, Shiny, Sign, Speech, Squares

Ppt Circular Speech Bubbles Horizontal 3 PowerPoint Slide Numbers Templates
PPT circular speech bubbles horizontal 3 powerpoint slide numbers Templates-This PowerPoint Diagram shows the three interconnected stages represented by Circular speech bubbles. This explains the third step of the procedure. This Diagram will fit for Business Presentations. PowerPoint text boxes diagram are designed to help you place your text in a professional layout.-PPT circular speech bubbles horizontal 3 powerpoint slide numbers Templates-Add, Aqua, Arrows, Badges, Bar, Blend, Blue, Bright, Bubbles, Buttons, Caution, Circle, Drop, Elements, Glossy, Glowing, Graphic, Heart, Help, Icons, Idea, Illustration, Navigation, Oblong, Plus, Round, Service, Shadow, Shiny, Sign, Speech, Squares

Ppt Action Of 4 PowerPoint Slide Numbers Involved Procedure Templates
PPT action of 4 powerpoint slide numbers involved procedure Templates-Use this circular arrow speech bubbles diagram to show a series of events or timeline information. This circular arrow description diagram make your audience understand, essential elements of your overall strategy of business deal. Create captivating presentations to deliver comparative and weighted arguments. -PPT action of 4 powerpoint slide numbers involved procedure Templates-Add, Aqua, Arrows, Badges, Bar, Blend, Blue, Bright, Bubbles, Buttons, Caution, Circle, Drop, Elements, Glossy, Glowing, Graphic, Heart, Help, Icons, Idea, Illustration, Navigation, Oblong, Plus, Round, Service, Shadow, Shiny, Sign, Speech, Squares

Ppt Descending Process 7 PowerPoint Slide Numbers Diagram Templates
PPT descending process 7 powerpoint slide numbers diagram Templates-This Appealing PowerPoint Diagram consists of our pre-designed circle organized charts for you. This PowerPoint Diagram is particularly suitable for displaying contexts, relations and individual steps of a concept or consecutive items. This Diagram will fit for Business Presentations. You can change color, size and orientation of any icon to your liking. -PPT descending process 7 powerpoint slide numbers diagram Templates-Add, Aqua, Arrows, Badges, Bar, Blend, Blue, Bright, Bubbles, Buttons, Caution, Circle, Drop, Elements, Glossy, Glowing, Graphic, Heart, Help, Icons, Idea, Illustration, Navigation, Oblong, Plus, Round, Service, Shadow, Shiny, Sign, Speech, Squares
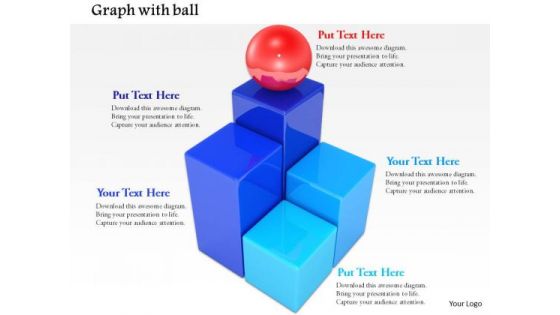
Stock Photo Red Ball On Top Of Bars PowerPoint Slide
This professional image can strengthen your corporate design. This image has been professionally designed to emphasize the concept of leadership. It increases the effectiveness of your work.

 Home
Home