Sliding Scale
Icons Slide For Coffee Bar Go To Market Strategy GTM SS V
Download our innovative and attention grabbing Icons Slide For Coffee Bar Go To Market Strategy GTM SS V template. The set of slides exhibit completely customizable icons. These icons can be incorporated into any business presentation. So download it immediately to clearly communicate with your clientele.
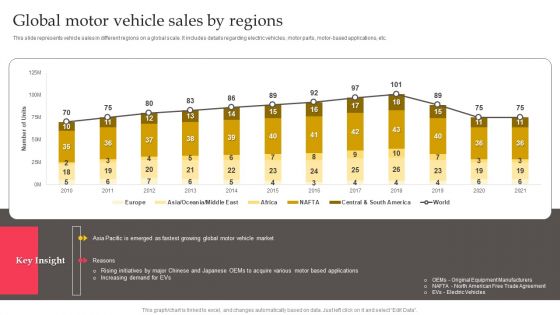
Executing Automotive Marketing Tactics For Sales Boost Global Motor Vehicle Sales Graphics PDF
This slide represents vehicle sales in different regions on a global scale. It includes details regarding electric vehicles, motor parts, motor-based applications, etc. Take your projects to the next level with our ultimate collection of Executing Automotive Marketing Tactics For Sales Boost Global Motor Vehicle Sales Graphics PDF. Slidegeeks has designed a range of layouts that are perfect for representing task or activity duration, keeping track of all your deadlines at a glance. Tailor these designs to your exact needs and give them a truly corporate look with your own brand colors they will make your projects stand out from the rest.
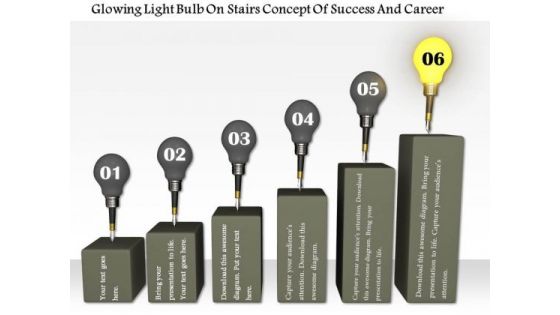
Stock Photo Glowing Bulb On Top Of Bar Graph PowerPoint Slide
This conceptual image slide displays bulbs on bar graph. This image slide has been crafted with graphic of bar graph and bulbs and individual glowing bulb. This image slide depicts success and carrier. Use this image slide to express views on leadership, teamwork, success, achievements and growth in your presentations. This image slide may also be used to represent different business strategies. Create beautiful presentations using this image slide.
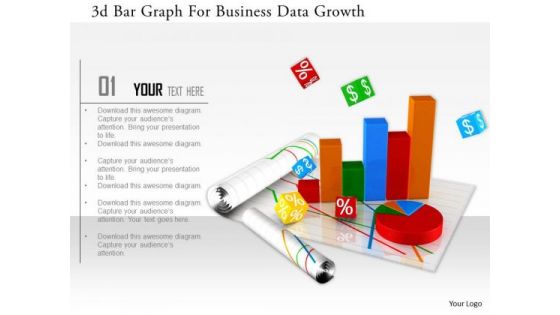
Stock Photo 3d Bar Graph For Business Data Growth Image Graphics For PowerPoint Slide
This image slide has graphics of financial charts and reports. This contains bar graph and pie chart to present business reports. Build an innovative presentations using this professional image slide.
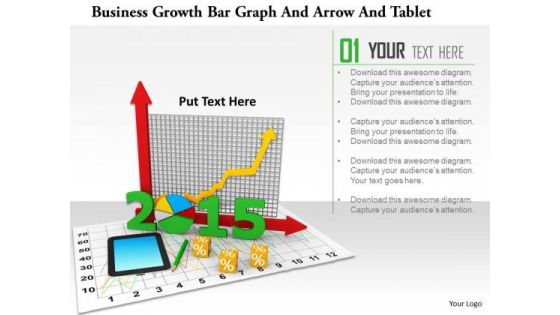
Stock Photo Business Growth Bar Graph And Arrow And Tablet PowerPoint Slide
This PowerPoint template has been designed with graphic of bar graph and arrow with tablet. This unique image slide depicts the concept of business growth and success. Use this image slide to build exclusive presentation for your viewers.

Stock Photo Blue Bar Graph With Growth Arrow For Business PowerPoint Slide
This image slide displays bar graph with growth arrow. This image has been designed with graphic of blue colored bar graph embedded with growth arrow . Use this image slide, in your presentations to express views on finance, growth and achievements. This image slide may also be used to exhibit any information which requires visual presentation in your presentations. This image slide will enhance the quality of your presentations.

Stock Photo Colorful Bar Graph For Business Result Display PowerPoint Slide
This image slide displays bar graph. This image has been designed with graphic of 3d multicolor bar graph of solid cylinder shape. Use this image slide, in your presentations to express views on finance, growth and success. This image slide may also be used to exhibit any information which requires visual presentation in your presentations. This image slide will enhance the quality of your presentations.
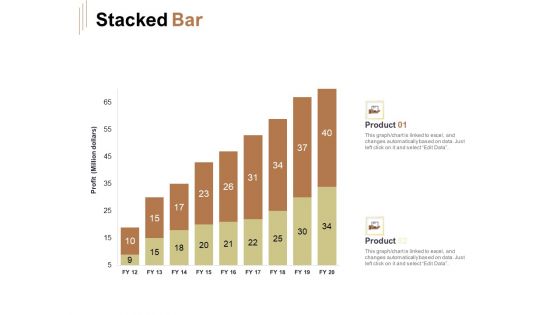
Raise Capital For Business Stacked Bar Ppt Infographics Master Slide PDF
Presenting this set of slides with name raise capital for business stacked bar ppt infographics master slide pdf. The topics discussed in these slide is stacked bar. This is a completely editable PowerPoint presentation and is available for immediate download. Download now and impress your audience.
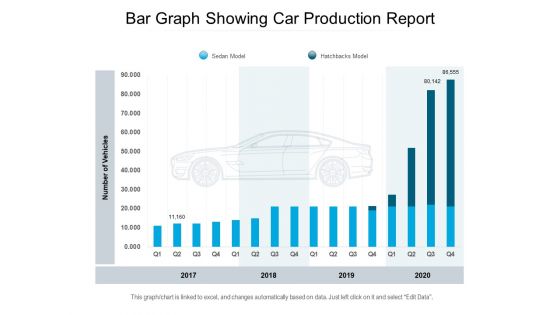
Bar Graph Showing Car Production Report Ppt PowerPoint Presentation Outline Master Slide PDF
Presenting this set of slides with name bar graph showing car production report ppt powerpoint presentation outline master slide pdf. The topics discussed in these slides are sedan model, hatchbacks model, 2017 to 2020. This is a completely editable PowerPoint presentation and is available for immediate download. Download now and impress your audience.

Email Security Market Research Report Stacked Bar Ppt Styles Slide PDF
Presenting this set of slides with name email security market research report stacked bar ppt styles slide pdf. The topics discussed in these slides are product 1, product 2. This is a completely editable PowerPoint presentation and is available for immediate download. Download now and impress your audience.
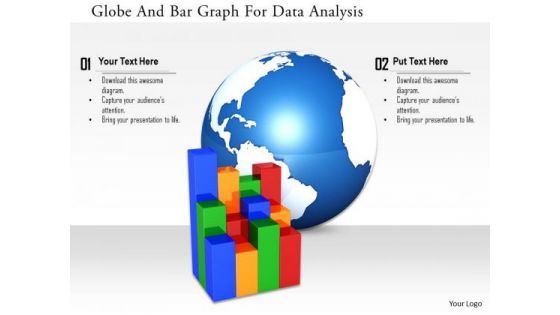
Stock Photo Globe And Bar Graph For Data Analysis Image Graphics For PowerPoint Slide
This image slide has been designed with business graph with globe in background. This image slide represents topics like global business, economic growth. This image will enhance the quality of your presentations.
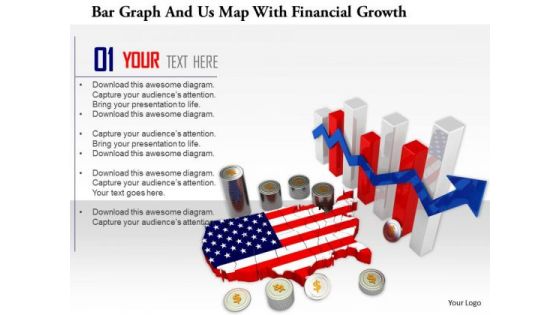
Stock Photo Bar Graph And Us Map With Financial Growth PowerPoint Slide
This image displays American map with business graph in background. This image slide contains the concept of American economy, business growth and reports. Use this amazing slide to make professional presentations.
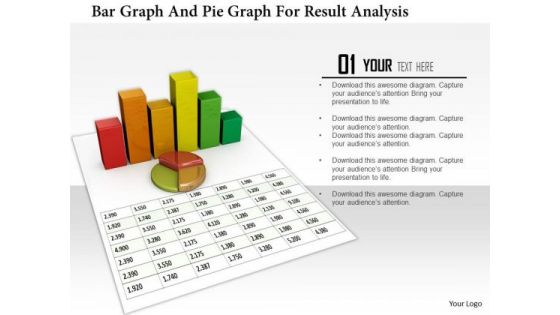
Stock Photo Bar Graph And Pie Graph For Result Analysis PowerPoint Slide
3D business graphs have been used to design this PowerPoint template. This Image slide is suitable to make business reports and charts. This slide can be used for business and marketing presentations.
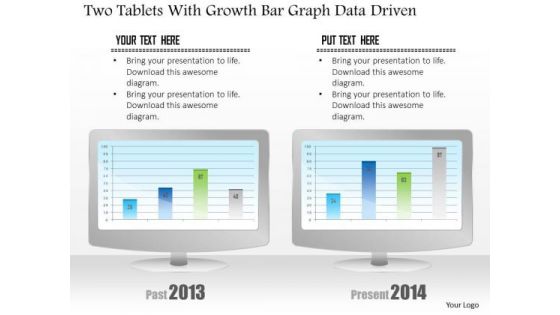
Business Diagram Two Tablets With Growth Bar Graph Data Driven PowerPoint Slide
This business diagram has been designed with comparative charts on tablets. This slide suitable for data representation. You can also use this slide to present business reports and information. Use this diagram to present your views in a wonderful manner.

Stock Photo Bar And Pie Graph For Year 2015 PowerPoint Slide
Get Out Of The Dock With Our stock photo bar and pie graph for year 2015 powerpoint slide Powerpoint Templates. Your Mind Will Be Set Free.

Return Of Investment Bar Chart For Business Powerpoint Slide Designs Download
This is a return of investment bar chart for business powerpoint slide designs download. This is a four stage process. The stages in this process are product.

Bar Chart Showing Increase In Consumption Ppt PowerPoint Presentation Gallery Slide Download PDF
Presenting this set of slides with name bar chart showing increase in consumption ppt powerpoint presentation gallery slide download pdf. This is a three stage process. The stages in this process are bar chart showing increase in consumption. This is a completely editable PowerPoint presentation and is available for immediate download. Download now and impress your audience.
Challenge Icon Men On Bar Graph Vector Icon Ppt PowerPoint Presentation Gallery Slide PDF
Presenting this set of slides with name challenge icon men on bar graph vector icon ppt powerpoint presentation gallery slide pdf. This is a three stage process. The stages in this process are challenge icon men on bar graph vector icon. This is a completely editable PowerPoint presentation and is available for immediate download. Download now and impress your audience.
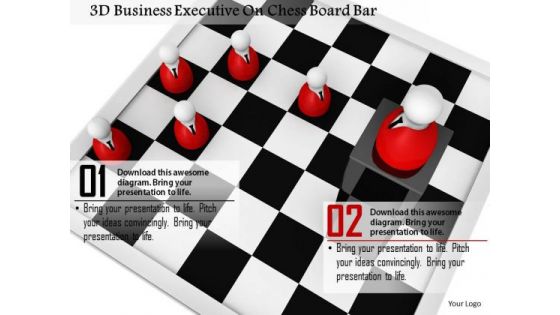
Stock Photo 3d Business Executive On Chess Board Bar PowerPoint Slide
This Power Point slide has been crafted with graphic of business executives on chess board. We have also graphic of executives on chess board to display team strategy concept. Use this image slide in your presentation and create an exclusive presentation for your viewers.
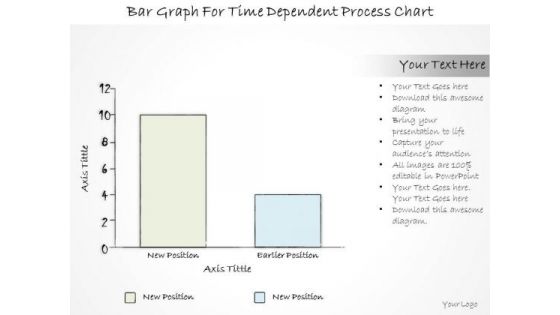
Ppt Slide Bar Graph For Time Dependent Process Chart Consulting Firms
Land The Idea With Our PPT Slide bar graph for time dependent process chart consulting firms Powerpoint Templates. Help It Grow With Your Thoughts. Cover The Compass With Our Business Plan Powerpoint Templates. Your Ideas Will Be Acceptable To All.
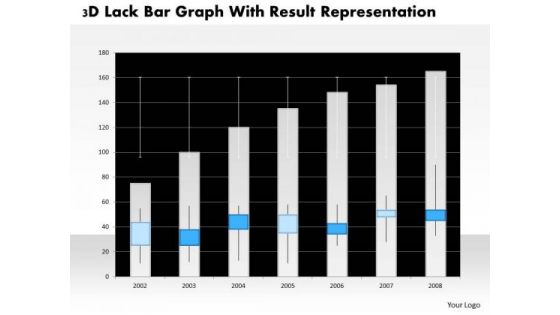
Business Diagram 3d Lack Bar Graph With Result Representation PowerPoint Slide
This business diagram has graphic of 3d lack bar graph. This diagram is a data visualization tool that gives you a simple way to present statistical information. This slide helps your audience examine and interpret the data you present.
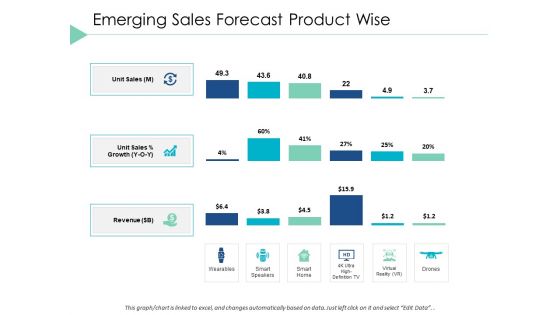
Emerging Sales Forecast Product Wise Bar Ppt PowerPoint Presentation Portfolio Slide Portrait
This is a emerging sales forecast product wise bar ppt powerpoint presentation portfolio slide portrait. This is a four stage process. The stages in this process are finance, marketing, analysis, investment, million.

Stock Photo World Map On Bar Graph For Data Growth Image Graphics For PowerPoint Slide
This image is designed with blue graph with world map printed on it. This conceptual image portrays the concepts of global business and global economy. This image slide will help you express your views to target audience.
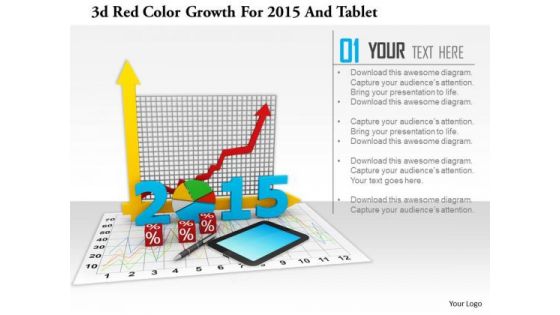
Stock Photo 3d Red Color Growth For 2015 And Tablet PowerPoint Slide
This image slide has graphics of financial charts and reports. This contains bar graph and pie chart to present business reports. Build an innovative presentation using this professional image slide.
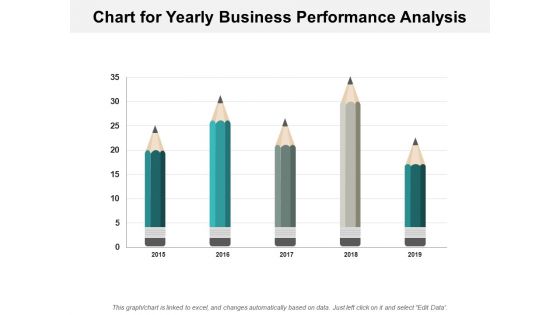
Chart For Yearly Business Performance Analysis Ppt PowerPoint Presentation Slide Download
Presenting this set of slides with name chart for yearly business performance analysis ppt powerpoint presentation slide download. The topics discussed in these slides are education, growth, pencil bar graph. This is a completely editable PowerPoint presentation and is available for immediate download. Download now and impress your audience.
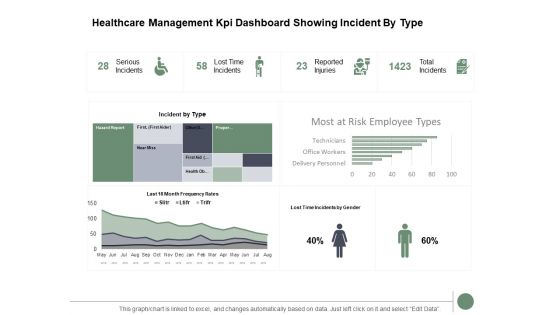
Healthcare Management Kpi Dashboard Showing Incident By Type Ppt PowerPoint Presentation Gallery Slide Download
Presenting this set of slides with name healthcare management kpi dashboard showing incident by type ppt powerpoint presentation gallery slide download. The topics discussed in these slides are bar graph, finance, marketing, analysis, investment. This is a completely editable PowerPoint presentation and is available for immediate download. Download now and impress your audience.
Bar Graph Showing Future Sales Vector Icon Ppt PowerPoint Presentation File Master Slide PDF
Presenting bar graph showing future sales vector icon ppt powerpoint presentation file master slide pdf to dispense important information. This template comprises three stages. It also presents valuable insights into the topics including bar graph showing future sales vector icon. This is a completely customizable PowerPoint theme that can be put to use immediately. So, download it and address the topic impactfully.
Statistical Analysis Icon With Gear Bar Chart Ppt PowerPoint Presentation Gallery Master Slide PDF
Presenting statistical analysis icon with gear bar chart ppt powerpoint presentation gallery master slide pdf to dispense important information. This template comprises three stages. It also presents valuable insights into the topics including statistical analysis icon with gear bar chart. This is a completely customizable PowerPoint theme that can be put to use immediately. So, download it and address the topic impactfully.
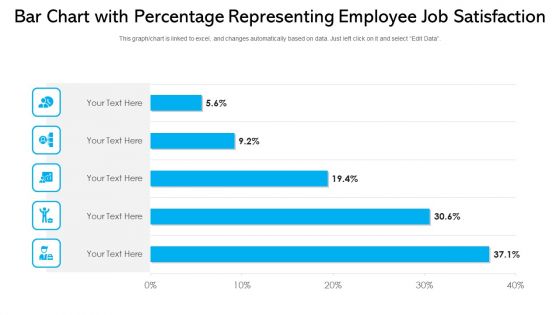
Bar Chart With Percentage Representing Employee Job Satisfaction Ppt PowerPoint Presentation File Slide Download PDF
Pitch your topic with ease and precision using this bar chart with percentage representing employee job satisfaction ppt powerpoint presentation file slide download pdf. This layout presents information on bar chart with percentage representing employee job satisfaction. It is also available for immediate download and adjustment. So, changes can be made in the color, design, graphics or any other component to create a unique layout.
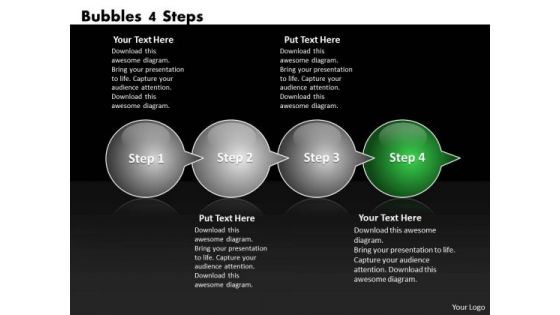
Ppt Circle Process Through Bubbles 4 Steps Working With Slide Numbers PowerPoint Templates
PPT circle process through bubbles 4 steps working with slide numbers PowerPoint Templates-Use this highlighted green Bubble Slide to explain a third step in business process. Process operations are represented by circle, and arrows connecting them represent flow of control.-PPT circle process through bubbles 4 steps working with slide numbers PowerPoint Templates-Add, Aqua, Arrows, Badges, Bar, Blend, Blue, Bright, Bubbles, Buttons, Caution, Circle, Drop, Elements, Glossy, Glowing, Graphic, Heart, Help, Icons, Idea, Illustration, Navigation, Oblong, Plus, Round, Service, Shadow, Shiny, Sign, Speech, Squares

Bar Chart Showing Various Bullying Activities Ppt PowerPoint Presentation Professional Slide PDF
Pitch your topic with ease and precision using this bar chart showing various bullying activities ppt powerpoint presentation professional slide pdf. This layout presents information on unjustified criticism or complaints, deliberately excluding someone from workplace activities, deliberately denying access to information or other resources, verbal abusing, humiliating a person through gestures, sarcasm, teasing and insults in front of others, spreading rumors about someone. It is also available for immediate download and adjustment. So, changes can be made in the color, design, graphics or any other component to create a unique layout.

Bar Graph Showing Negative Trend Ppt PowerPoint Presentation Summary Master Slide
Presenting this set of slides with name bar graph showing negative trend ppt powerpoint presentation summary master slide. This is a one stage process. The stages in this process are bar graph showing negative trend. This is a completely editable PowerPoint presentation and is available for immediate download. Download now and impress your audience.

Demonstration Of Angled Process Bar Chart Ppt Business Plan PowerPoint Slide
We present our demonstration of angled process bar chart ppt business plan PowerPoint Slide.Present our Marketing PowerPoint Templates because Timeline crunches are a fact of life. Meet all deadlines using our PowerPoint Templates and Slides. Download and present our Construction PowerPoint Templates because Your ideas provide food for thought. Our PowerPoint Templates and Slides will help you create a dish to tickle the most discerning palate. Present our Spheres PowerPoint Templates because Our PowerPoint Templates and Slides are the chords of your song. String them along and provide the lilt to your views. Present our Boxes PowerPoint Templates because You can Channelise the thoughts of your team with our PowerPoint Templates and Slides. Urge them to focus on the goals you have set. Download our Business PowerPoint Templates because Our PowerPoint Templates and Slides offer you the needful to organise your thoughts. Use them to list out your views in a logical sequence.Use these PowerPoint slides for presentations relating to 3d, human, cube, isolated, activity, achievement, business, success, decisions, teamwork, partnership, stack, occupation, people, building, shape, team, box, illustration, figure, creativity, togetherness, games, aspirations, group, growth, text, picking, progress, working, silhouette, puzzle, construction, concepts, structure, cartoon, ideas. The prominent colors used in the PowerPoint template are Red, White, Gray.
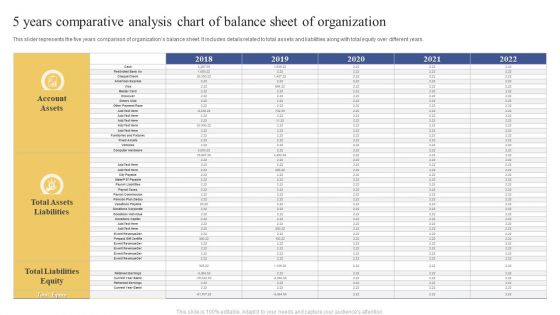
5 Years Comparative Analysis Chart Of Balance Sheet Of Organization Ppt Inspiration Slide PDF
This slider represents the five years comparison of organizations balance sheet. It includes details related to total assets and liabilities along with total equity over different years. Pitch your topic with ease and precision using this 5 Years Comparative Analysis Chart Of Balance Sheet Of Organization Ppt Inspiration Slide PDF. This layout presents information on Account Assets, Total Assets Liabilities, Total Liabilities Equity. It is also available for immediate download and adjustment. So, changes can be made in the color, design, graphics or any other component to create a unique layout.

Ppt Consecutive Illustration Of 5 PowerPoint Slide Numbers Through Arrows 1 Templates
PPT consecutive illustration of 5 powerpoint slide numbers through arrows 1 Templates-This PowerPoint Diagram represents controls and mechanisms. Use it to illustrate a stepwise process or a phase structure.-PPT consecutive illustration of 5 powerpoint slide numbers through arrows 1 Templates-Add, Aqua, Arrows, Badges, Bar, Blend, Blue, Bright, Bubbles, Buttons, Caution, Circle, Drop, Elements, Glossy, Glowing, Graphic, Heart, Help, Icons, Idea, Illustration, Navigation, Oblong, Plus, Round, Service, Shadow, Shiny, Sign, Speech, Squares
Ppt Circular Arrow PowerPoint Design Download Of 5 Slide Numbers Templates
PPT circular arrow powerpoint design download of 5 slide numbers Templates-This PowerPoint Diagram will let you explain the five basic concepts of Corporate world. This PowerPoint diagram can be used for business process automation and other business related issues.-PPT circular arrow powerpoint design download of 5 slide numbers Templates-Add, Aqua, Arrows, Badges, Bar, Blend, Blue, Bright, Bubbles, Buttons, Caution, Circle, Drop, Elements, Glossy, Glowing, Graphic, Heart, Help, Icons, Idea, Illustration, Navigation, Oblong, Plus, Round, Service, Shadow, Shiny, Sign, Speech, Squares

Ppt Text Circles Slanting Arrow 6 Steps Working With Slide Numbers Business PowerPoint Templates
PPT text circles slanting arrow 6 steps working with slide numbers Business PowerPoint Templates-This Six Stage PowerPoint diagram helps you to analyze all the connected ideas and also can be used to show all aspects of an issue. This PowerPoint Linear process diagram is used to show interrelated ideas or concepts. This diagram is useful in just about any type of presentation. The ideas and plans are on your fingertips. Now imprint them on the minds of your audience via our slides. You can apply other 3D Styles and shapes to the slide to enhance your presentations.-PPT text circles slanting arrow 6 steps working with slide numbers Business PowerPoint Templates-Add, Aqua, Arrows, Badges, Bar, Blend, Blue, Bright, Bubbles, Buttons, Caution, Circle, Drop, Elements, Glossy, Glowing, Graphic, Heart, Help, Icons, Idea, Illustration, Navigation, Oblong, Plus, Round, Service, Shadow, Shiny, Sign, Speech, Squares

Ppt Application Of 4 Steps Working With Slide Numbers Involved Procedur PowerPoint Templates
PPT application of 4 steps working with slide numbers involved procedur PowerPoint Templates-This chart visualize the process steps, reoccurrences and components or of your company structure or product features. These premium graphics are especially suitable for chronologies, sequences. This Diagram will fit for Business processes like Marketing, Management etc. You can show various processes with these linear designed Circular pieces. -PPT application of 4 steps working with slide numbers involved procedur PowerPoint Templates-Add, Aqua, Arrows, Badges, Bar, Blend, Blue, Bright, Bubbles, Buttons, Caution, Circle, Drop, Elements, Glossy, Glowing, Graphic, Heart, Help, Icons, Idea, Illustration, Navigation, Oblong, Plus, Round, Service, Shadow, Shiny, Sign, Speech, Squares
Ppt Connections Travel Text Circles 7 Steps Working With Slide Numbers Diagram PowerPoint Templates
PPT connections travel text circles 7 steps working with slide numbers diagram PowerPoint Templates-This Business Oriented Chart will definitely help you to be more Successful. Use this graphics as key element in streamlining your plans. It consists of Circular Bubbles connected together to form a complete process. This diagram is suitable for business and technical professionals who need to quickly and easily visualize, explore, and communicate information. -PPT connections travel text circles 7 steps working with slide numbers diagram PowerPoint Templates-Add, Aqua, Arrows, Badges, Bar, Blend, Blue, Bright, Bubbles, Buttons, Caution, Circle, Drop, Elements, Glossy, Glowing, Graphic, Heart, Help, Icons, Idea, Illustration, Navigation, Oblong, Plus, Round, Service, Shadow, Shiny, Sign, Speech, Squares
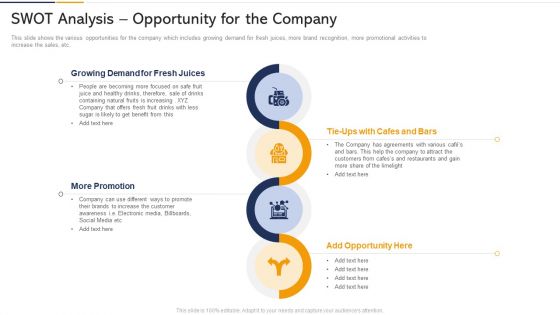
SWOT Analysis Opportunity For The Company Ppt Inspiration Master Slide PDF
This slide shows the various opportunities for the company which includes growing demand for fresh juices, more brand recognition, more promotional activities to increase the sales, etc. Presenting swot analysis opportunity for the company ppt inspiration master slide pdf to provide visual cues and insights. Share and navigate important information on four stages that need your due attention. This template can be used to pitch topics like growing demand for fresh juices, promotion, tie ups with cafes and bars, opportunity. In addtion, this PPT design contains high resolution images, graphics, etc, that are easily editable and available for immediate download.

Growth Arrow On Bar Graph Vector Ppt Powerpoint Presentation Layouts Master Slide
This is a growth arrow on bar graph vector ppt powerpoint presentation layouts master slide. This is a three stage process. The stages in this process are increasing arrows, improving arrows, growing arrows.
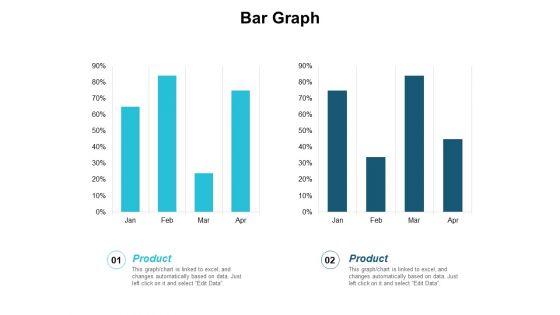
Bar Graph Finance Planning Ppt PowerPoint Presentation Infographic Template Master Slide
This is a bar graph finance planning ppt powerpoint presentation infographic template master slide. This is a two stage process. The stages in this process are finance, analysis, business, investment, marketing.
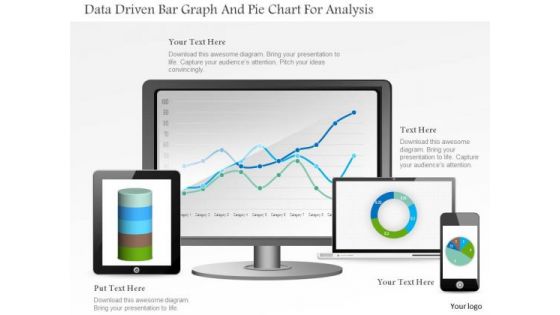
Business Diagram Data Driven Bar Graph And Pie Chart For Analysis PowerPoint Slide
This PowerPoint template displays technology gadgets with various business charts. Use this diagram slide, in your presentations to make business reports for statistical analysis. You may use this diagram to impart professional appearance to your presentations.

Business Diagram Tablet With Pie And Business Bar Graph For Result Analysis PowerPoint Slide
This PowerPoint template displays technology gadgets with various business charts. Use this diagram slide, in your presentations to make business reports for statistical analysis. You may use this diagram to impart professional appearance to your presentations.
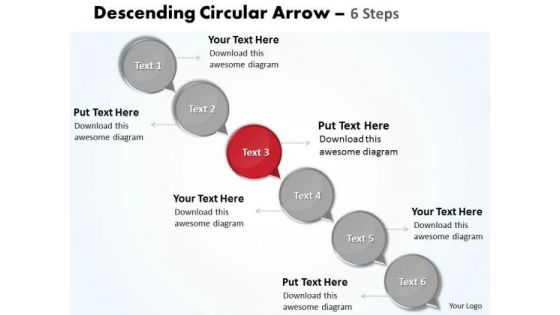
Ppt Text Circles Moving Down Arrow 6 PowerPoint Slide Numbers Business Templates
PPT text circles moving down arrow 6 powerpoint slide numbers Business Templates-This Continuous Series Diagram helps expound on the logic of your detailed thought process to take your company forward. It imitates alternation, chain, circle, circuit, course, loop, period, periodicity, revolution, rhythm, ring, rotation, round, run, sequel, sequence, series, succession etc. You can show various processes with these linear designed arrow pieces. Add charm and personality to your presentations with our colorful and attractive Diagram.-PPT text circles moving down arrow 6 powerpoint slide numbers Business Templates-Add, Aqua, Arrows, Badges, Bar, Blend, Blue, Bright, Bubbles, Buttons, Caution, Circle, Drop, Elements, Glossy, Glowing, Graphic, Heart, Help, Icons, Idea, Illustration, Navigation, Oblong, Plus, Round, Service, Shadow, Shiny, Sign, Speech, Squares
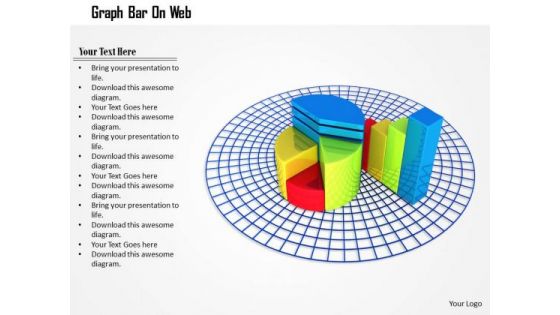
Stock Photo Pie Chart And Bar Graph On Web PowerPoint Slide
This image is designed with pie chart and bar graph on web. Use this diagram to explain your strategy to co-ordinate activities. Deliver amazing presentations to mesmerize your audience.

Stock Photo Bar Graph With Cubes For Financial Data PowerPoint Slide
Graphic of bar graph and cubes are used to decorate this image template. This PPT contains the concept of financial data analysis. Use this PPT for finance and business related presentations.
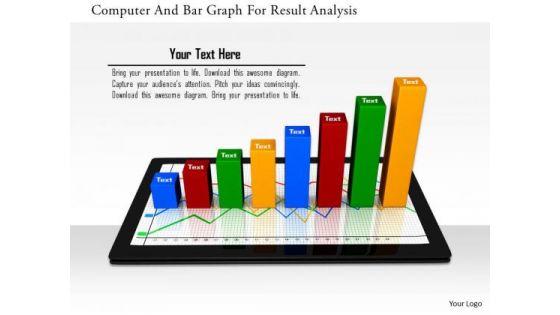
Stock Photo Computer And Bar Graph For Result Analysis PowerPoint Slide
This Power point template has been crafted with graphic of computer and bar graph. This PPT contains the concept of technology and result analysis. Use this PPT for your business and technology related presentations.

Balance01 Business PowerPoint Themes And PowerPoint Slides 0411
Microsoft PowerPoint Theme and Slide with the job and family out of balance in a busy and stressful world using brass balance scale with yellow letters to spell out the concept

Positive And Negative Law PowerPoint Themes And PowerPoint Slides 0911
Microsoft PowerPoint Theme and Slide with the words positives and negatives on opposite sides on a gold metal scale symbolizing the comparision of differences between two choices or options
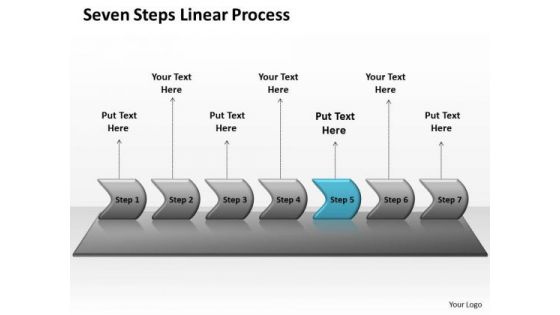
Sales Ppt Background Seven PowerPoint Slide Numbers Linear Process 6 Image
We present our sales PPT Background seven PowerPoint slide numbers linear Process 6 Image. Use our Arrows PowerPoint Templates because, now spread the fruits of your efforts and elaborate your ideas on the prevention, diagnosis, control and cure of prevalent diseases. Use our Business PowerPoint Templates because, develop your marketing strategy and communicate your enthusiasm and motivation to raise the bar. Use our Marketing PowerPoint Templates because, our template will help pinpoint their viability. Use our Technology PowerPoint Templates because, now spread the fruits of your efforts and elaborate your ideas on the prevention, diagnosis, control and cure of prevalent diseases. Use our Process and flows PowerPoint Templates because, designed to help bullet-point your views and thoughts. Use these PowerPoint slides for presentations relating to Algorithm, arrow, arrow chart, business, chart, color, connection, development, diagram, direction, flow chart, flow diagram, flowchart, kind of diagram, linear, linear diagram, management, motion, organization, plan, process, process arrows, process chart, process diagram, process flow, program, sign, solution, strategy, symbol, technology. The prominent colors used in the PowerPoint template are Blue, Gray, and White

Business Logic Diagram Of 8 Stages Mixed Strategy And Policy Ppt PowerPoint Slide
We present our business logic diagram of 8 stages mixed strategy and policy ppt PowerPoint Slide.Download our Layers PowerPoint Templates because Our PowerPoint Templates and Slides will weave a web of your great ideas. They are gauranteed to attract even the most critical of your colleagues. Download our Competition PowerPoint Templates because Our PowerPoint Templates and Slides will let you Illuminate the road ahead to Pinpoint the important landmarks along the way. Use our Business PowerPoint Templates because Our PowerPoint Templates and Slides are specially created by a professional team with vast experience. They diligently strive to come up with the right vehicle for your brilliant Ideas. Use our Circle Charts PowerPoint Templates because It will Raise the bar of your Thoughts. They are programmed to take you to the next level. Use our Shapes PowerPoint Templates because You should Bet on your luck with our PowerPoint Templates and Slides. Be assured that you will hit the jackpot.Use these PowerPoint slides for presentations relating to arrows, business, process, diagram, succession, chart, sequence, feeds, iteration, concept, vector, rotation, presentation, circle, dynamic, report, graph, cycle, progression, iterative, endless, direction, dependency, production, phase, method, company, progress, continuity, path, continuous. The prominent colors used in the PowerPoint template are Gray, White, Green.

Business Power Point Plan 7 Stages Ppt PowerPoint Templates Backgrounds For Slide
We present our business power point plan 7 stages ppt PowerPoint templates backgrounds for slide.Use our Advertising PowerPoint Templates because You are well armed with penetrative ideas. Our PowerPoint Templates and Slides will provide the gunpowder you need. Download our Construction PowerPoint Templates because you should once Tap the ingenuity of our PowerPoint Templates and Slides. They are programmed to succeed. Use our Layers PowerPoint Templates because you can Add colour to your speech with our PowerPoint Templates and Slides. Your presentation will leave your audience speechless. Use our Business PowerPoint Templates because It can Conjure up grand ideas with our magical PowerPoint Templates and Slides. Leave everyone awestruck by the end of your presentation. Present our Shapes PowerPoint Templates because It will Raise the bar of your Thoughts. They are programmed to take you to the next level.Use these PowerPoint slides for presentations relating to Pyramid, chart, 3d, layers, layered, vector, icon, organized, leadership, ranking, base, diagram, colored, colors, design, ranked, priority, useful, tip, triangle, blank, hierarchy, glossy, importance, top, illustration, clipart, reflection, hierarchical, empty, organization, editable. The prominent colors used in the PowerPoint template are Blue, Black, Gray.
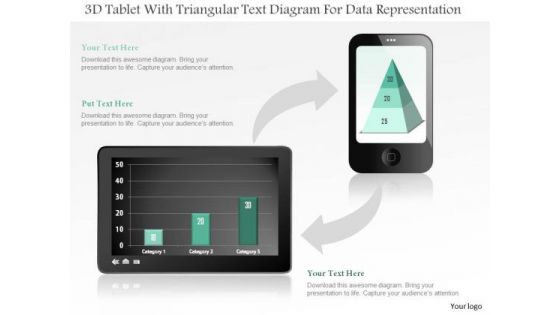
Business Diagram 3d Tablet With Triangular Text Diagram For Data Representation PowerPoint Slide
This business diagram displays bar graph on tablet and pyramid chart on mobile phone. Use this diagram, to make reports for interactive business presentations. Create professional presentations using this diagram.
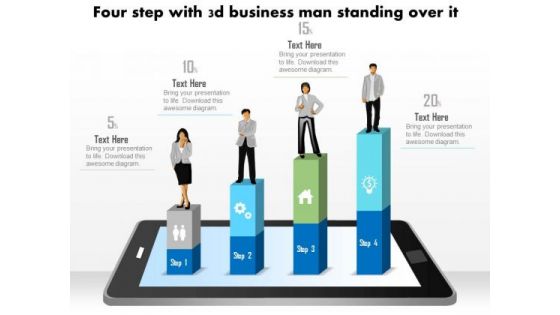
Business Diagram Four Steps With 3d Business Person Standing Over It PowerPoint Slide
This business diagram displays bar graph with business person standing on it. This Power Point template has been designed to display personal growth. You may use this diagram to impart professional appearance to your presentations.

Analyzing And Implementing Effective CMS Importance Of Ecommerce Order Management System Sample PDF
This slide represents the importance of order management system in helping business scale by automation of repetitive work, syncing consumer data across platforms and give clear details related to current inventory levels. It includes benefits of order management system such as fast delivery, less mistakes etc. This modern and well arranged Analyzing And Implementing Effective CMS Importance Of Ecommerce Order Management System Sample PDF provides lots of creative possibilities. It is very simple to customize and edit with the Powerpoint Software. Just drag and drop your pictures into the shapes. All facets of this template can be edited with Powerpoint no extra software is necessary. Add your own material, put your images in the places assigned for them, adjust the colors, and then you can show your slides to the world, with an animated slide included.

Optimizing Online Stores Importance Of Ecommerce Order Management System Portrait PDF
This slide represents the importance of order management system in helping business scale by automation of repetitive work, Syncing consumer data across platforms and give clear details related to current inventory levels. It includes benefits of order management system such as fast delivery, less mistakes etc. This modern and well-arranged Optimizing Online Stores Importance Of Ecommerce Order Management System Portrait PDF provides lots of creative possibilities. It is very simple to customize and edit with the Powerpoint Software. Just drag and drop your pictures into the shapes. All facets of this template can be edited with Powerpoint, no extra software is necessary. Add your own material, put your images in the places assigned for them, adjust the colors, and then you can show your slides to the world, with an animated slide included.
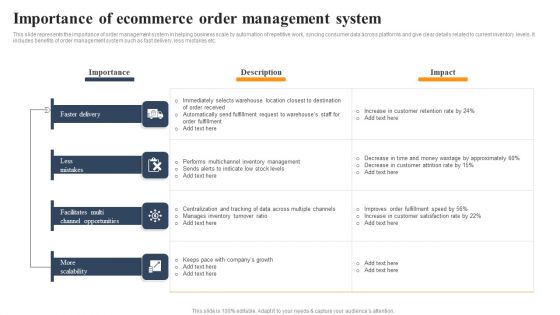
Implementing An Effective Ecommerce Management Framework Importance Of Ecommerce Order Management System Mockup PDF
This slide represents the importance of order management system in helping business scale by automation of repetitive work, syncing consumer data across platforms and give clear details related to current inventory levels. This modern and well-arranged Implementing An Effective Ecommerce Management Framework Importance Of Ecommerce Order Management System Mockup PDF provides lots of creative possibilities. It is very simple to customize and edit with the Powerpoint Software. Just drag and drop your pictures into the shapes. All facets of this template can be edited with Powerpoint no extra software is necessary. Add your own material, put your images in the places assigned for them, adjust the colors, and then you can show your slides to the world, with an animated slide included.
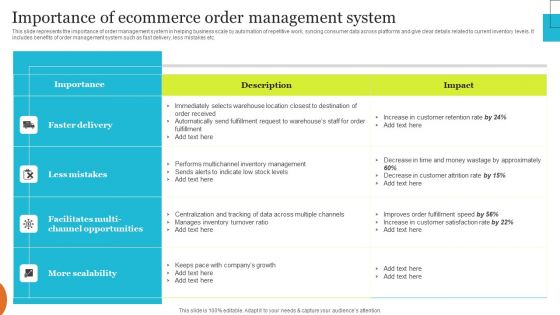
Implementing Effective Ecommerce Managemnet Platform Importance Of Ecommerce Order Management Guidelines PDF
This slide represents the importance of order management system in helping business scale by automation of repetitive work, syncing consumer data across platforms and give clear details related to current inventory levels. It includes benefits of order management system such as fast delivery, less mistakes etc. This modern and well arranged Implementing Effective Ecommerce Managemnet Platform Importance Of Ecommerce Order Management Guidelines PDF provides lots of creative possibilities. It is very simple to customize and edit with the Powerpoint Software. Just drag and drop your pictures into the shapes. All facets of this template can be edited with Powerpoint no extra software is necessary. Add your own material, put your images in the places assigned for them, adjust the colors, and then you can show your slides to the world, with an animated slide included.

 Home
Home