Sales Trend
Retail Outlet Experience Optimization Playbook Essential Retail Store Activities Tracking Dashboard Demonstration PDF
This slide provides details regarding the dashboard for tracking retail store activities in terms of sales, conversion rate, traffic, average transaction value, recommendations, etc. Deliver an awe inspiring pitch with this creative Retail Outlet Experience Optimization Playbook Essential Retail Store Activities Tracking Dashboard Demonstration PDF bundle. Topics like Low Conversion, Customers, Sales can be discussed with this completely editable template. It is available for immediate download depending on the needs and requirements of the user.
Retailer Instructions Playbook Essential Retail Store Activities Tracking Dashboard Pictures PDF
This slide provides details regarding the dashboard for tracking retail store activities in terms of sales, conversion rate, traffic, average transaction value, recommendations, etc. Deliver an awe inspiring pitch with this creative Retailer Instructions Playbook Essential Retail Store Activities Tracking Dashboard Pictures PDF bundle. Topics like Customers, Volume Sales can be discussed with this completely editable template. It is available for immediate download depending on the needs and requirements of the user.

Strategic Account Management By Selling And Advertisement Overall Performance Improvement Demonstration PDF
The successful implementation of effective account management results in improved overall performance in terms of increased revenue generation, improved lead generation and enhanced sales and marketing alignment. Deliver and pitch your topic in the best possible manner with this strategic account management by selling and advertisement overall performance improvement demonstration pdf. Use them to share invaluable insights on sales, marketing, team, revenue and impress your audience. This template can be altered and modified as per your expectations. So, grab it now.

Business Opportunity Assessment Dashboard With Various Ppt PowerPoint Presentation Professional Graphics Download PDF
Pitch your topic with ease and precision using this business opportunity assessment dashboard with various ppt powerpoint presentation professional graphics download pdf. This layout presents information on opportunity size, individual opportunity count by sales stages, opportunity count by region, opportunity count by sales stage. It is also available for immediate download and adjustment. So, changes can be made in the color, design, graphics or any other component to create a unique layout.

Business Diagram People Spinning Plates On Sticks Presentation Template
This power point template has been crafted with graphic of 3d business men in line. This PPT contains the concept of strategy and target selection. Use this PPT for your business and sales related presentations.

Supply Management Development Powerpoint Shapes
This is a supply management development powerpoint shapes. This is a five stage process. The stages in this process are supply and demand, strategy structure, sales planning and forecasting, process improvement, customer experience.
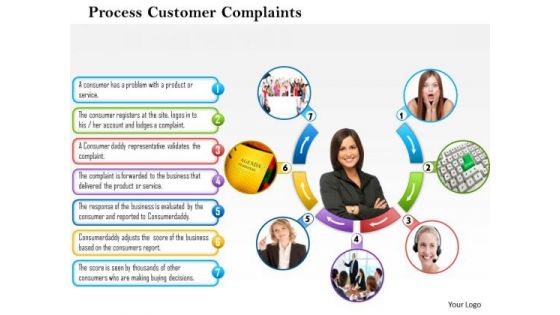
Business Framework Process Customer Complaints PowerPoint Presentation
This Power Point template diagram slide has been designed with graphic of customer care center. This PPT slide contains the concept of process of resolving customer complaints. Use this PPT slide for your marketing and sales service related topics.
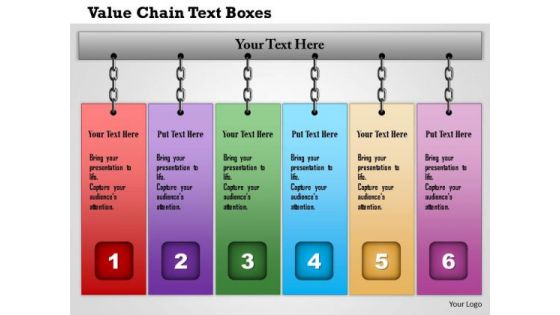
Business Framework Value Chain Text Boxes PowerPoint Presentation
This business diagram displays framework for value chain. This slide contains graphic of colorful tags in linear order. This editable diagram may be used for business and sales related presentations.
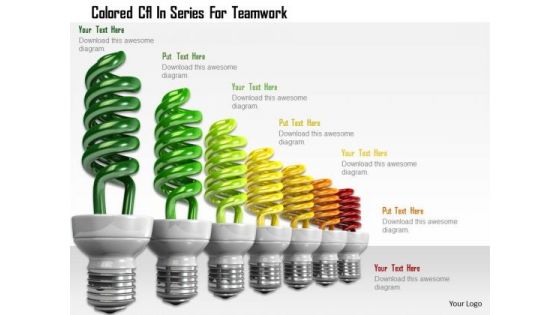
Stock Photo Colored Cfl In Series For Teamwork PowerPoint Slide
This power point image template has been designed with graphic of colored CFL in series. This image template contains the concept of teamwork. Use this PPT for your business and sales related presentations.
Business Diagram Seven Icons With Circle Diagram Presentation Template
Seven staged circle diagram has been used to craft this power point template diagram. This PPT contains the concept of process flow. Use this PPT and build an innovative presentation for business and sales process related topics.
Business Diagram Six Icons With Circle Diagram Presentation Template
Six staged circle diagram has been used to craft this power point template diagram. This PPT contains the concept of process flow. Use this PPT and build an excellent presentation for business and sales process related topics.

Demand Chain Management Ppt Powerpoint Guide
This is a demand chain management ppt powerpoint guide. This is a three stage process. The stages in this process are supply chain management, crm management, sales force automation.
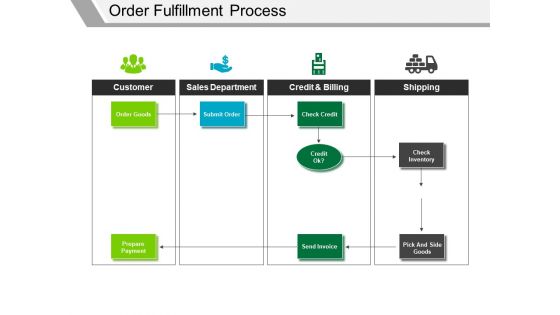
Order Fulfillment Process Ppt PowerPoint Presentation Styles Graphics Tutorials
This is a order fulfillment process ppt powerpoint presentation styles graphics tutorials. This is a four stage process. The stages in this process are customer, sales department, credit and billing, shipping, check inventory.
Order Fulfillment Process Ppt PowerPoint Presentation Icon Demonstration
This is a order fulfillment process ppt powerpoint presentation icon demonstration. This is a four stage process. The stages in this process are customer, sales department, credit and billing, shipping, submit order.
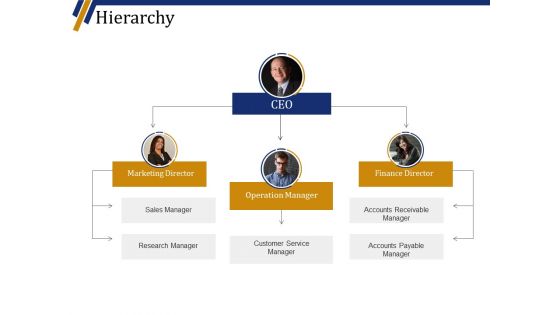
Hierarchy Ppt PowerPoint Presentation Layouts Visuals
This is a hierarchy ppt powerpoint presentation layouts visuals. This is a three stage process. The stages in this process are marketing director, operation manager, finance director, sales manager, research manager.
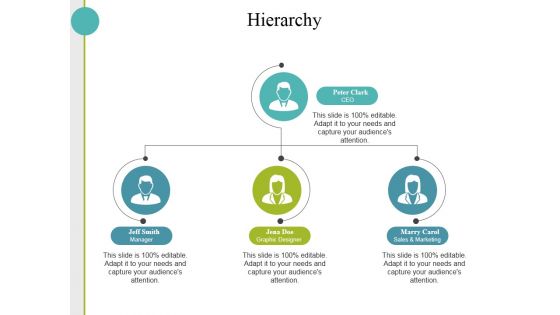
Hierarchy Ppt PowerPoint Presentation Professional Display
This is a hierarchy ppt powerpoint presentation professional display. This is a three stage process. The stages in this process are ceo, manager, graphic designer, sales and marketing, hierarchy.
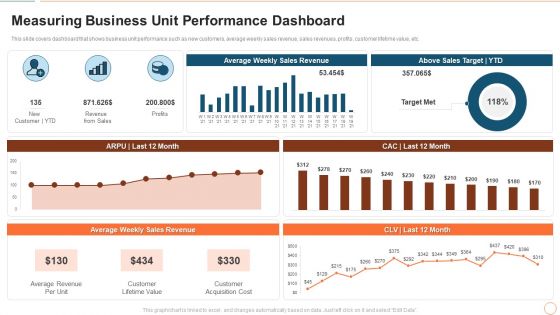
Illustrating Product Leadership Plan Incorporating Innovative Techniques Measuring Business Unit Professional PDF
This slide covers dashboard that shows business unit performance such as new customers, average weekly sales revenue, sales revenues, profits, customer lifetime value, etc. Deliver an awe inspiring pitch with this creative illustrating product leadership plan incorporating innovative techniques measuring business unit professional pdf bundle. Topics like average revenue per unit, customer lifetime value, customer acquisition cost can be discussed with this completely editable template. It is available for immediate download depending on the needs and requirements of the user.
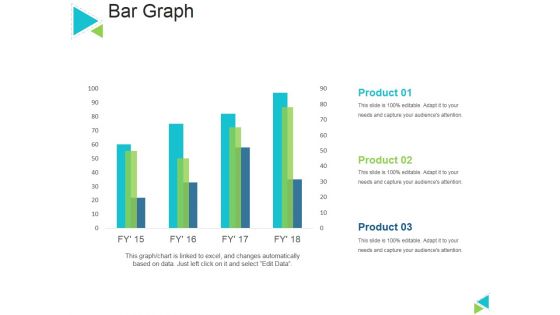
Bar Graph Ppt PowerPoint Presentation Outline Layout
This is a bar graph ppt powerpoint presentation outline layout. This is a four stage process. The stages in this process are sales in percentage, product, bar graph, business, marketing.

Content Ppt PowerPoint Presentation Outline Guide
This is a content ppt powerpoint presentation outline guide. This is a five stage process. The stages in this process are business overview, sales performance, project updates, competitive analysis, future perspective.
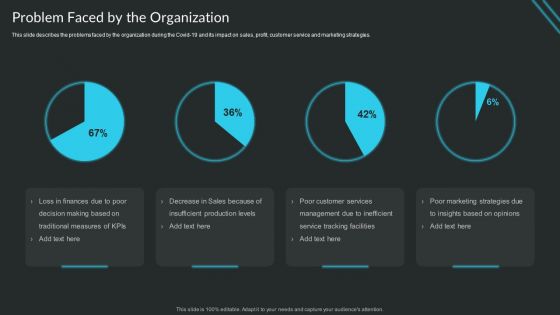
Proactive Consumer Solution And How To Perform It Problem Faced By The Organization Formats PDF
This slide describes the problems faced by the organization during the Covid-19 and its impact on sales, profit, customer service and marketing strategies.Deliver an awe inspiring pitch with this creative Proactive Consumer Solution And How To Perform It Problem Faced By The Organization Formats PDF bundle. Topics like Loss In Finances, Traditional Measures, Decrease Sales can be discussed with this completely editable template. It is available for immediate download depending on the needs and requirements of the user.
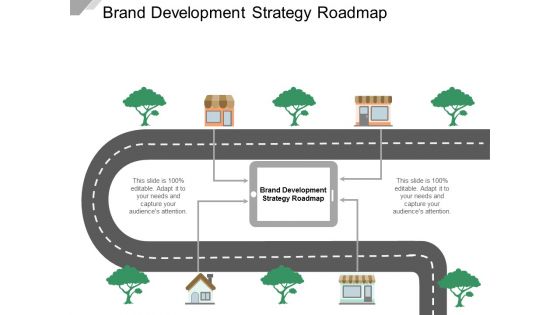
Brand Development Strategy Roadmap Ppt Powerpoint Presentation Styles Background Designs
This is a brand development strategy roadmap ppt powerpoint presentation styles background designs. This is a two stage process. The stages in this process are trade marketing strategy, trade promotion strategy, trade sales plan.
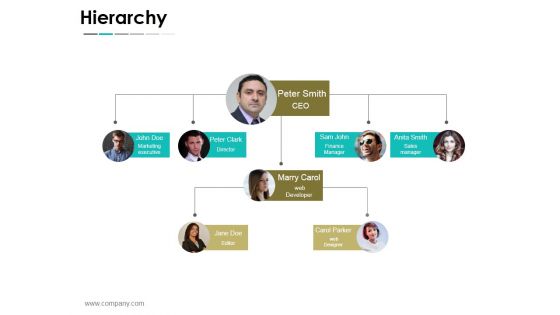
Hierarchy Ppt PowerPoint Presentation Summary Background
This is a hierarchy ppt powerpoint presentation summary background. This is a four stage process. The stages in this process are marketing executive, director, finance manager, sales manager, web developer, editor.
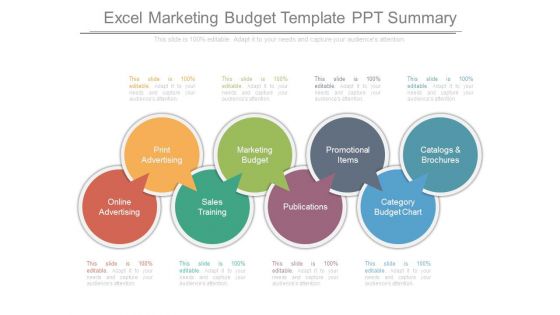
Excel Marketing Budget Template Ppt Summary
This is a excel marketing budget template ppt summary. This is a eight stage process. The stages in this process are print advertising, online advertising, marketing budget, sales training, promotional items, publications, catalogs and brochures, category budget chart.
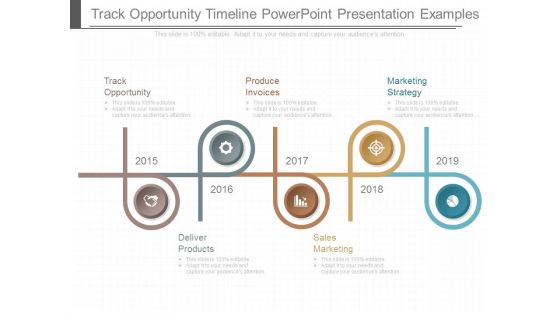
Track Opportunity Timeline Powerpoint Presentation Examples
This is a track opportunity timeline powerpoint presentation examples. This is a five stage process. The stages in this process are track opportunity, produce invoices, marketing strategy, deliver products, sales marketing.

Market Assessment Ppt PowerPoint Presentation Files
This is a market assessment ppt powerpoint presentation files. This is a five stage process. The stages in this process are target market, forecasting of sales volume, indication of product positioning, competitor reaction, specification of new product development.
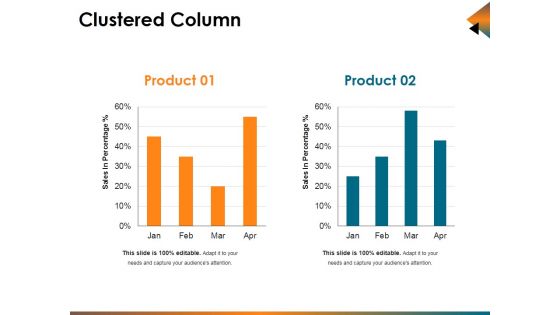
Clustered Column Ppt PowerPoint Presentation Infographic Template Background Designs
This is a clustered column ppt powerpoint presentation infographic template background designs. This is a two stage process. The stages in this process are sales in percentage, bar, business, marketing, planning.

Scatter Line Ppt PowerPoint Presentation Visual Aids Diagrams
This is a scatter line ppt powerpoint presentation visual aids diagrams. This is a one stage process. The stages in this process are dollar in millions, sales in percentage, growth, business, marketing.

Pipeline Quality Template 2 Ppt PowerPoint Presentation Inspiration Show
This is a pipeline quality template 2 ppt powerpoint presentation inspiration show. This is a one stage process. The stages in this process are sales stage, opportunity age, pipeline, quality, line chart.

Content Ppt PowerPoint Presentation Show Examples
This is a content ppt powerpoint presentation show examples. This is a five stage process. The stages in this process are business overview, sales performance, project updates, competitive analysis, future perspective.

Product Market Share Analysis Powerpoint Presentation Templates
This is a product market share analysis powerpoint presentation templates. This is a four stage process. The stages in this process are increased deal flow, increased sales performance, increased deal visibility, higher deal completion rate, increased market share.
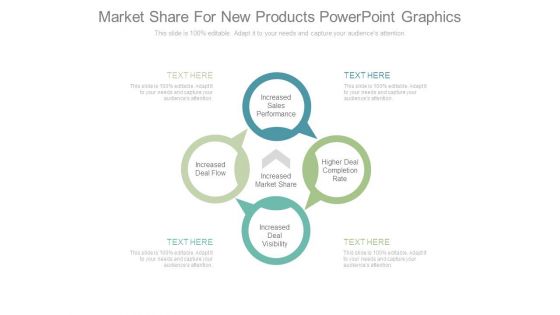
Market Share For New Products Powerpoint Graphics
This is a market share for new products powerpoint graphics. This is a four stage process. The stages in this process are increased sales performance, higher deal completion rate, increased deal visibility, increased deal flow, increased market share.

Market Share Analysis Cycle Ppt Slide Templates
This is a market share analysis cycle ppt slide templates. This is a four stage process. The stages in this process are increased sales performance, higher deal completion rate, increased deal visibility, increased deal flow, increased market share.
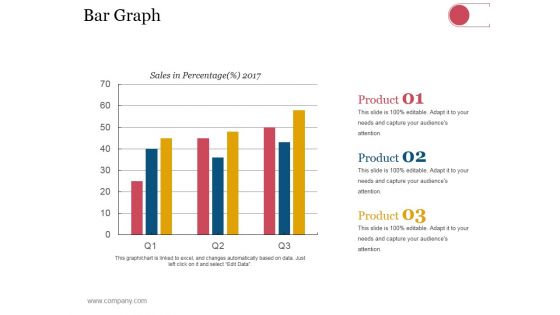
Bar Graph Ppt PowerPoint Presentation Visual Aids Model
This is a bar graph ppt powerpoint presentation visual aids model. This is a three stage process. The stages in this process are business, strategy, analysis, planning, sales in percentage.
Financial Projection Graph Template 1 Ppt PowerPoint Presentation Icon Summary
This is a financial projection graph template 1 ppt powerpoint presentation icon summary. This is a three stage process. The stages in this process are annual sales forecast, years, business, marketing, management.
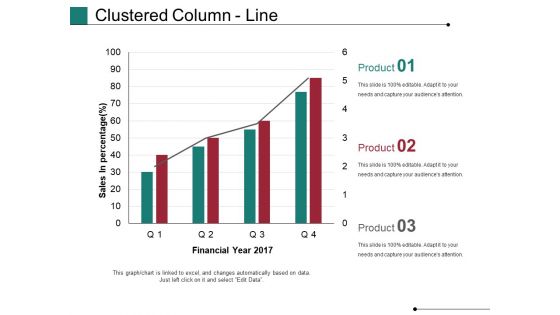
Clustered Column Line Ppt PowerPoint Presentation Model Rules
This is a clustered column line ppt powerpoint presentation model rules. This is a four stage process. The stages in this process are financial year, sales in percentage, business, marketing, growth, graph.
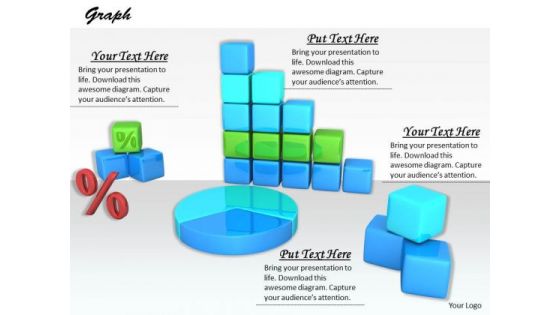
Stock Photo Design For Graphical Representations Of Data PowerPoint Slide
The above image contains a graphic of charts and graphs. Use this professional image in business or sales related presentations. It helps you to explain your plans in all earnest to your colleagues and raise the bar for all.
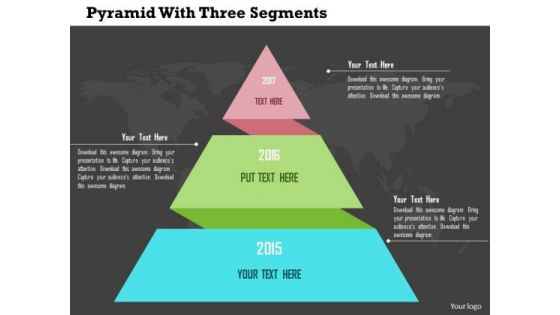
Business Diagram Pyramid With Three Segments Presentation Template
Sales process can be explained with this pyramid diagram. This diagram contains the graphic of pyramid chart with three segments. This diagram provides an effective way of displaying information.
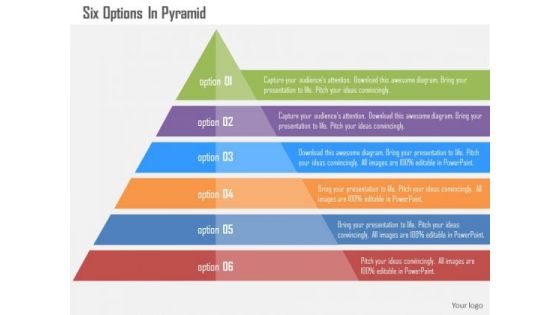
Business Diagram Six Options In Pyramid Presentation Template
Sales process can be explained with this pyramid diagram. This diagram contains the graphic of pyramid chart with six options. This diagram provides an effective way of displaying information.
Five Staged Pyramid With Icons Powerpoint Template
Steps of sales process can be displayed with this business diagram slide. This PowerPoint template contains pyramid chart with business icons. Download this diagram slide to make impressive presentations.

Market Assessment Ppt PowerPoint Presentation Model
This is a market assessment ppt powerpoint presentation model. This is a five stage process. The stages in this process are forecasting of sales volume, specification of new product development, target market, indication of product positioning.

Bar Graph Ppt PowerPoint Presentation Introduction
This is a bar graph ppt powerpoint presentation introduction. This is a eleven stage process. The stages in this process are management, marketing, business, fy, graph, sales in percentage.
Clustered Column Ppt PowerPoint Presentation Icon Design Inspiration
This is a clustered column ppt powerpoint presentation icon design inspiration. This is a two stage process. The stages in this process are product, financial year, sales in percentage, clustered column.
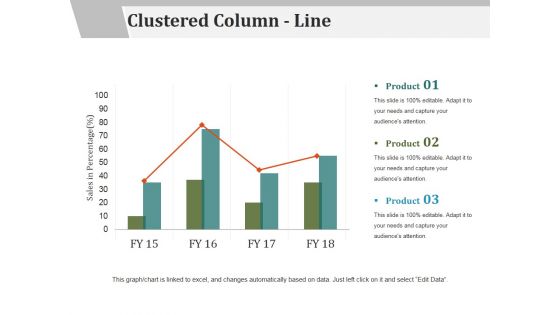
Clustered Column Line Ppt PowerPoint Presentation File Examples
This is a clustered column line ppt powerpoint presentation file examples. This is a three stage process. The stages in this process are sales in percentage, product, business, marketing, success.

Clustered Column Line Ppt PowerPoint Presentation Model Images
This is a clustered column line ppt powerpoint presentation model images. This is a four stage process. The stages in this process are sales in percentage, product, business, marketing, bar graph.
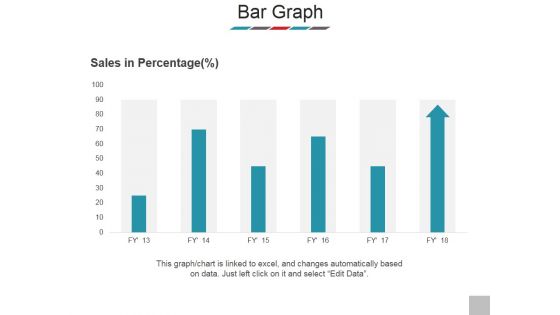
Bar Graph Ppt PowerPoint Presentation Model Clipart
This is a bar graph ppt powerpoint presentation model clipart. This is a six stage process. The stages in this process are sales in percentage, product, bar graph, business, marketing.
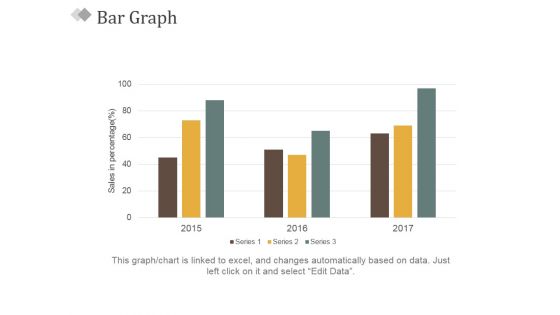
Bar Graph Ppt PowerPoint Presentation Slides Visual Aids
This is a bar graph ppt powerpoint presentation slides visual aids. This is a three stage process. The stages in this process are sales in percentage, bar graph, business, marketing, success.
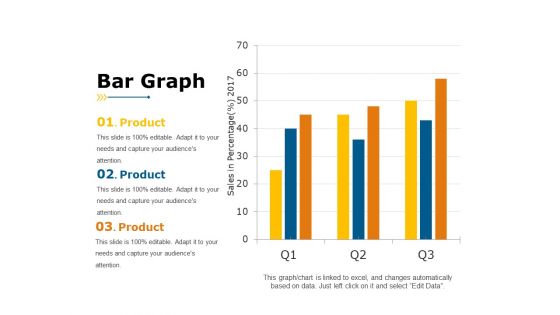
Bar Graph Ppt PowerPoint Presentation Portfolio Example
This is a bar graph ppt powerpoint presentation portfolio example. This is a three stage process. The stages in this process are sales in percentage, year, business, product, business, graph.
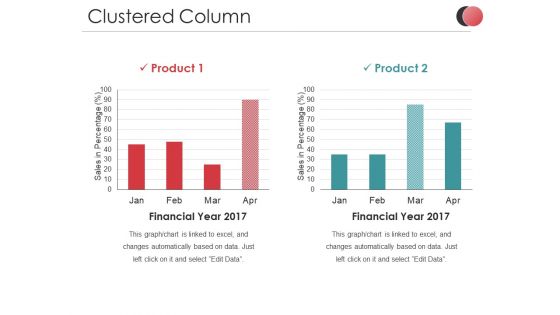
Clustered Column Ppt PowerPoint Presentation Slides Ideas
This is a clustered column ppt powerpoint presentation slides ideas. This is a two stage process. The stages in this process are sales in percentage, business, marketing, finance, graph.

Stacked Column Ppt PowerPoint Presentation Infographics Samples
This is a stacked column ppt powerpoint presentation infographics samples. This is a two stage process. The stages in this process are product, sales in percentage, business, marketing, graph.

Clustered Column Ppt PowerPoint Presentation Ideas Graphic Tips
This is a clustered column ppt powerpoint presentation ideas graphic tips. This is a two stage process. The stages in this process are financial year, sales in percentage, product, graph, business.

Stacked Column Ppt PowerPoint Presentation Professional Vector
This is a stacked column ppt powerpoint presentation professional vector. This is a two stage process. The stages in this process are product, sales in percentage, business, marketing, graph.

Clustered Column Ppt PowerPoint Presentation Portfolio Smartart
This is a clustered column ppt powerpoint presentation portfolio smartart. This is a two stage process. The stages in this process are financial year, product, sales in percentage, finance, business, graph.

Clustered Column Ppt PowerPoint Presentation Pictures Mockup
This is a clustered column ppt powerpoint presentation pictures mockup. This is a two stage process. The stages in this process are product, sales in percentage, financial year, graph, business.
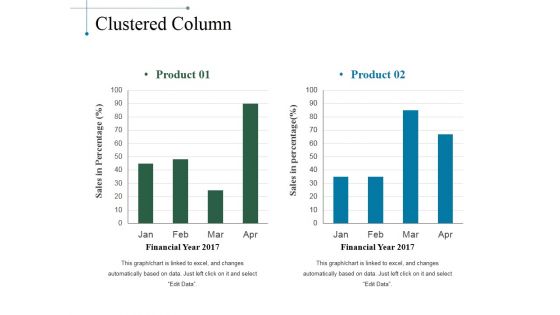
Clustered Column Ppt PowerPoint Presentation Slides Smartart
This is a clustered column ppt powerpoint presentation slides smartart. This is a two stage process. The stages in this process are product, sales in percentage, financial year, bar graph.

Clustered Column Ppt PowerPoint Presentation File Graphics
This is a clustered column ppt powerpoint presentation file graphics. This is a two stage process. The stages in this process are product, financial year, sales in percentage, graph, growth.
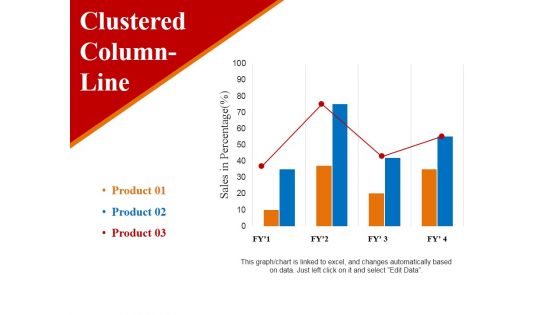
clustered column line ppt powerpoint presentation ideas example
This is a clustered column line ppt powerpoint presentation ideas example. This is a three stage process. The stages in this process are sales in percentage, business, marketing, finance, graph.
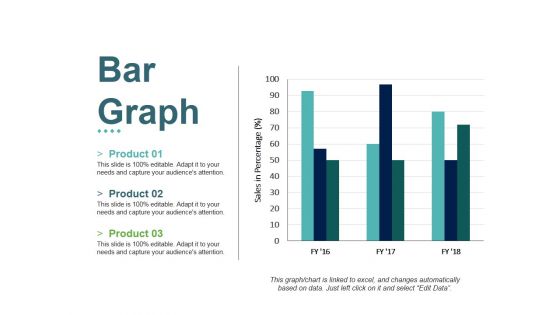
Bar Graph Ppt PowerPoint Presentation File Slides
This is a bar graph ppt powerpoint presentation file slides. This is a three stage process. The stages in this process are product, sales in percentage, bar graph, growth, success.

Clustered Column Ppt PowerPoint Presentation Show Graphics
This is a clustered column ppt powerpoint presentation show graphics. This is a two stage process. The stages in this process are financial year, sales in percentage, business, marketing, graph.
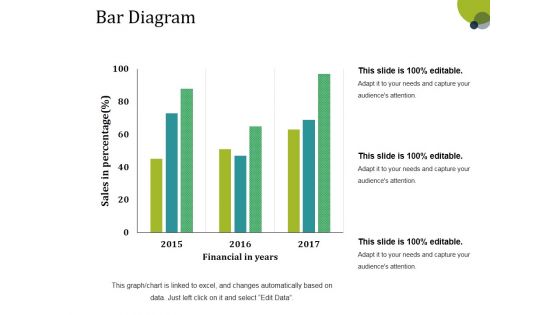
Bar Diagram Ppt PowerPoint Presentation Gallery Structure
This is a bar diagram ppt powerpoint presentation gallery structure. This is a three stage process. The stages in this process are financial in years, sales in percentage, bar graph, growth, success.

Bar Diagram Ppt PowerPoint Presentation Pictures Background Image
This is a bar diagram ppt powerpoint presentation pictures background image. This is a three stage process. The stages in this process are financial in years, sales in percentage, bar graph, growth, success.

 Home
Home