Sales Trend
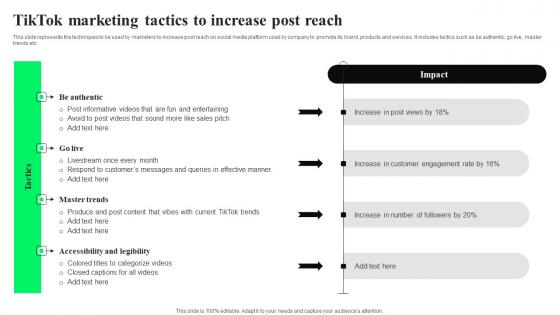
TikTok Marketing Tactics To Increase Post Reach TikTok Advertising Strategies To Provide Effective Template Pdf
This slide represents the techniques to be used by marketers to increase post reach on social media platform used by company to promote its brand, products and services. It includes tactics such as be authentic, go live, master trends etc. Make sure to capture your audiences attention in your business displays with our gratis customizable TikTok Marketing Tactics To Increase Post Reach TikTok Advertising Strategies To Provide Effective Template Pdf. These are great for business strategies, office conferences, capital raising or task suggestions. If you desire to acquire more customers for your tech business and ensure they stay satisfied, create your own sales presentation with these plain slides.

Key Financial Assumptions Real Estate Agent Business Plan Go To Market Strategy Clipart Pdf
This slide depicts the important financial assumptions that are to be made while setting real estate agency business in terms of income, expense, and balance sheet. The computations are based on market trends and conditions prevailing in the real estate industry. Make sure to capture your audiences attention in your business displays with our gratis customizable Key Financial Assumptions Real Estate Agent Business Plan Go To Market Strategy Clipart Pdf. These are great for business strategies, office conferences, capital raising or task suggestions. If you desire to acquire more customers for your tech business and ensure they stay satisfied, create your own sales presentation with these plain slides.
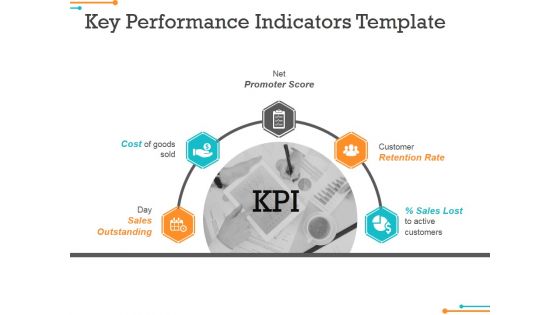
Key Performance Indicators Template 2 Ppt Powerpoint Presentation Model Background
This is a key performance indicators template 2 ppt powerpoint presentation model background. This is a five stage process. The stages in this process are day sales outstanding, cost of goods sold, net promoter score.

Various Distribution Channels For SaaS Company Indirect IT Industry Market Research Ideas Pdf
The following slide showcases the indirect distribution channels which involves external vendors in sales process. It provides information about in-app purchase, white label resellers, and resellers. The Various Distribution Channels For SaaS Company Indirect IT Industry Market Research Ideas Pdf is a compilation of the most recent design trends as a series of slides. It is suitable for any subject or industry presentation, containing attractive visuals and photo spots for businesses to clearly express their messages. This template contains a variety of slides for the user to input data, such as structures to contrast two elements, bullet points, and slides for written information. Slidegeeks is prepared to create an impression.
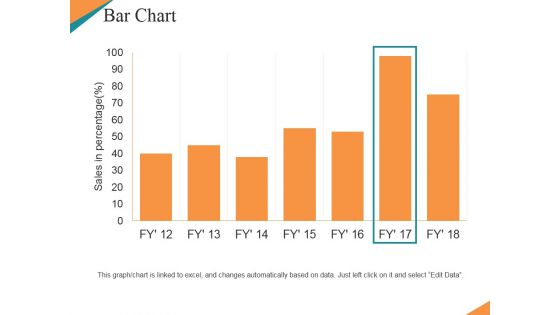
Bar Chart Ppt PowerPoint Presentation Ideas Graphic Tips
This is a bar chart ppt powerpoint presentation ideas graphic tips. This is a seven stage process. The stages in this process are sales in percentage, bar chart, growth, business, marketing.

Column Chart Ppt PowerPoint Presentation Gallery Design Inspiration
This is a column chart ppt powerpoint presentation gallery design inspiration. This is a two stage process. The stages in this process are column chart, product, sales in percentage, financial years.

Line Chart Template 2 Ppt PowerPoint Presentation Model Background Image
This is a line chart template 2 ppt powerpoint presentation model background image. This is a two stage process. The stages in this process are sales in percentage, financial years, business, marketing, strategy, graph.

Line Chart Ppt PowerPoint Presentation Infographic Template Slides
This is a line chart ppt powerpoint presentation infographic template slides. This is a two stage process. The stages in this process are sales in percentage, financial years, business, marketing, graph.
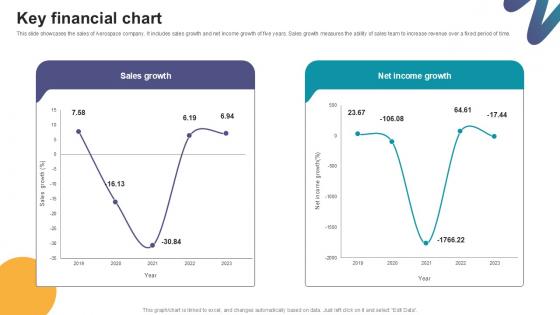
Key Financial Chart Digital Marketings Strategies PPT PowerPoint CP SS V
This slide showcases the sales of Aerospace company. It includes sales growth and net income growth of five years. Sales growth measures the ability of sales team to increase revenue over a fixed period of time. Coming up with a presentation necessitates that the majority of the effort goes into the content and the message you intend to convey. The visuals of a PowerPoint presentation can only be effective if it supplements and supports the story that is being told. Keeping this in mind our experts created Key Financial Chart Digital Marketings Strategies PPT PowerPoint CP SS V to reduce the time that goes into designing the presentation. This way, you can concentrate on the message while our designers take care of providing you with the right template for the situation.
Bar Chart Ppt PowerPoint Presentation Icon Design Templates
This is a bar chart ppt powerpoint presentation icon design templates. This is a nine stage process. The stages in this process are sales in percentage, bar graph, business, marketing, growth.

Scatter Chart Template 3 Ppt PowerPoint Presentation Styles Demonstration
This is a scatter chart template 3 ppt powerpoint presentation styles demonstration. This is a one stage process. The stages in this process are sales in percentage, finance, business, marketing, growth.
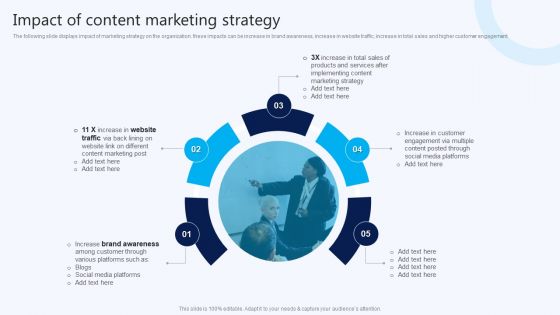
Impact Of Content Marketing Strategy B2B Electronic Commerce Startup Clipart PDF
The following slide displays impact of marketing strategy on the organization. these impacts can be increase in brand awareness, increase in website traffic, increase in total sales and higher customer engagement. The Impact Of Content Marketing Strategy B2B Electronic Commerce Startup Clipart PDF is a compilation of the most recent design trends as a series of slides. It is suitable for any subject or industry presentation, containing attractive visuals and photo spots for businesses to clearly express their messages. This template contains a variety of slides for the user to input data, such as structures to contrast two elements, bullet points, and slides for written information. Slidegeeks is prepared to create an impression.

Line Chart Ppt PowerPoint Presentation Summary Clipart Images
This is a line chart ppt powerpoint presentation summary clipart images. This is a two stage process. The stages in this process are business, marketing, sales in percentage, financial years, strategy.
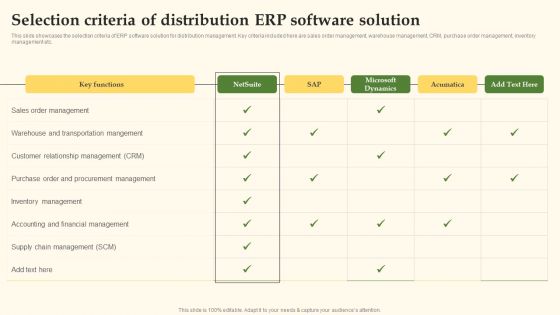
Selection Criteria Of Distribution ERP Software Solution Demonstration PDF
This slide showcases the selection criteria of ERP software solution for distribution management. Key criteria included here are sales order management, warehouse management, CRM, purchase order management, inventory management etc. The Selection Criteria Of Distribution ERP Software Solution Demonstration PDF is a compilation of the most recent design trends as a series of slides. It is suitable for any subject or industry presentation, containing attractive visuals and photo spots for businesses to clearly express their messages. This template contains a variety of slides for the user to input data, such as structures to contrast two elements, bullet points, and slides for written information. Slidegeeks is prepared to create an impression.

Line Chart Ppt PowerPoint Presentation Model Design Templates
This is a line chart ppt powerpoint presentation model design templates. This is a two stage process. The stages in this process are sales in percentage, financial years, product.
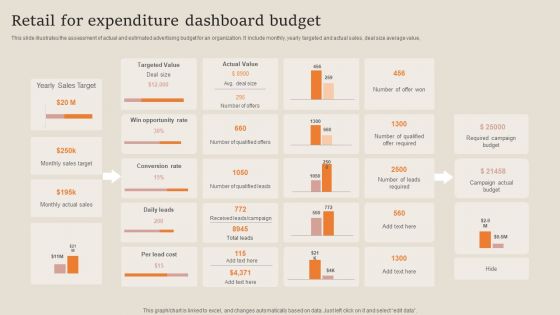
Retail For Expenditure Dashboard Budget Designs PDF
This slide illustrates the assessment of actual and estimated advertising budget for an organization. It include monthly, yearly targeted and actual sales, deal size average value, Showcasing this set of slides titled Retail For Expenditure Dashboard Budget Designs PDF. The topics addressed in these templates are Sales Target, Opportunity Rate, Required Campaign Budget. All the content presented in this PPT design is completely editable. Download it and make adjustments in color, background, font etc. as per your unique business setting.
Content Marketing Performance Template 1 Ppt PowerPoint Presentation Icon Skills
This is a content marketing performance template 1 ppt powerpoint presentation icon skills. This is a eight stage process. The stages in this process are conversion rate, website traffic, number of leads, sales revenue, quality of leads.

Tools To Measure Event Marketing Chart Powerpoint Slides Deck Template
This is a tools to measure event marketing chart powerpoint slides deck template. This is a six stage process. The stages in this process are cross functional, business intelligence, sales and promotion, going viral, driving roi, growing fans.
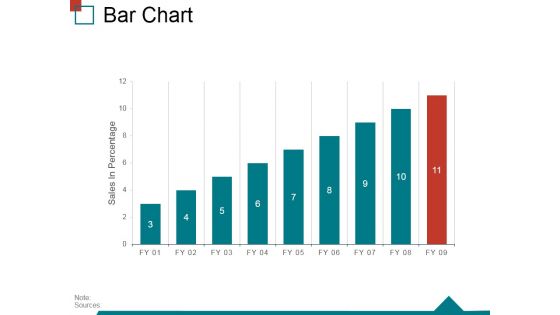
Bar Chart Ppt PowerPoint Presentation Infographic Template Skills
This is a bar chart ppt powerpoint presentation infographic template skills. This is a nine stage process. The stages in this process are sales in percentage, finance, business, marketing, strategy, success.
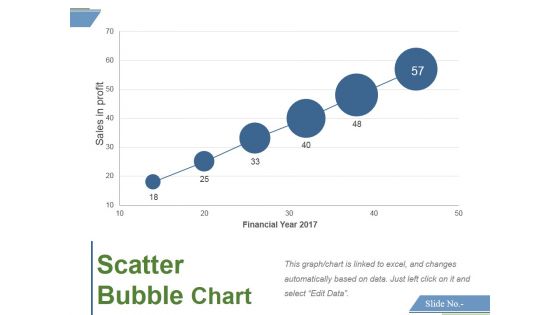
Scatter Bubble Chart Ppt PowerPoint Presentation Professional Model
This is a scatter bubble chart ppt powerpoint presentation professional model. This is a six stage process. The stages in this process are sales in profit, financial year, growth, business, marketing, strategy.

Bar Chart Ppt PowerPoint Presentation Slides Design Ideas
This is a bar chart ppt powerpoint presentation slides design ideas. This is a six stage process. The stages in this process are product, bar chart, sales in percentage.

Line Chart Ppt PowerPoint Presentation Infographic Template Introduction
This is a line chart ppt powerpoint presentation infographic template introduction. This is a two stage process. The stages in this process are product, sales in percentage, financial years, line chart.
Line Chart Ppt PowerPoint Presentation Infographic Template Icons
This is a line chart ppt powerpoint presentation infographic template icons. This is a two stage process. The stages in this process are sales in percentage, financial years, product, line chart.

Line Chart Ppt PowerPoint Presentation Gallery Master Slide
This is a line chart ppt powerpoint presentation gallery master slide. This is a two stage process. The stages in this process are sales in percentage, product, line chart.

Bar Chart Ppt PowerPoint Presentation Professional Graphics Download
This is a bar chart ppt powerpoint presentation professional graphics download. This is a seven stage process. The stages in this process are sales in percentage, financial years, chart, business.
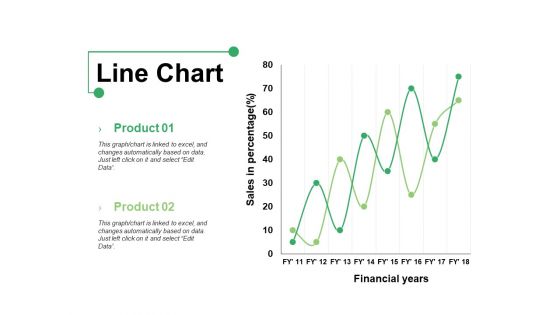
Line Chart Ppt PowerPoint Presentation Show Graphics Example
This is a line chart ppt powerpoint presentation show graphics example. This is a two stage process. The stages in this process are product, line chart, financial years, sales in percentage.

Line Chart Ppt PowerPoint Presentation Portfolio Background Image
This is a line chart ppt powerpoint presentation portfolio background image. This is a two stage process. The stages in this process are sales in percentage, financial years, chart, business, marketing, finance.
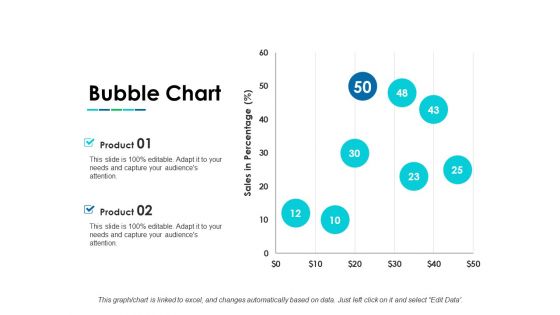
Bubble Chart Ppt PowerPoint Presentation Infographic Template Layouts
This is a bubble chart ppt powerpoint presentation infographic template layouts. This is a two stage process. The stages in this process are bubble chart, product, sales in percentage, growth.
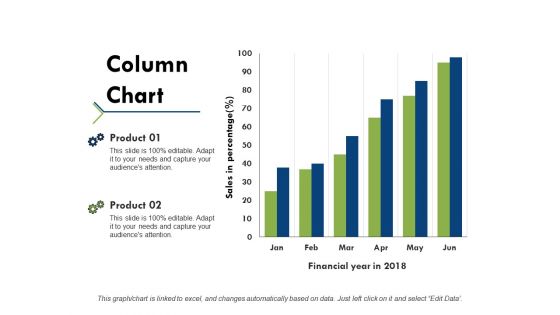
Column Chart Ppt PowerPoint Presentation Portfolio Example Topics
This is a column chart ppt powerpoint presentation portfolio example topics. This is a two stage process. The stages in this process are product, financial year, sales in percentage, column chart.
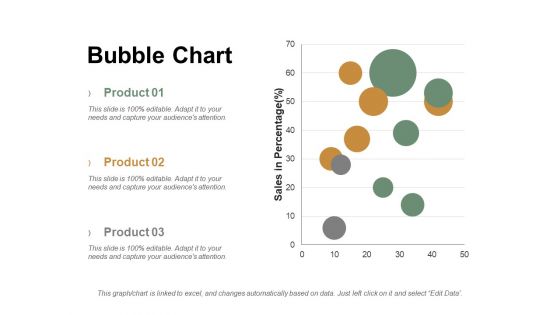
Bubble Chart Ppt PowerPoint Presentation Summary Graphics Tutorials
This is a bubble chart ppt powerpoint presentation summary graphics tutorials. This is a three stage process. The stages in this process are product, sales in percentage, bubble chart.

Business Diagram Pie Chart Octagon Shape Presentation Template
This business plan power point template has been designed with pie chart in octagon shape. This PPT contains the concept of result analysis for any business process. Use this PPT for business and sales related presentations.
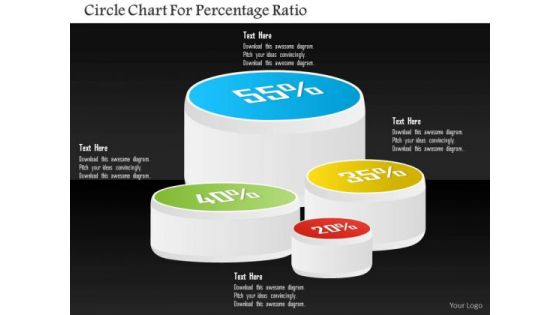
Business Diagram Circle Chart For Percentage Ratio Presentation Template
Four staged circular chart has been used to craft this PPT diagram. This PPT contains the concept of result analysis. Use this PPT in your business and sales presentation and display any kind of result analysis in a graphical way.
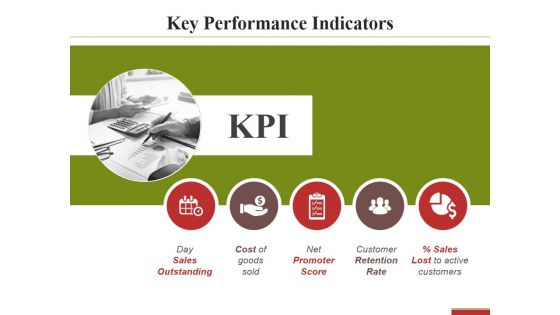
Key Performance Indicators Template 2 Ppt PowerPoint Presentation Pictures Slide
This is a key performance indicators template 2 ppt powerpoint presentation pictures slide. This is a five stage process. The stages in this process are day sales outstanding, cost of goods sold, net promoter score.
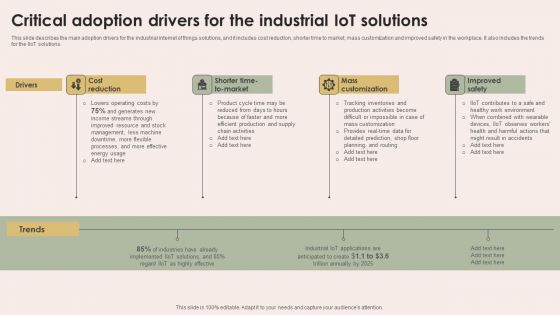
Smart Manufacturing With Iot Critical Adoption Drivers For The Industrial Iot Solutions Elements PDF
This slide describes the main adoption drivers for the industrial internet of things solutions, and it includes cost reduction, shorter time to market, mass customization and improved safety in the workplace. It also includes the trends for the IIoT solutions. Make sure to capture your audiences attention in your business displays with our gratis customizable Smart Manufacturing With Iot Critical Adoption Drivers For The Industrial Iot Solutions Elements PDF. These are great for business strategies, office conferences, capital raising or task suggestions. If you desire to acquire more customers for your tech business and ensure they stay satisfied, create your own sales presentation with these plain slides.
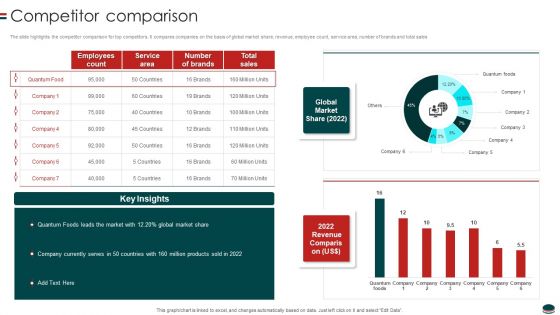
Instant Snacks And Food Firm Details Competitor Comparison Formats PDF
The slide highlights the competitor comparison for top competitors. It compares companies on the basis of global market share, revenue, employee count, service area, number of brands and total sales.Deliver and pitch your topic in the best possible manner with this Instant Snacks And Food Firm Details Competitor Comparison Formats PDF Use them to share invaluable insights on Employees Count, Service Area, Total Sales and impress your audience. This template can be altered and modified as per your expectations. So, grab it now.

Closing Techniques To Seal Overview And Best Practices To Achieve High Ticket SA SS V
Following slide provides comprehensive overview of high ticket closing sales to sell high premium services to specific customers. It includes elements such as introduction, best practices, etc. The Closing Techniques To Seal Overview And Best Practices To Achieve High Ticket SA SS V is a compilation of the most recent design trends as a series of slides. It is suitable for any subject or industry presentation, containing attractive visuals and photo spots for businesses to clearly express their messages. This template contains a variety of slides for the user to input data, such as structures to contrast two elements, bullet points, and slides for written information. Slidegeeks is prepared to create an impression.

Line Chart Ppt PowerPoint Presentation Infographics Graphic Images
This is a line chart ppt powerpoint presentation infographics graphic images. This is a two stage process. The stages in this process are sales in percentage, financial years, growth, business, marketing.
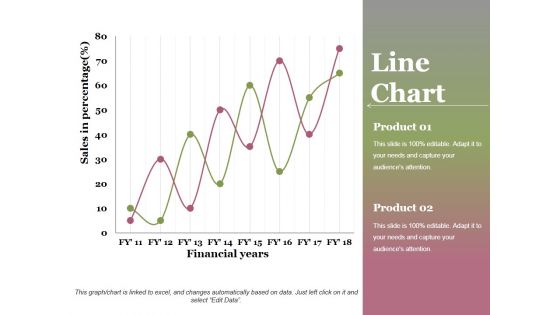
Line Chart Ppt PowerPoint Presentation Professional Graphics Design
This is a line chart ppt powerpoint presentation professional graphics design. This is a two stage process. The stages in this process are financial years, sales in percentage, product, growth, success.
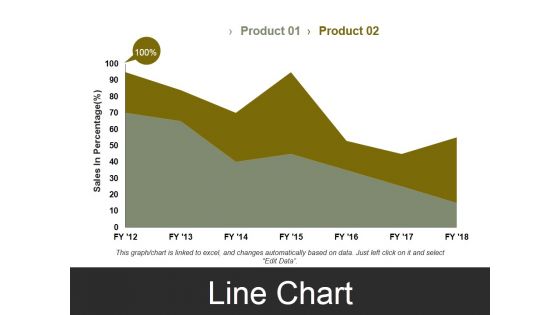
Line Chart Template 3 Ppt PowerPoint Presentation Styles Visual Aids
This is a line chart template 3 ppt powerpoint presentation styles visual aids. This is a two stage process. The stages in this process are sales in percentage, business, marketing, finance, graph.

Clustered Column Chart Ppt PowerPoint Presentation Show Slideshow
This is a clustered column chart ppt powerpoint presentation show slideshow. This is a six stage process. The stages in this process are financial year in, sales in percentage, business, marketing, finance.

Column Chart Ppt PowerPoint Presentation Slides Visual Aids
This is a column chart ppt powerpoint presentation slides visual aids. This is a six stage process. The stages in this process are bar graph, growth, success, sales in percentage, financial year.

Bar Chart Ppt PowerPoint Presentation Visual Aids Diagrams
This is a bar chart ppt powerpoint presentation visual aids diagrams. This is a two stage process. The stages in this process are business, marketing, financial years, sales in percentage, graph.
Column Chart Ppt PowerPoint Presentation Infographic Template Icon
This is a column chart ppt powerpoint presentation infographic template icon. This is a two stage process. The stages in this process are business, marketing, sales in percentage, financial year, graph.
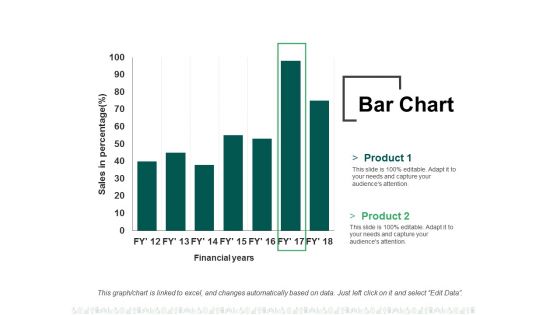
Bar Chart Ppt PowerPoint Presentation Summary File Formats
This is a bar chart ppt powerpoint presentation summary file formats. This is a two stage process. The stages in this process are business, finance, financial years, sales in percentage, graph.

Combo Chart Ppt PowerPoint Presentation Gallery Design Ideas
This is a combo chart ppt powerpoint presentation gallery design ideas. This is a three stage process. The stages in this process are business, financial years, sales in percentage, finance, graph.
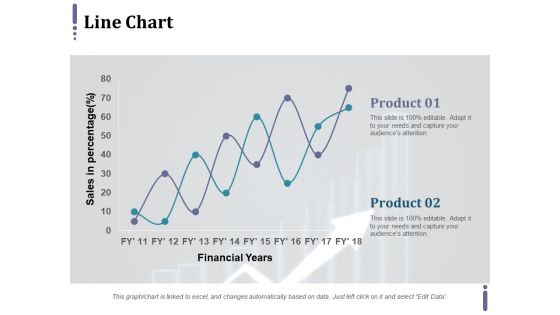
Line Chart Ppt PowerPoint Presentation Infographic Template Master Slide
This is a line chart ppt powerpoint presentation infographic template master slide. This is a two stage process. The stages in this process are product, financial years, sales in percentage.

Clustered Column Chart Ppt PowerPoint Presentation Professional Ideas
This is a clustered column chart ppt powerpoint presentation professional ideas. This is a three stage process. The stages in this process are product, sales in percentage, column, years.

Clustered Column Line Chart Ppt PowerPoint Presentation File Pictures
This is a clustered column line chart ppt powerpoint presentation file pictures. This is a four stage process. The stages in this process are clustered bar, product, planning, business, sales in percentage.
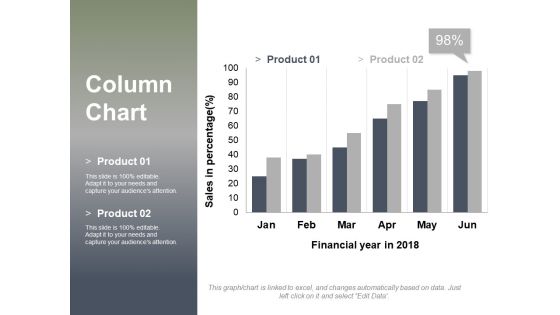
Column Chart Ppt PowerPoint Presentation Layouts Design Inspiration
This is a column chart ppt powerpoint presentation layouts design inspiration. This is a two stage process. The stages in this process are sales in percentage, financial year in, graph, business, finance, marketing.
Kpis Deriving Demand Driven Manufacturing Operations Icons PDF
This slide represents the metrics which drive actions for demand driven manufacturing operations. It includes details related to operations, supplier, customer sales and quality. Showcasing this set of slides titled Kpis Deriving Demand Driven Manufacturing Operations Icons PDF. The topics addressed in these templates are Operations, Supplier, Customer Or Sales, Quality. All the content presented in this PPT design is completely editable. Download it and make adjustments in color, background, font etc. as per your unique business setting.

Commodity Launch Kickoff Administration Playbook Selecting Effective Product Launch Introduction PDF
This slide provides information regarding selection of suitable product launch platform by considering platforms in terms of CRM, lead generation, business intelligence, sales and marketing, feedbacks management, etc. along with cost. The Commodity Launch Kickoff Administration Playbook Selecting Effective Product Launch Introduction PDF is a compilation of the most recent design trends as a series of slides. It is suitable for any subject or industry presentation, containing attractive visuals and photo spots for businesses to clearly express their messages. This template contains a variety of slides for the user to input data, such as structures to contrast two elements, bullet points, and slides for written information. Slidegeeks is prepared to create an impression.
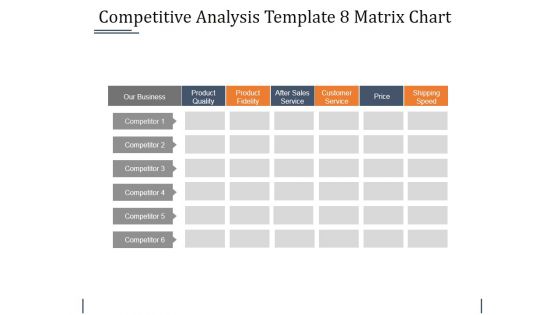
Competitive Analysis Template 8 Matrix Chart Ppt PowerPoint Presentation Show Outfit
This is a competitive analysis template 8 matrix chart ppt powerpoint presentation show outfit. This is a six stage process. The stages in this process are product quality, product fidelity, after sales service, customer service, price, shipping speed.

PowerPoint Templates Chart 3d Puzzle Process Ppt Slide
PowerPoint templates Chart 3D Puzzle Process PPT Slide-Puzzle diagram is a visual tool that allows you to create and visualize a sales process. -PowerPoint templates Chart 3D Puzzle Process PPT Slide

CRM System Deployment Plan Post Implementation Impacts On Business Aspects Background PDF
This slide covers major improvements after CRM software implementation. It includes major impact on areas such as customer retention, customer satisfaction, sales revenue, and upselling or cross-selling. Deliver an awe inspiring pitch with this creative CRM System Deployment Plan Post Implementation Impacts On Business Aspects Background PDF bundle. Topics like Sales Revenue, Customer Satisfaction, Customer Retention can be discussed with this completely editable template. It is available for immediate download depending on the needs and requirements of the user.

Key Financial Chart Military Aircraft Engine Manufacturing PPT Presentation CP SS V
This slide showcases the sales of General electric. It includes sales growth of five years. Sales growth measures the ability of sales team to increase revenue over a fixed period of time and also depicts net income growth. Explore a selection of the finest Key Financial Chart Military Aircraft Engine Manufacturing PPT Presentation CP SS V here. With a plethora of professionally designed and pre-made slide templates, you can quickly and easily find the right one for your upcoming presentation. You can use our Key Financial Chart Military Aircraft Engine Manufacturing PPT Presentation CP SS V to effectively convey your message to a wider audience. Slidegeeks has done a lot of research before preparing these presentation templates. The content can be personalized and the slides are highly editable. Grab templates today from Slidegeeks.

Key Financial Chart Global Energy Company Profile PPT Example CP SS V
This slide showcases the sales of General electric. It includes sales growth of five years. Sales growth measures the ability of sales team to increase revenue over a fixed period of time and also depicts net income growth. Explore a selection of the finest Key Financial Chart Global Energy Company Profile PPT Example CP SS V here. With a plethora of professionally designed and pre-made slide templates, you can quickly and easily find the right one for your upcoming presentation. You can use our Key Financial Chart Global Energy Company Profile PPT Example CP SS V to effectively convey your message to a wider audience. Slidegeeks has done a lot of research before preparing these presentation templates. The content can be personalized and the slides are highly editable. Grab templates today from Slidegeeks.

Stock Photo Graphics For Business Reports And Charts PowerPoint Slide
This image contains graphics of business reports and charts. Download this image for business and sales presentations where you have to focus on financial growth. Dazzle the audience with your thoughts.

Stock Photo Design Of Business Reports And Charts PowerPoint Slide
This image slide has been professionally designed to give complete look to your business presentations. This image is designed with graphics of business reports and charts. Use this image in marketing and sales related presentations.

Stock Photo Design Of Financial Charts And Reports PowerPoint Slide
This image slide has been professionally designed to give complete look to your business presentations. This image is designed with graphics of business reports and charts. Use this image in marketing and sales related presentations.
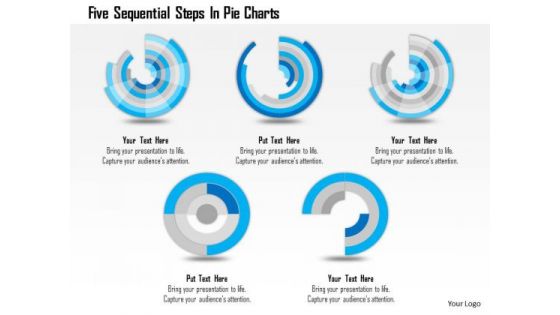
Business Diagram Five Sequential Steps In Pie Charts Presentation Template
Five sequential pie charts are used to craft this power point template. This PPT contains the concept of process flow and result analysis. Use this PPT for your business and sales related presentations and build quality presentation for your viewers.

 Home
Home