Project Kpi

Business Data Analysis Activity Generated Data Guidelines PDF
This is a business data analysis activity generated data guidelines pdf template with various stages. Focus and dispense information on three stages using this creative set, that comes with editable features. It contains large content boxes to add your information on topics like the data generated by the processors found within vehicles, video games, cable boxes or, soon, household appliances, the data generated by the processors found within vehicles, video games, cable boxes or, soon, household appliances. You can also showcase facts, figures, and other relevant content using this PPT layout. Grab it now.
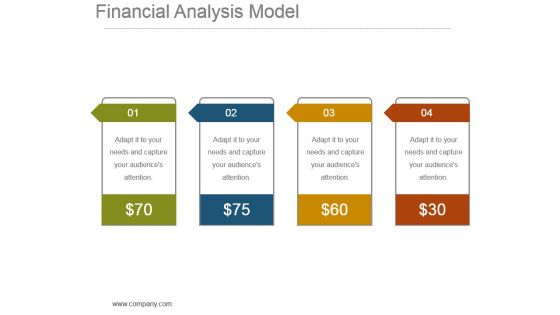
Financial Analysis Model Powerpoint Slide Show
This is a financial analysis model powerpoint slide show. This is a four stage process. The stages in this process are dollar, symbol, business, marketing, finance.
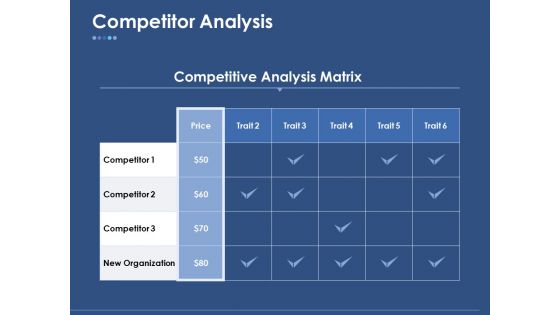
Competitor Analysis Ppt PowerPoint Presentation Outline Portfolio
This is a competitor analysis ppt powerpoint presentation outline portfolio. This is a four stage process. The stages in this process are table, marketing, strategy, planning, competition.
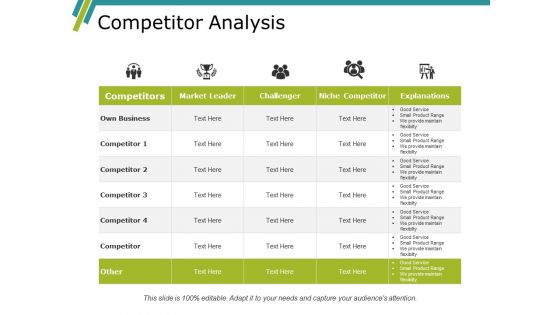
Competitor Analysis Ppt PowerPoint Presentation Layouts Designs
This is a competitor analysis ppt powerpoint presentation layouts designs. This is a four stage process. The stages in this process are tables, competition, strategy, planning, finance.

Customer Relationship Management Action Plan Data Mining In CRM Mockup PDF
Deliver an awe inspiring pitch with this creative customer relationship management action plan data mining in crm mockup pdf bundle. Topics like discovery, predictive modeling, forensic analysis can be discussed with this completely editable template. It is available for immediate download depending on the needs and requirements of the user.
Target Market Assessment Analysis Icon Mockup PDF
Persuade your audience using this Target Market Assessment Analysis Icon Mockup PDF. This PPT design covers four stages, thus making it a great tool to use. It also caters to a variety of topics including Target Market Assessment, Analysis Icon. Download this PPT design now to present a convincing pitch that not only emphasizes the topic but also showcases your presentation skills.
Business Objectives Impact Analysis Icon Themes PDF
Presenting Business Objectives Impact Analysis Icon Themes PDF to dispense important information. This template comprises three stages. It also presents valuable insights into the topics including Business Objectives, Impact Analysis Icon. This is a completely customizable PowerPoint theme that can be put to use immediately. So, download it and address the topic impactfully.
Business Process Impact Analysis Icon Demonstration PDF
Persuade your audience using this Business Process Impact Analysis Icon Demonstration PDF. This PPT design covers three stages, thus making it a great tool to use. It also caters to a variety of topics including Business Process, Impact Analysis Icon. Download this PPT design now to present a convincing pitch that not only emphasizes the topic but also showcases your presentation skills.
Problem Analysis Overview Procedure Icon Summary PDF
Presenting Problem Analysis Overview Procedure Icon Summary PDF to dispense important information. This template comprises three stages. It also presents valuable insights into the topics including Problem Analysis, Overview Procedure Icon . This is a completely customizable PowerPoint theme that can be put to use immediately. So, download it and address the topic impactfully.
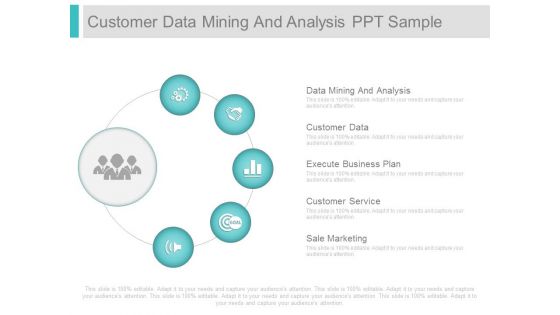
Customer Data Mining And Analysis Ppt Sample
This is a customer data mining and analysis ppt sample. This is a five stage process. The stages in this process are data mining and analysis, customer data, execute business plan, customer service, sale marketing.
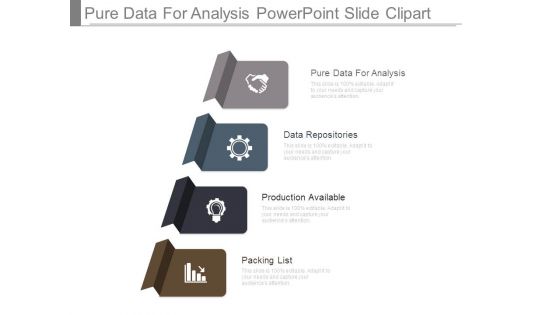
Pure Data For Analysis Powerpoint Slide Clipart
This is a pure data for analysis powerpoint slide clipart. This is a four stage process. The stages in this process are pure data for analysis, data repositories, production available, packing list.

Competitor Analysis Ppt PowerPoint Presentation Outline Rules
This is a competitor analysis ppt powerpoint presentation outline rules. This is a seven stage process. The stages in this process are revenue, profit, market share, main activity, number of employee.
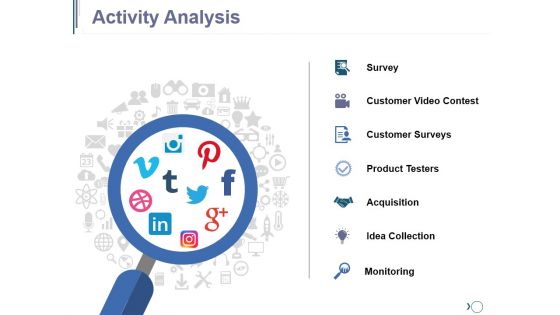
Activity Analysis Ppt PowerPoint Presentation Diagram Images
This is a activity analysis ppt powerpoint presentation diagram images. This is a one stage process. The stages in this process are survey, customer video contest, customer surveys, product testers, acquisition, idea collection.
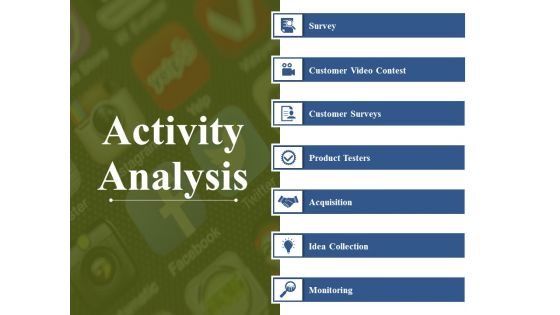
Activity Analysis Ppt PowerPoint Presentation Styles Elements
This is a activity analysis ppt powerpoint presentation styles elements. This is a seven stage process. The stages in this process are survey, customer video contest, customer surveys, product testers, acquisition.
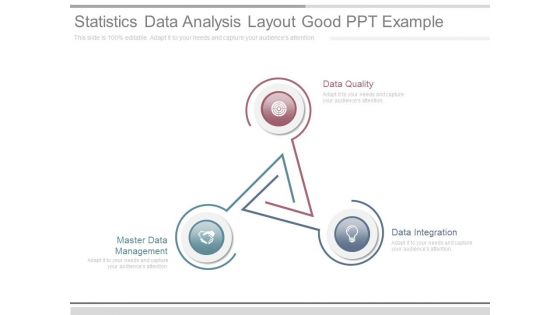
Statistics Data Analysis Layout Good Ppt Example
This is a statistics data analysis layout good ppt example. This is a three stage process. The stages in this process are data quality, data integration, master data management.
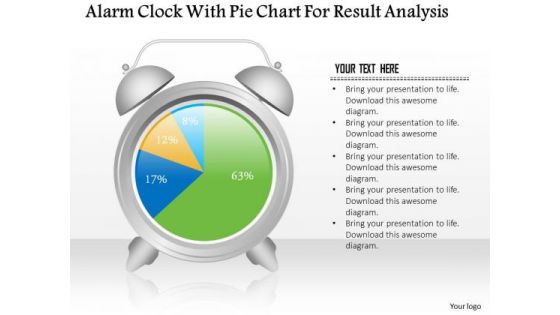
Business Diagram Alarm Clock With Pie Chart For Result Analysis PowerPoint Slide
This business slide displays alarm clock with pie chart. This diagram is a data visualization tool that gives you a simple way to present statistical information. This slide helps your audience examine and interpret the data you present.

Information Systems Security And Risk Management Plan Estimated Impact Of Information Security Risk Management Plan Ideas PDF
This slide showcases capabilities of organization regarding information and data security after risk management plan. Its key component are risk management functions, required standard rating and actual standard rating. This Information Systems Security And Risk Management Plan Estimated Impact Of Information Security Risk Management Plan Ideas PDF is perfect for any presentation, be it in front of clients or colleagues. It is a versatile and stylish solution for organizing your meetings. The product features a modern design for your presentation meetings. The adjustable and customizable slides provide unlimited possibilities for acing up your presentation. Slidegeeks has done all the homework before launching the product for you. So, do not wait, grab the presentation templates today

Business Data ORMF Ppt PowerPoint Presentation Professional Template PDF
This slide covers different components of ORMF in banking sector. It includes components such as risk identification and monitoring, loss data management, estimation of loss, scenario analysis.Persuade your audience using this Business Data ORMF Ppt PowerPoint Presentation Professional Template PDF. This PPT design covers five stages, thus making it a great tool to use. It also caters to a variety of topics including Risk Identification, Risk Monitoring, Data Management. Download this PPT design now to present a convincing pitch that not only emphasizes the topic but also showcases your presentation skills.

Product Data Insights Analysis Sheet Infographics PDF
The following slide depicts the annual performance of multiple products in terms of profit or loss to track whether they are doing well or not. The analysis sheet includes element such as cost, units, selling price, sales etc. Pitch your topic with ease and precision using this Product Data Insights Analysis Sheet Infographics PDF. This layout presents information on Unit Sold, Selling Price, Total Sales. It is also available for immediate download and adjustment. So, changes can be made in the color, design, graphics or any other component to create a unique layout.

Customer Lifetime Value Table Analysis Powerpoint Show
This is a customer lifetime value table analysis powerpoint show. This is a five stage process. The stages in this process are complete clv year, average acquisition cost, average customer revenue, average customer costs, average customer profit, customer retention rate, cumulative retention rate, likely customer profit, discount rate.

Comparable Company Analysis To Evaluate Understanding Investment Banking Framework Fin SS V
This slide shows detailed process of comparable company analysis technique which can be used to estimate value of company by using data of similar company. It includes steps such as identify, gather data, etc. Do you have to make sure that everyone on your team knows about any specific topic I yes, then you should give Comparable Company Analysis To Evaluate Understanding Investment Banking Framework Fin SS V a try. Our experts have put a lot of knowledge and effort into creating this impeccable Comparable Company Analysis To Evaluate Understanding Investment Banking Framework Fin SS V. You can use this template for your upcoming presentations, as the slides are perfect to represent even the tiniest detail. You can download these templates from the Slidegeeks website and these are easy to edit. So grab these today
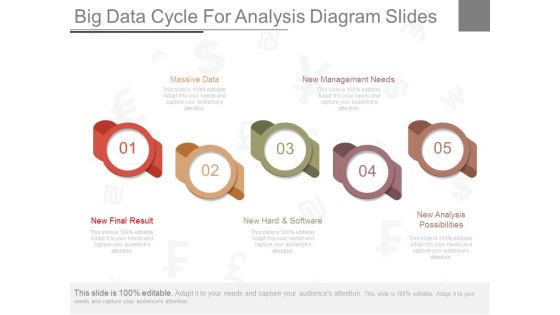
Big Data Cycle For Analysis Diagram Slides
This is a big data cycle for analysis diagram slides. This is a five stage process. The stages in this process are massive data, new management needs, new final result, new hard and software, new analysis possibilities.

Big Data Partnership Challenges Analysis Ppt Design
This is a big data partnership challenges analysis ppt design. This is a four stage process. The stages in this process are academia and scientific communities, national statically offers, big data providers data sources, research institutes and technology providers.
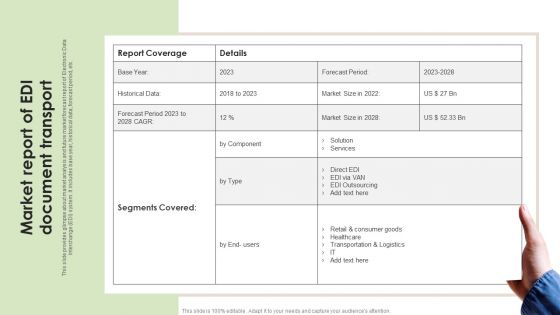
Market Report Of EDI Document Transport Pictures PDF
This slide provides glimpse about market analysis and future market forecast report of Electronic Data Interchange EDI system. It includes base year, historical data, forecast period, etc.Showcasing this set of slides titled Market Report Of EDI Document Transport Pictures PDF. The topics addressed in these templates are Segments Covered, Report Coverage, Retail Consumer. All the content presented in this PPT design is completely editable. Download it and make adjustments in color, background, font etc. as per your unique business setting.
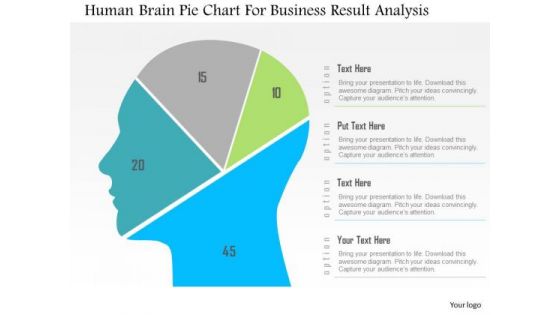
Business Diagram Human Brain Pie Chart For Business Result Analysis PowerPoint Slide
This diagram displays human face graphic divided into sections. This section can be used for data display. Use this diagram to build professional presentations for your viewers.
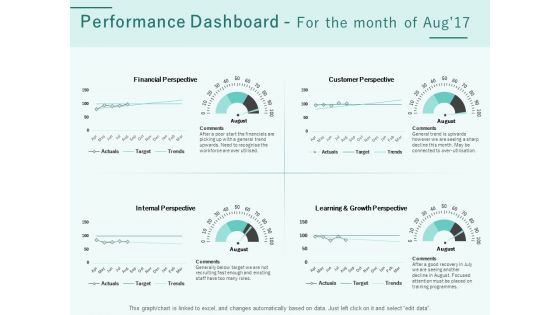
Progress Assessment Outline Performance Dashboard For The Month Of Aug 17 Ppt PowerPoint Presentation Model Clipart Images PDF
Presenting this set of slides with name progress assessment outline performance dashboard for the month of aug 17 ppt powerpoint presentation model clipart images pdf. The topics discussed in these slides are financial perspective, customer perspective, internal perspective, learning and growth perspective. This is a completely editable PowerPoint presentation and is available for immediate download. Download now and impress your audience.
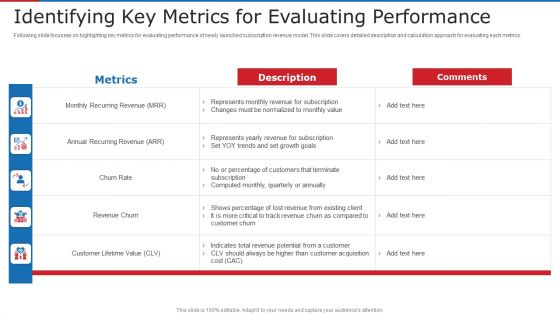
Identifying Key Metrics For Evaluating Performance Ppt Styles Files PDF
Following slide focusses on highlighting key metrics for evaluating performance of newly launched subscription revenue model. This slide covers detailed description and calculation approach for evaluating each metrics. Deliver and pitch your topic in the best possible manner with this identifying key metrics for evaluating performance ppt styles files pdf. Use them to share invaluable insights on revenue, growth, goals, potential, customer and impress your audience. This template can be altered and modified as per your expectations. So, grab it now.
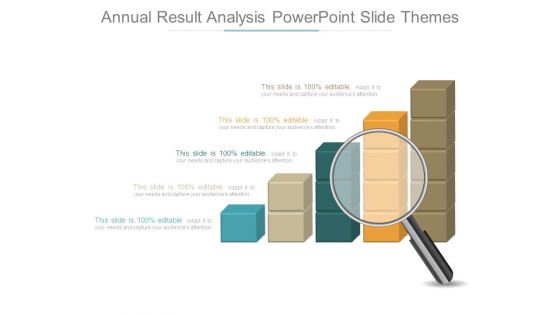
Annual Result Analysis Powerpoint Slide Themes
This is a annual result analysis powerpoint slide themes. This is a five stage process. The stages in this process are business, process, presentation, strategy, analysis.

Data Collection And Analysis Control Chart Ppt PowerPoint Presentation Visuals
This is a data collection and analysis control chart ppt powerpoint presentation visuals. This is a ten stage process. The stages in this process are upper limit, centerline, lower limit, plotted points.
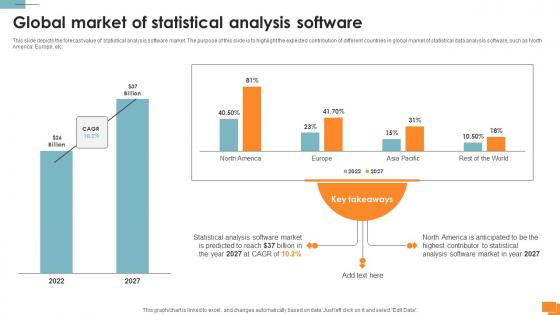
Statistical Tools For Evidence Global Market Of Statistical Analysis Software
This slide depicts the forecast value of statistical analysis software market. The purpose of this slide is to highlight the expected contribution of different countries in global market of statistical data analysis software, such as North America, Europe, etc. This modern and well-arranged Statistical Tools For Evidence Global Market Of Statistical Analysis Software provides lots of creative possibilities. It is very simple to customize and edit with the Powerpoint Software. Just drag and drop your pictures into the shapes. All facets of this template can be edited with Powerpoint, no extra software is necessary. Add your own material, put your images in the places assigned for them, adjust the colors, and then you can show your slides to the world, with an animated slide included.

Data Processing And Analysis Powerpoint Slides
This is a data processing and analysis powerpoint slides. This is a five stage process. The stages in this process are financial reporting and business excellence, competitive intelligence and strategy support, analysis and tool creation, planning and performance management support, data processing and analysis.

Key Technologies For Big Data Analytics In Organization Ppt Outline Gridlines PDF
The following slide highlights applications of key technologies for big data analytics in business industry to discover hardware and software solutions for processing data. It includes components such as predictive analysis, nosql database, knowledge discovery tools , data virtualization etc. Presenting Key Technologies For Big Data Analytics In Organization Ppt Outline Gridlines PDF to dispense important information. This template comprises five stages. It also presents valuable insights into the topics including Predictive Analytics, Knowledge Discovery Tools, Data Virtualization, Distributed Storage . This is a completely customizable PowerPoint theme that can be put to use immediately. So, download it and address the topic impactfully.

Financial Figures Data Analysis Report Powerpoint Slides
Our above PowerPoint template contains table chart with financial figures. This professional slide may be used to display data analysis report. Enlighten your audience with your breathtaking ideas.
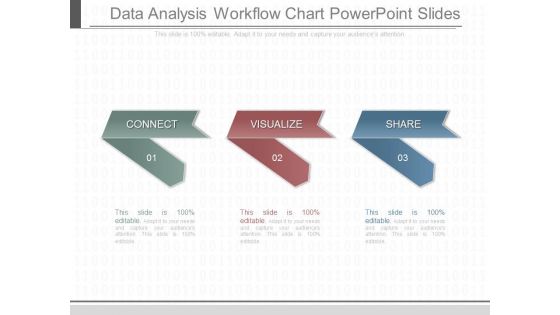
Data Analysis Workflow Chart Powerpoint Slides
This is a data analysis workflow chart powerpoint slides. This is a three stage process. The stages in this process are connect, visualize, share.

Retail Data Analysis Powerpoint Templates Download
This is a retail data analysis powerpoint templates download. This is a six stage process. The stages in this process are leadership, innovation, people, goals, results, strategies.
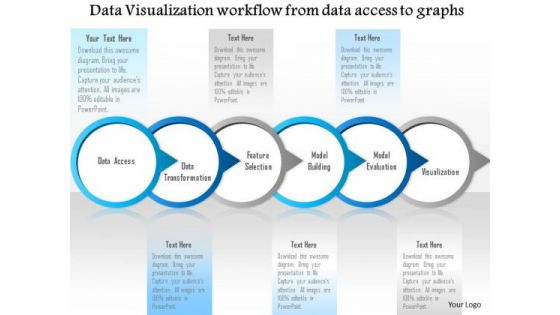
Business Diagram Data Visualization Workflow From Data Access To Graphs Ppt Slide
Graphic of workflow has been used to design this diagram. This diagram slide depicts the concept of data visualization from data access. This diagrams suitable for technology and internet related presentations.

Business Diagram Tablet With Pie And Business Bar Graph For Result Analysis PowerPoint Slide
This PowerPoint template displays technology gadgets with various business charts. Use this diagram slide, in your presentations to make business reports for statistical analysis. You may use this diagram to impart professional appearance to your presentations.
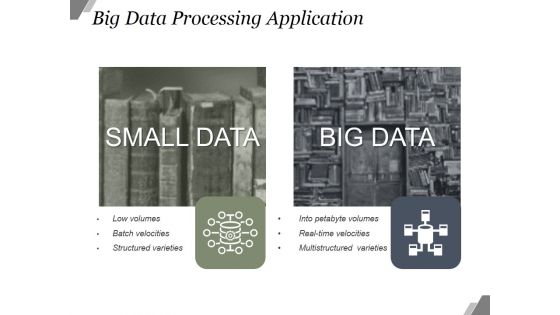
Big Data Processing Application Ppt PowerPoint Presentation Shapes
This is a big data processing application ppt powerpoint presentation shapes. This is a two stage process. The stages in this process are small data, big data, low volumes, batch velocities, structured varieties, into petabyte volumes.
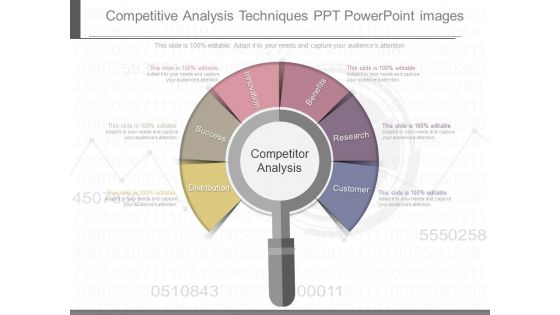
Competitive Analysis Techniques Ppt Powerpoint Images
This is a competitive analysis techniques ppt powerpoint images. This is a six stage process. The stages in this process are competitor analysis, distribution, success, innovation, benefits, research, customer.

Trend Line Technical Analysis Powerpoint Themes
This is a trend line technical analysis powerpoint themes. This is a five stage process. The stages in this process are complex systems, statistical modeling, uncertainty, lateral thinking, mathematical analysis.

Best Practices For Implementing Expenditure Assessment Infographics PDF
This slide showcase best practices to follow while implementing spend analysis to get positive results for business. It includes points data evaluation, review consistency, consolidation, forecasting, analyze and automation. Presenting Best Practices For Implementing Expenditure Assessment Infographics PDF to dispense important information. This template comprises Four stages. It also presents valuable insights into the topics including Evaluation And Consistency, Data Consolidation, Forecast And Analyze. This is a completely customizable PowerPoint theme that can be put to use immediately. So, download it and address the topic impactfully.

Data Mining Link Analysis Presentation Powerpoint Example
This is a data mining link analysis presentation powerpoint example. This is a ten stage process. The stages in this process are polynomial networks, link analysis, spectral density, kohonen networks, data mining, radial basis functions, associated rules, support vector machines, decision trees, neural network.

Benefits Of Data Analysis Ppt Powerpoint Show
This is a benefits of data analysis ppt powerpoint show. This is a five stage process. The stages in this process are r three is data rich, report opportunistic, testing the entire populations versus sample, date analysis increases effectiveness and efficiency, effective for working remotely or on site, easier to share information electronically than via hardcopy reports.
Business Data Analysis Icons Slide Icons PDF
Help your business to create an attention grabbing presentation using our business data analysis icons slide icons pdf set of slides. The slide contains innovative icons that can be flexibly edited. Choose this business data analysis icons slide icons pdf template to create a satisfactory experience for your customers. Go ahead and click the download button.
Sales Gap Data Analysis Icon Microsoft PDF
Persuade your audience using this Sales Gap Data Analysis Icon Microsoft PDF. This PPT design covers four stages, thus making it a great tool to use. It also caters to a variety of topics including Sales Gap Data, Analysis Icon. Download this PPT design now to present a convincing pitch that not only emphasizes the topic but also showcases your presentation skills.
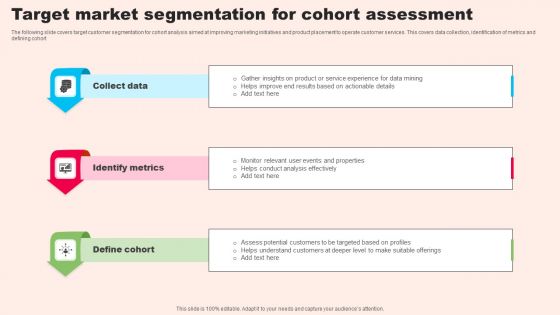
Target Market Segmentation For Cohort Assessment Mockup PDF
The following slide covers target customer segmentation for cohort analysis aimed at improving marketing initiatives and product placement to operate customer services. This covers data collection, identification of metrics and defining cohort. Persuade your audience using this Target Market Segmentation For Cohort Assessment Mockup PDF. This PPT design covers three stages, thus making it a great tool to use. It also caters to a variety of topics including Define Cohort, Identify Metrics, Collect Data. Download this PPT design now to present a convincing pitch that not only emphasizes the topic but also showcases your presentation skills.

Magnify Glass Ppt PowerPoint Presentation Influencers
This is a magnify glass ppt powerpoint presentation influencers. This is a five stage process. The stages in this process are business, marketing, success, searching, strategy.
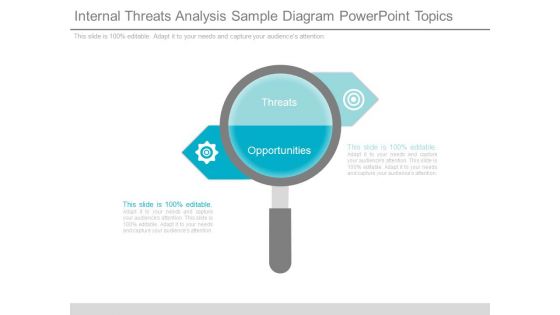
Internal Threats Analysis Sample Diagram Powerpoint Topics
This is a Internal Threats Analysis Sample Diagram Powerpoint Topics. This is a two stage process. The stages in this process are threats, opportunities.

Data Analysis Business PowerPoint Template 0910
binary data under a magnifying lens. digital illustration.

Financial Data Analysis Sample Diagram Presentation Slide
This is a financial data analysis sample diagram presentation slide. This is a four stage process. The stages in this process are finance, sales and marketing, operations, credit and risk.
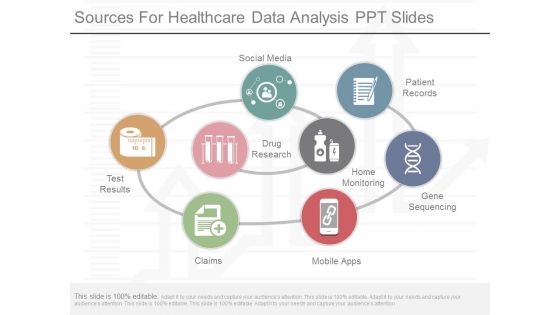
Sources For Healthcare Data Analysis Ppt Slides
This is a sources for healthcare data analysis ppt slides. This is a eight stage process. The stages in this process are social media, drug research, patient records, home monitoring, gene sequencing, mobile apps, claims, test results.
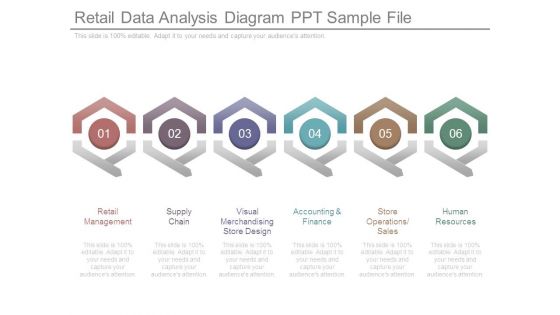
Retail Data Analysis Diagram Ppt Sample File
This is a retail data analysis diagram ppt sample file. This is a six stage process. The stages in this process are retail management, supply chain, visual merchandising store design, accounting and finance, store operations sales, human resources.
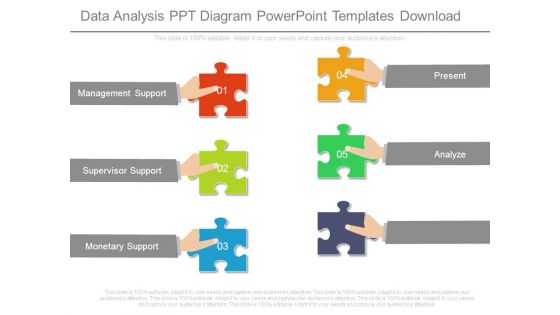
Data Analysis Ppt Diagram Powerpoint Templates Download
This is a data analysis ppt diagram powerpoint templates download. This is a five stage process. The stages in this process are management support, supervisor support, monetary support, present, analyze.

Big Data Software Application Brain Diagram Ppt PowerPoint Presentation Slides
This is a big data software application brain diagram ppt powerpoint presentation slides. This is a one stage process. The stages in this process are big data, communication, business, marketing, idea.
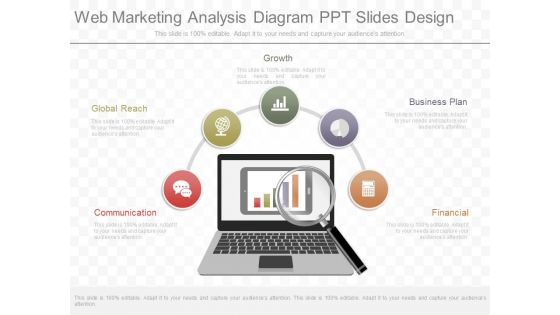
Web Marketing Analysis Diagram Ppt Slides Design
This is a web marketing analysis diagram ppt slides design. This is a five stage process. The stages in this process are communication, global reach, growth, business plan, financial.
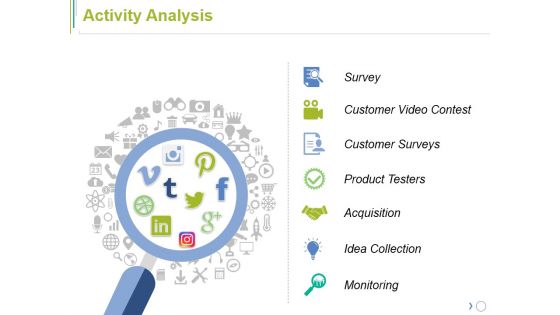
Activity Analysis Ppt PowerPoint Presentation File Outfit
This is a activity analysis ppt powerpoint presentation file outfit. This is a one stage process. The stages in this process are survey, customer video contest, customer surveys, product testers, acquisition.

Activity Analysis Ppt PowerPoint Presentation Summary Slideshow
This is a activity analysis ppt powerpoint presentation summary slideshow. This is a seven stage process. The stages in this process are survey, customer video contest, customer surveys, product testers, acquisition.
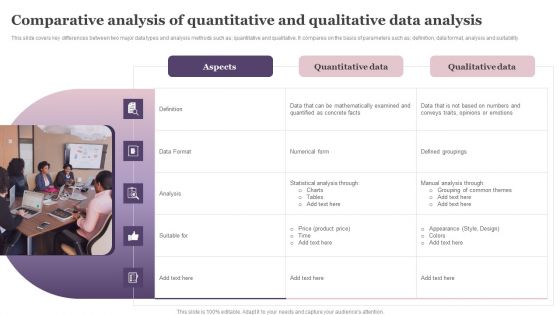
Comparative Analysis Of Quantitative And Qualitative Data Analysis Pictures PDF
Presenting Comparative Analysis Of Quantitative And Qualitative Data Analysis Pictures PDF to dispense important information. This template comprises five stages. It also presents valuable insights into the topics including Data Format, Analysis, Definition. This is a completely customizable PowerPoint theme that can be put to use immediately. So, download it and address the topic impactfully.

Business Diagram Data Driven Scatter Chart For Business PowerPoint Slide
This business diagram has been designed with four comparative charts. This slide suitable for data representation. You can also use this slide to present business analysis and reports. Use this diagram to present your views in a wonderful manner.

ITIL Continual Service Improvement Seven Step Process Rules Pdf
This slide brings forth a seven step information technology infrastructure library continual service improvement lifecycle which can be used by managers to improve business processes. Steps include select strategy for improvement, define what you will measure, gather data etc. Showcasing this set of slides titled ITIL Continual Service Improvement Seven Step Process Rules Pdf. The topics addressed in these templates are Strategy For Improvement, Define Metrics, Data Collection. All the content presented in this PPT design is completely editable. Download it and make adjustments in color, background, font etc. as per your unique business setting.

 Home
Home