Project Kpi

Financial Data Analysis Area Chart With Plotted Line Center PowerPoint Templates
Be The Doer With Our financial data analysis area chart with plotted line center Powerpoint Templates . Put Your Thoughts Into Practice.
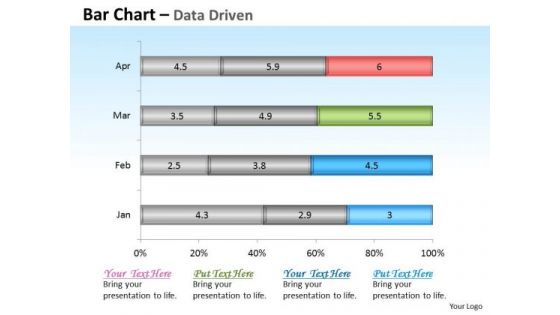
Financial Data Analysis Driven Base Bar Chart Design PowerPoint Slides Templates
Get The Domestics Right With Our financial data analysis driven base bar chart design powerpoint slides Templates . Create The Base For Thoughts To Grow.
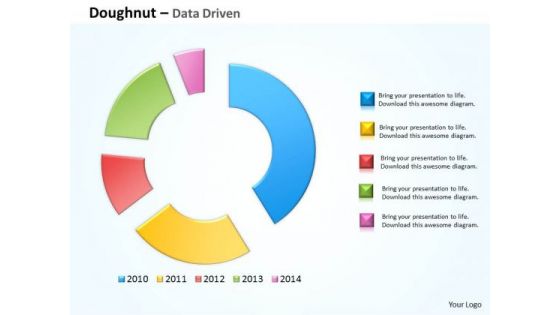
Financial Data Analysis Driven Compare Market Share Of Brand PowerPoint Templates
Doll Up Your Thoughts With Our financial data analysis driven compare market share of brand Powerpoint Templates . They Will Make A Pretty Picture.

Financial Data Analysis Driven Demonstrate Statistics With Scatter Chart PowerPoint Slides Templates
Establish The Dominance Of Your Ideas. Our financial data analysis driven demonstrate statistics with scatter chart powerpoint slides Templates Will Put Them On Top.

Financial Data Analysis Driven Scatter Chart Mathematical Diagram PowerPoint Slides Templates
Dominate Proceedings With Your Ideas. Our financial data analysis driven scatter chart mathematical diagram powerpoint slides Templates Will Empower Your Thoughts.

Microsoft Excel Data Analysis 3d Area Chart For Time Based PowerPoint Templates
Deliver The Right Dose With Our microsoft excel data analysis 3d area chart for time based Powerpoint Templates . Your Ideas Will Get The Correct Illumination.

Microsoft Excel Data Analysis 3d Area Chart Showimg Change In Values PowerPoint Templates
Our microsoft excel data analysis 3d area chart showimg change in values Powerpoint Templates Deliver At Your Doorstep. Let Them In For A Wonderful Experience.

Microsoft Excel Data Analysis 3d Bar Chart As Research Tool PowerPoint Templates
Knock On The Door To Success With Our microsoft excel data analysis 3d bar chart as research tool Powerpoint Templates . Be Assured Of Gaining Entry.
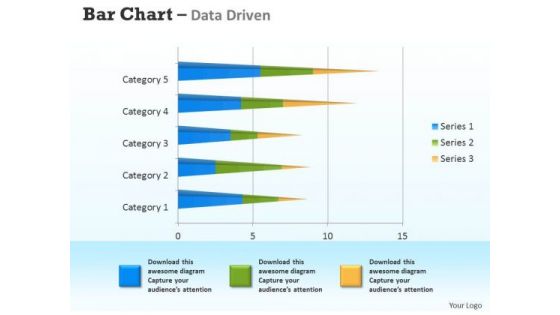
Microsoft Excel Data Analysis 3d Bar Chart For Analyzing Survey PowerPoint Templates
Connect The Dots With Our microsoft excel data analysis 3d bar chart for analyzing survey Powerpoint Templates . Watch The Whole Picture Clearly Emerge.

Microsoft Excel Data Analysis 3d Change In Business Process Chart PowerPoint Templates
Double Your Chances With Our microsoft excel data analysis 3d change in business process chart Powerpoint Templates . The Value Of Your Thoughts Will Increase Two-Fold.
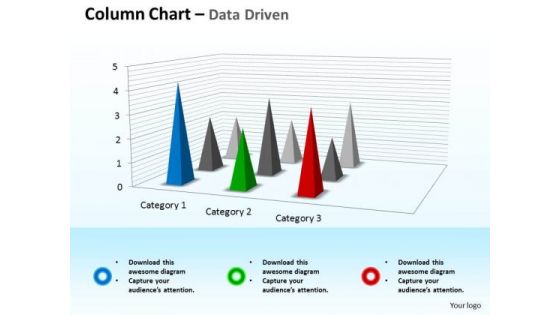
Microsoft Excel Data Analysis 3d Chart For Business Observation PowerPoint Templates
Double Up Our microsoft excel data analysis 3d chart for business observation Powerpoint Templates With Your Thoughts. They Will Make An Awesome Pair.

Microsoft Excel Data Analysis Bar Chart To Communicate Information PowerPoint Templates
With Our microsoft excel data analysis bar chart to communicate information Powerpoint Templates You Will Be Doubly Sure. They Possess That Stamp Of Authority.
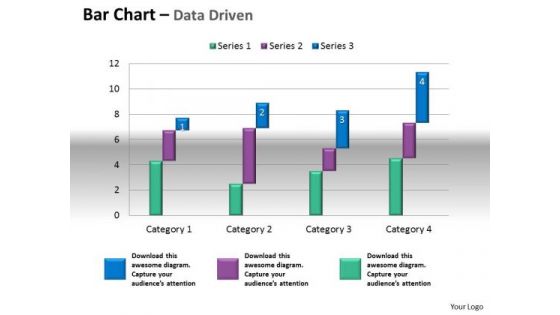
Microsoft Excel Data Analysis Bar Chart To Compare Quantities PowerPoint Templates
Our microsoft excel data analysis bar chart to compare quantities Powerpoint Templates Leave No One In Doubt. Provide A Certainty To Your Views.
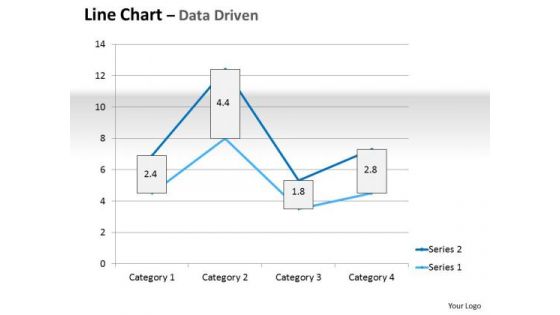
Multivariate Data Analysis Driven Line Chart Market Graph PowerPoint Slides Templates
Plan For All Contingencies With Our multivariate data analysis driven line chart market graph powerpoint slides Templates . Douse The Fire Before It Catches.
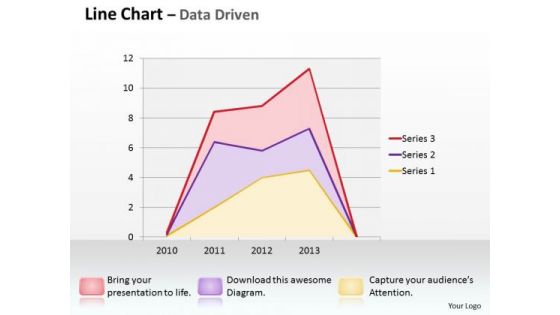
Multivariate Data Analysis Driven Line Chart Shows Revenue Trends PowerPoint Slides Templates
Good Camaraderie Is A Key To Teamwork. Our multivariate data analysis driven line chart shows revenue trends powerpoint slides Templates Can Be A Cementing Force.
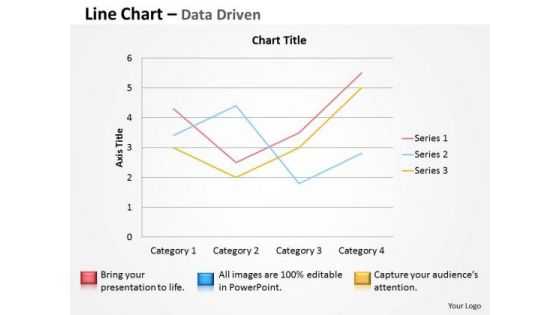
Multivariate Data Analysis Driven Line Chart To Demonstrate PowerPoint Slides Templates
Brace Yourself, Arm Your Thoughts. Prepare For The Hustle With Our multivariate data analysis driven line chart to demonstrate powerpoint slides Templates .

Quantitative Data Analysis 3d Line Chart For Comparison Of PowerPoint Templates
Touch Base With Our quantitative data analysis 3d line chart for comparison of Powerpoint Templates . Review Your Growth With Your Audience.

Quantitative Data Analysis 3d Pie Chart For Business Process PowerPoint Templates
Put Them On The Same Page With Our quantitative data analysis 3d pie chart for business process Powerpoint Templates . Your Team Will Sing From The Same Sheet.
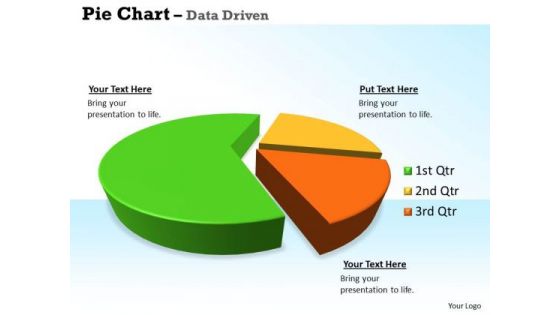
Quantitative Data Analysis 3d Pie Chart For Business Statistics PowerPoint Templates
Our quantitative data analysis 3d pie chart for business statistics Powerpoint Templates Allow You To Do It With Ease. Just Like Picking The Low Hanging Fruit.

Quantitative Data Analysis Driven Economic Status Line Chart PowerPoint Slides Templates
Be The Dramatist With Our quantitative data analysis driven economic status line chart powerpoint slides Templates . Script Out The Play Of Words.
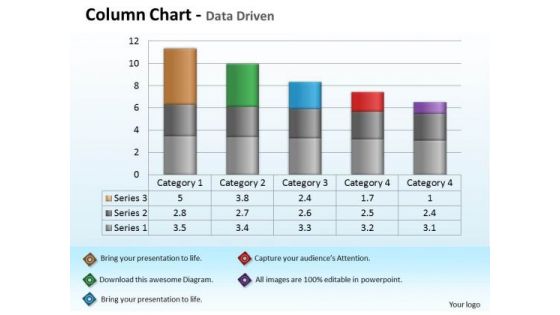
Quantitative Data Analysis Driven Economic With Column Chart PowerPoint Slides Templates
Add Some Dramatization To Your Thoughts. Our quantitative data analysis driven economic with column chart powerpoint slides Templates Make Useful Props.
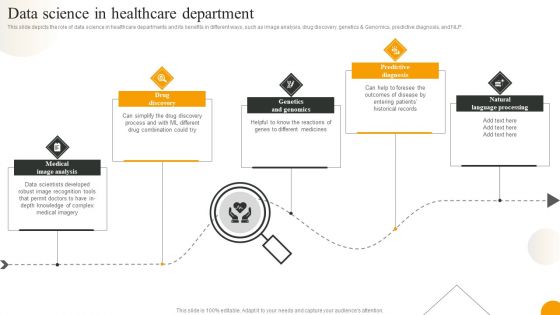
Using Data Science Technologies For Business Transformation Data Science In Healthcare Department Ideas PDF
This slide depicts the role of data science in healthcare departments and its benefits in different ways, such as image analysis, drug discovery, genetics and Genomics, predictive diagnosis, and NLP. Present like a pro with Using Data Science Technologies For Business Transformation Data Science In Healthcare Department Ideas PDF Create beautiful presentations together with your team, using our easy to use presentation slides. Share your ideas in real time and make changes on the fly by downloading our templates. So whether you are in the office, on the go, or in a remote location, you can stay in sync with your team and present your ideas with confidence. With Slidegeeks presentation got a whole lot easier. Grab these presentations today.
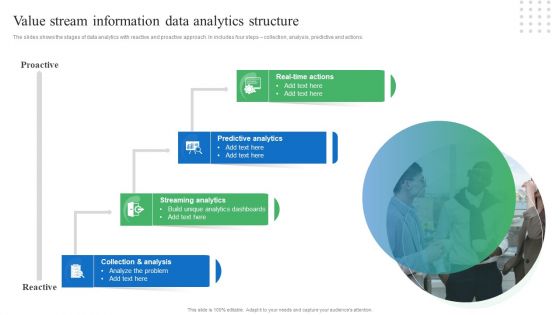
Toolkit For Data Science And Analytics Transition Value Stream Information Data Analytics Structure Sample PDF
The slides shows the stages of data analytics with reactive and proactive approach. In includes four steps collection, analysis, predictive and actions. Retrieve professionally designed Toolkit For Data Science And Analytics Transition Value Stream Information Data Analytics Structure Sample PDF to effectively convey your message and captivate your listeners. Save time by selecting pre made slideshows that are appropriate for various topics, from business to educational purposes. These themes come in many different styles, from creative to corporate, and all of them are easily adjustable and can be edited quickly. Access them as PowerPoint templates or as Google Slides themes. You do not have to go on a hunt for the perfect presentation because Slidegeeks got you covered from everywhere.

Business Intelligence And Big Transformation Toolkit Data Analytics Value Stream Chain Guidelines PDF
This slide illustrates the series of activities required for analyzing the data. It contains information such as data preparation, exploratory analysis, and predictive analytics etc. This is a business intelligence and big transformation toolkit data analytics value stream chain guidelines pdf template with various stages. Focus and dispense information on six stages using this creative set, that comes with editable features. It contains large content boxes to add your information on topics like data preparation, exploratory data analysis, data visualization, classification and clustering, predictive analytics. You can also showcase facts, figures, and other relevant content using this PPT layout. Grab it now.
Risk Analysis Vector Icon Ppt Powerpoint Presentation Infographics File Formats
This is a risk analysis vector icon ppt powerpoint presentation infographics file formats. This is a four stage process. The stages in this process are feedback loop icon, evaluation icon, assessment icon.

Three Year Marketing Business Plan With Key Metrics Diagrams PDF
The slide showcases a marketing plan to optimize performance and improve profitability. It covers setting annual target, budget allocation, feedbacks, strategies and key metrices to focus on. Presenting Three Year Marketing Business Plan With Key Metrics Diagrams PDF to dispense important information. This template comprises three stages. It also presents valuable insights into the topics including Attract Target Segment, Analyses, Product Or Service. This is a completely customizable PowerPoint theme that can be put to use immediately. So, download it and address the topic impactfully.
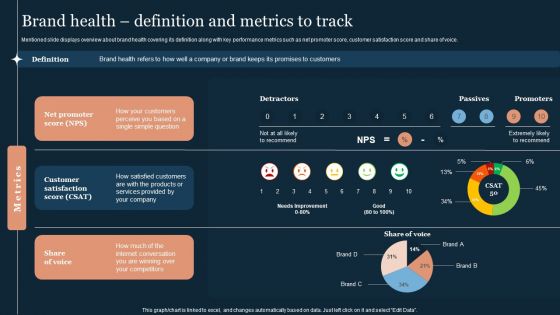
Guide To Develop And Estimate Brand Value Brand Health Definition And Metrics To Track Elements PDF
Mentioned slide displays overview about brand health covering its definition along with key performance metrics such as net promoter score, customer satisfaction score and share of voice.Whether you have daily or monthly meetings, a brilliant presentation is necessary. Guide To Develop And Estimate Brand Value Brand Health Definition And Metrics To Track Elements PDF can be your best option for delivering a presentation. Represent everything in detail using Guide To Develop And Estimate Brand Value Brand Health Definition And Metrics To Track Elements PDF and make yourself stand out in meetings. The template is versatile and follows a structure that will cater to your requirements. All the templates prepared by Slidegeeks are easy to download and edit. Our research experts have taken care of the corporate themes as well. So, give it a try and see the results.

Information Transformation Process Toolkit Data Analytics Value Stream Chain Microsoft PDF
This slide illustrates the series of activities required for analyzing the data. It contains information such as data preparation, exploratory analysis, and predictive analytics etc. Presenting Information Transformation Process Toolkit Data Analytics Value Stream Chain Microsoft PDF to provide visual cues and insights. Share and navigate important information on six stages that need your due attention. This template can be used to pitch topics like Exploratory Data Analysis, Data Visualization, Predictive Analytics. In addtion, this PPT design contains high resolution images, graphics, etc, that are easily editable and available for immediate download.
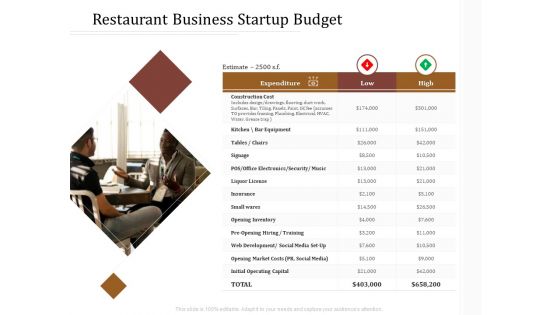
Key Metrics Hotel Administration Management Restaurant Business Startup Budget Diagrams PDF
Presenting this set of slides with name key metrics hotel administration management restaurant business startup budget diagrams pdf. This is a one stage process. The stages in this process are development, social media, market, costs, initial. This is a completely editable PowerPoint presentation and is available for immediate download. Download now and impress your audience.
Social Platforms Data Analysis Sites Data Mining Icon Guidelines PDF
Showcasing this set of slides titled Social Platforms Data Analysis Sites Data Mining Icon Guidelines PDF. The topics addressed in these templates are Social Platforms Data Analysis, Sites Data Mining Icon. All the content presented in this PPT design is completely editable. Download it and make adjustments in color, background, font etc. as per your unique business setting.

Data Analysis On Excel 3d Chart Shows Interrelated Sets Of PowerPoint Templates
Put Them On The Same Page With Our data analysis on excel 3d chart shows interrelated sets of Powerpoint Templates . Your Team Will Sing From The Same Sheet.
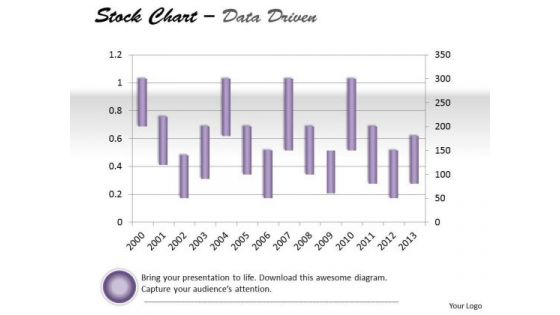
Data Analysis On Excel Driven Stock Chart For Market History PowerPoint Slides Templates
Draw Out The Best In You With Our data analysis on excel driven stock chart for market history powerpoint slides Templates . Let Your Inner Brilliance Come To The Surface.

Examples Of Data Analysis Market Driven Present In Scatter Chart PowerPoint Slides Templates
Your Thoughts Will Take To Our examples of data analysis market driven present in scatter chart powerpoint slides Templates Like A Duck To Water. They Develop A Binding Affinity.
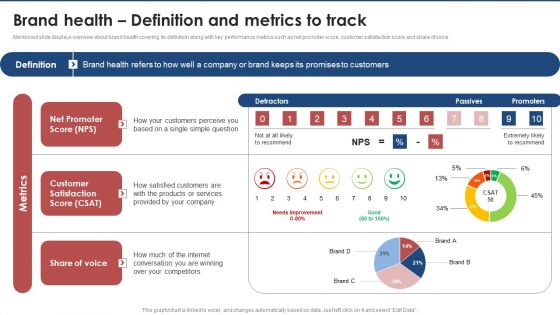
Brand Health Definition And Metrics To Track Brand Value Estimation Guide Mockup PDF
Following slide provides an overview about brand equity by covering its definition and key components such as brand loyalty, awareness, quality, association and experience.Present like a pro with Brand Health Definition And Metrics To Track Brand Value Estimation Guide Mockup PDF Create beautiful presentations together with your team, using our easy-to-use presentation slides. Share your ideas in real-time and make changes on the fly by downloading our templates. So whether you are in the office, on the go, or in a remote location, you can stay in sync with your team and present your ideas with confidence. With Slidegeeks presentation got a whole lot easier. Grab these presentations today.

Data Analysis Reports Under Magnifying Glass Ppt Powerpoint Presentation Summary Slideshow
This is a data analysis reports under magnifying glass ppt powerpoint presentation summary slideshow. This is a three stage process. The stages in this process are data visualization icon, data management icon.
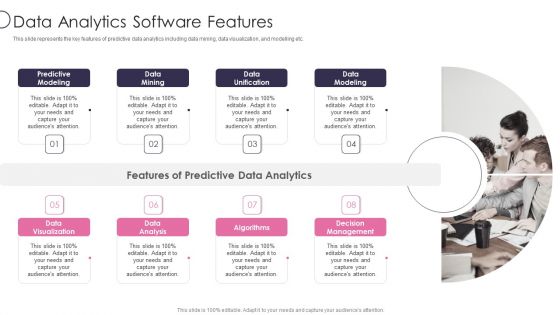
Information Transformation Process Toolkit Data Analytics Software Features Ideas PDF
This slide represents the key features of predictive data analytics including data mining, data visualization, and modelling etc. This is a Information Transformation Process Toolkit Data Analytics Software Features Ideas PDF template with various stages. Focus and dispense information on eight stages using this creative set, that comes with editable features. It contains large content boxes to add your information on topics like Algorithms, Decision Management, Data Analysis, Data Visualization. You can also showcase facts, figures, and other relevant content using this PPT layout. Grab it now.
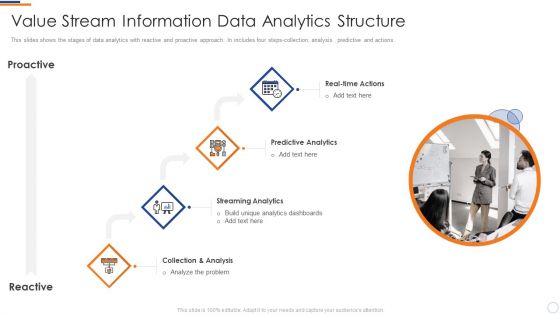
Business Intelligence And Big Value Stream Information Data Analytics Structure Formats PDF
This slides shows the stages of data analytics with reactive and proactive approach. In includes four steps-collection, analysis , predictive and actions. This is a business intelligence and big value stream information data analytics structure formats pdf template with various stages. Focus and dispense information on four stages using this creative set, that comes with editable features. It contains large content boxes to add your information on topics like real time actions, predictive analytics, streaming analytics, collection and analysis. You can also showcase facts, figures, and other relevant content using this PPT layout. Grab it now.
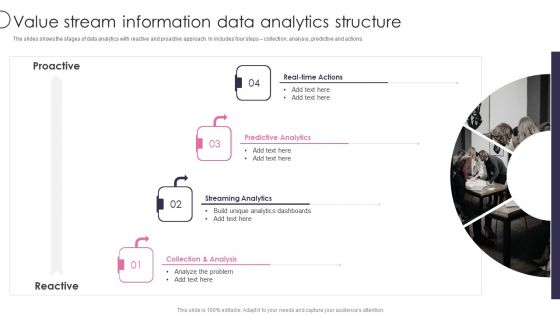
Information Transformation Process Toolkit Value Stream Information Data Analytics Structure Structure PDF
The slides shows the stages of data analytics with reactive and proactive approach. In includes four steps collection, analysis, predictive and actions. This is a Information Transformation Process Toolkit Value Stream Information Data Analytics Structure Structure PDF template with various stages. Focus and dispense information on four stages using this creative set, that comes with editable features. It contains large content boxes to add your information on topics like Predictive Analytics, Streaming Analytics, Collection And Analysis. You can also showcase facts, figures, and other relevant content using this PPT layout. Grab it now.

Data Mining Models For Medical Industry Ppt PowerPoint Presentation File Graphics PDF
This slide mentions the types of data mining models applicable to the medical healthcare industry. The two types include Predictive and Descriptive Analysis.Persuade your audience using this Data Mining Models For Medical Industry Ppt PowerPoint Presentation File Graphics PDF. This PPT design covers six stages, thus making it a great tool to use. It also caters to a variety of topics including Classification, Prediction, Trend Analysis . Download this PPT design now to present a convincing pitch that not only emphasizes the topic but also showcases your presentation skills.

Comparative Analysis Of Major Text Mining Structure Guidelines Pdf
This slide showcases the comparative analysis of text mining software which helps an organization to enable users to derive valuable insights from structured and unstructured data. It include details such as ratings, integrations, scalability, etc. Pitch your topic with ease and precision using this Comparative Analysis Of Major Text Mining Structure Guidelines Pdf. This layout presents information on Scalability, Reduce Drift, Predictive Data Analysis. It is also available for immediate download and adjustment. So, changes can be made in the color, design, graphics or any other component to create a unique layout.
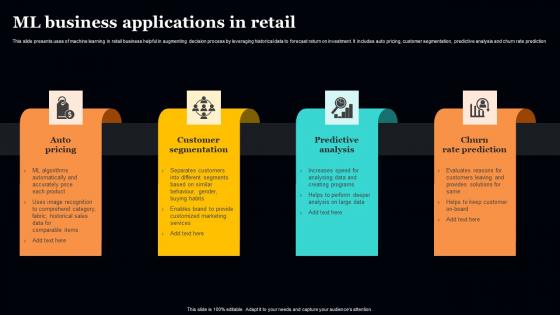
ML Business Applications In Retail Sample Pdf
This slide presents uses of machine learning in retail business helpful in augmenting decision process by leveraging historical data to forecast return on investment. It includes auto pricing, customer segmentation, predictive analysis and churn rate prediction. Pitch your topic with ease and precision using this ML Business Applications In Retail Sample Pdf. This layout presents information on Customer Segmentation, Churn Rate Prediction. It is also available for immediate download and adjustment. So, changes can be made in the color, design, graphics or any other component to create a unique layout.
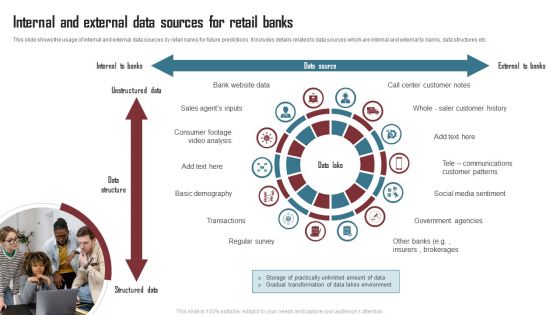
Internal And External Data Sources For Retail Banks Demonstration PDF
This slide shows the usage of internal and external data sources by retail banks for future predictions. It includes details related to data sources which are internal and external to banks, data structures etc. Showcasing this set of slides titled Internal And External Data Sources For Retail Banks Demonstration PDF. The topics addressed in these templates are Bank Website Data, Consumer Footage Video Analysis, Basic Demography. All the content presented in this PPT design is completely editable. Download it and make adjustments in color, background, font etc. as per your unique business setting.

Competitive Analysis Matrix Ppt PowerPoint Presentation Inspiration
This is a competitive analysis matrix ppt powerpoint presentation inspiration. This is a six stage process. The stages in this process are tables, benefits, data, analysis, marketing.

Design For Data Analysis And Strategy Planning Powerpoint Templates
This business slide has backdrop of chess game with six zigzag steps. You may download this slide for data analysis and strategy planning related topics. Illustrate your plans to your listeners with using this slide.

Business Diagram Four Magnifying Glasses With Pie For Data Analysis PowerPoint Slide
This business diagram displays graphic of pie charts in shape of magnifying glasses This business slide is suitable to present and compare business data. Use this diagram to build professional presentations for your viewers.

Business Diagram Four Pie Chart For Data Driven Result Analysis Of Business PowerPoint Slide
This business diagram displays graphic of pie charts in shape of flasks. This business slide is suitable to present and compare business data. Use this diagram to build professional presentations for your viewers.
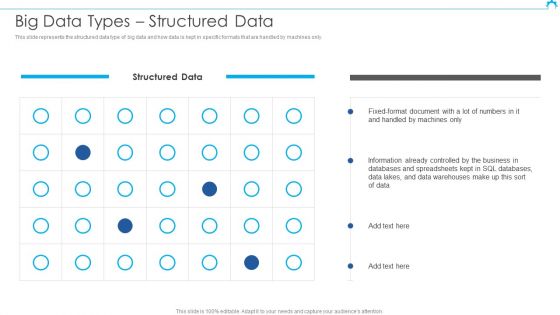
Big Data Architect Big Data Types Structured Data Infographics PDF
This slide represents the structured data type of big data and how data is kept in specific formats that are handled by machines only.Deliver an awe inspiring pitch with this creative Big Data Architect Big Data Types Structured Data Infographics PDF bundle. Topics like Already Controlled, Databases Spreadsheets, Data Warehouses can be discussed with this completely editable template. It is available for immediate download depending on the needs and requirements of the user.

Business Arrows PowerPoint Templates Business Data Mining Process Ppt Slides
Business Arrows PowerPoint Templates Business data mining process PPT Slides-Use this diagram to show Data Mining Process as a mechanism or group of parts performing one function or serving one purpose in a complex situation-Business Arrows PowerPoint Templates Business data mining process PPT Slides-This template can be used for presentations relating to Analysis, Anomaly, Artificial, Break, Clean, Computer, Cut, Data, Database, Decision, Detection, Discovery, Divide, Explore, Extract, Hammer, Helmet, Human, Index, Intelligence, Kdd, knowledge, Learning, Light, Mallet, Management, Mining, Model, Movement, Pattern, Predictive, Process, Records, Recycle, Repair, Safety, Science

Search Engine Marketing Evaluate And Forecast Ad Quality Score Pictures PDF
The following slide covers the ad quality score metrics to assess relevance of landing page. It includes key elements such as description, affecting factors, preference, impact strategies, calculation etc. Find a pre-designed and impeccable Search Engine Marketing Evaluate And Forecast Ad Quality Score Pictures PDF. The templates can ace your presentation without additional effort. You can download these easy-to-edit presentation templates to make your presentation stand out from others. So, what are you waiting for Download the template from Slidegeeks today and give a unique touch to your presentation.

Data Lineage Implementation Data Lineage And Data Provenance Download PDF
This slide represents the data lineage and data provenance that represents data flow at summary and detail levels. The components of both concepts include a file transfer protocol server, data staging area, data warehouse, master data, data marts, and so on. Do you have an important presentation coming up Are you looking for something that will make your presentation stand out from the rest Look no further than Data Lineage Implementation Data Lineage And Data Provenance Download PDF. With our professional designs, you can trust that your presentation will pop and make delivering it a smooth process. And with Slidegeeks, you can trust that your presentation will be unique and memorable. So why wait Grab Data Lineage Implementation Data Lineage And Data Provenance Download PDF today and make your presentation stand out from the rest.
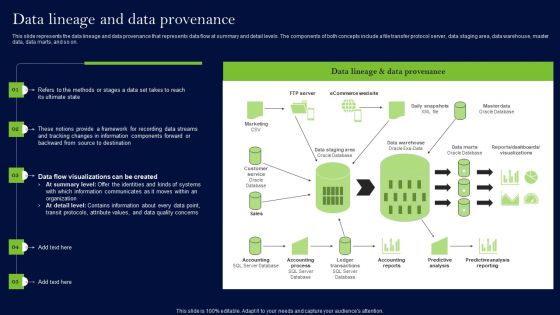
Data Lineage Methods Data Lineage And Data Provenance Download PDF
This slide represents the data lineage and data provenance that represents data flow at summary and detail levels. The components of both concepts include a file transfer protocol server, data staging area, data warehouse, master data, data marts, and so on. Are you searching for a Data Lineage Methods Data Lineage And Data Provenance Download PDF that is uncluttered, straightforward, and original Its easy to edit, and you can change the colors to suit your personal or business branding. For a presentation that expresses how much effort you have put in, this template is ideal With all of its features, including tables, diagrams, statistics, and lists, its perfect for a business plan presentation. Make your ideas more appealing with these professional slides. Download Data Lineage Methods Data Lineage And Data Provenance Download PDF from Slidegeeks today.
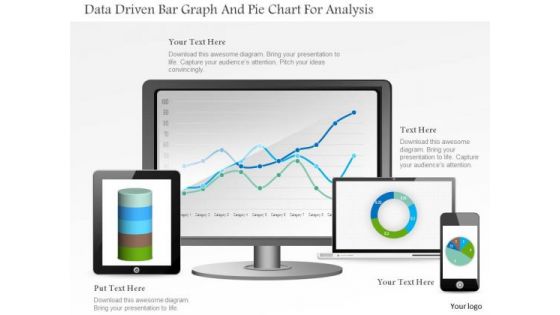
Business Diagram Data Driven Bar Graph And Pie Chart For Analysis PowerPoint Slide
This PowerPoint template displays technology gadgets with various business charts. Use this diagram slide, in your presentations to make business reports for statistical analysis. You may use this diagram to impart professional appearance to your presentations.

Program Budget Setting Approaches For Digital Terrorism Background PDF
This slide shows various approaches to set budget for security plans against cyber terrorism for preventing data fraudulent. It include approaches such as Reactive Approach, Proactive Approach, Benchmarking approach etc. Presenting Program Budget Setting Approaches For Digital Terrorism Background PDF to dispense important information. This template comprises four stages. It also presents valuable insights into the topics including Benchmarking Approach, Risk Based Approach, Proactive Approach. This is a completely customizable PowerPoint theme that can be put to use immediately. So, download it and address the topic impactfully.
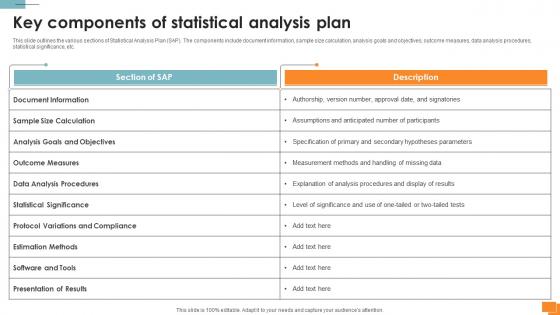
Statistical Tools For Evidence Key Components Of Statistical Analysis Plan
This slide outlines the various sections of Statistical Analysis Plan SAP. The components include document information, sample size calculation, analysis goals and objectives, outcome measures, data analysis procedures, statistical significance, etc. The Statistical Tools For Evidence Key Components Of Statistical Analysis Plan is a compilation of the most recent design trends as a series of slides. It is suitable for any subject or industry presentation, containing attractive visuals and photo spots for businesses to clearly express their messages. This template contains a variety of slides for the user to input data, such as structures to contrast two elements, bullet points, and slides for written information. Slidegeeks is prepared to create an impression.
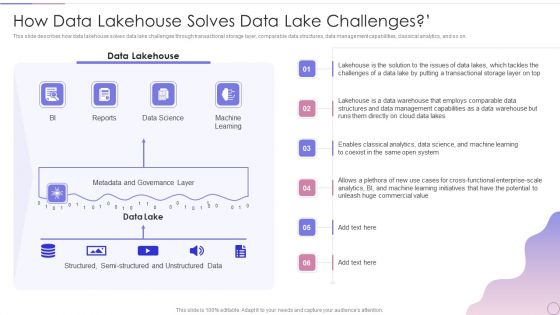
Data Lake Architecture Future Of Data Analysis How Data Lakehouse Solves Data Lake Challenges Demonstration PDF
This slide describes how data lakehouse solves data lake challenges through transactional storage layer, comparable data structures, data management capabilities, classical analytics, and so on.Deliver an awe inspiring pitch with this creative Data Lake Architecture Future Of Data Analysis How Data Lakehouse Solves Data Lake Challenges Demonstration PDF bundle. Topics like Metadata And Governance, Machine Learning, Structured And Unstructured can be discussed with this completely editable template. It is available for immediate download depending on the needs and requirements of the user.
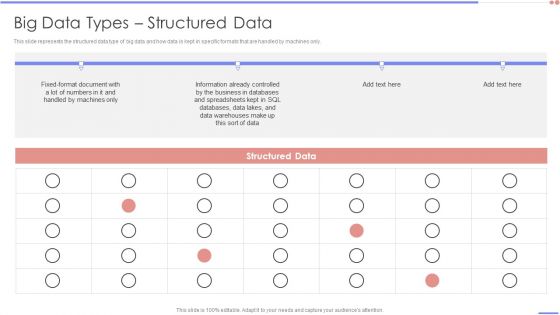
Data Analytics Management Big Data Types Structured Data Introduction PDF
This slide represents the structured data type of big data and how data is kept in specific formats that are handled by machines only.Deliver an awe inspiring pitch with this creative Data Analytics Management Big Data Types Structured Data Introduction PDF bundle. Topics like Handled By Machines, Information, Business Databases can be discussed with this completely editable template. It is available for immediate download depending on the needs and requirements of the user.
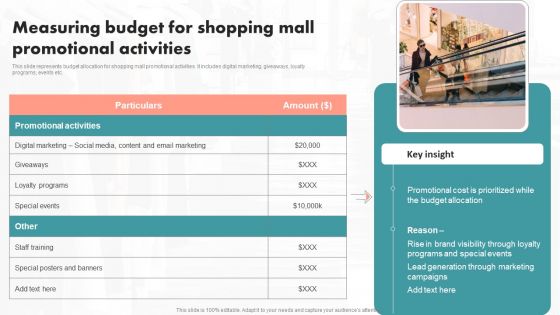
Measuring Budget For Shopping Mall Promotional Activities Ppt PowerPoint Presentation File Ideas PDF
This slide represents budget allocation for shopping mall promotional activities. It includes digital marketing, giveaways, loyalty programs, events etc. The Measuring Budget For Shopping Mall Promotional Activities Ppt PowerPoint Presentation File Ideas PDF is a compilation of the most recent design trends as a series of slides. It is suitable for any subject or industry presentation, containing attractive visuals and photo spots for businesses to clearly express their messages. This template contains a variety of slides for the user to input data, such as structures to contrast two elements, bullet points, and slides for written information. Slidegeeks is prepared to create an impression.
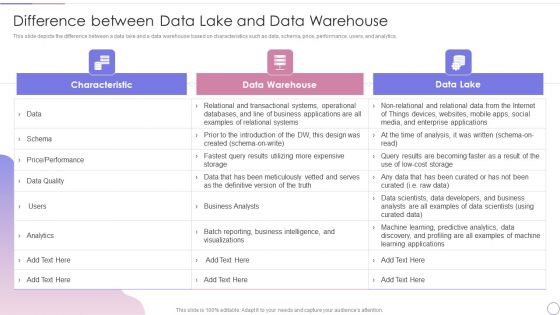
Data Lake Architecture Future Of Data Analysis Difference Between Data Lake And Data Warehouse Information PDF
This slide depicts the difference between a data lake and a data warehouse based on characteristics such as data, schema, price, performance, users, and analytics.Deliver an awe inspiring pitch with this creative Data Lake Architecture Future Of Data Analysis Difference Between Data Lake And Data Warehouse Information PDF bundle. Topics like Relational And Transactional, Systems Operational, Databases can be discussed with this completely editable template. It is available for immediate download depending on the needs and requirements of the user.
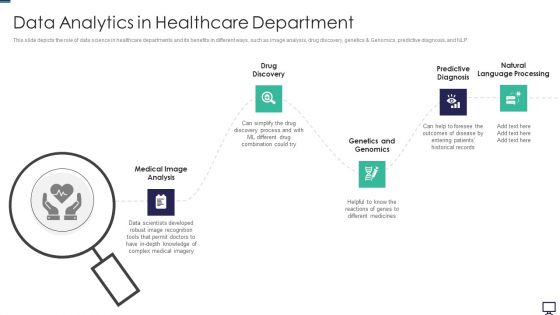
Data Analytics In Healthcare Department Ppt Outline Demonstration
This slide depicts the role of data science in healthcare departments and its benefits in different ways, such as image analysis, drug discovery, genetics and Genomics, predictive diagnosis, and NLP. Presenting data analytics in healthcare department ppt outline demonstration to provide visual cues and insights. Share and navigate important information on five stages that need your due attention. This template can be used to pitch topics like data analytics in healthcare department. In addtion, this PPT design contains high resolution images, graphics, etc, that are easily editable and available for immediate download.
Business Analysis Data Monitoring Vector Icon Ppt Powerpoint Presentation Ideas Design Ideas
This is a business analysis data monitoring vector icon ppt powerpoint presentation ideas design ideas. This is a one stage process. The stages in this process are feedback loop icon, evaluation icon, assessment icon.

 Home
Home