Project Kpi
Predictive Modeling Process Flow In Logistics Icons PDF
This slide showcases Predictive modeling which enables production and distribution optimization through better throughput, quality and safety. It provides details about historical data, predictive analytics model, forecast visualization, integrated custom analytics, etc. Get a simple yet stunning designed Predictive Modeling Process Flow In Logistics Icons PDF. It is the best one to establish the tone in your meetings. It is an excellent way to make your presentations highly effective. So, download this PPT today from Slidegeeks and see the positive impacts. Our easy-to-edit Predictive Modeling Process Flow In Logistics Icons PDF can be your go-to option for all upcoming conferences and meetings. So, what are you waiting for Grab this template today.
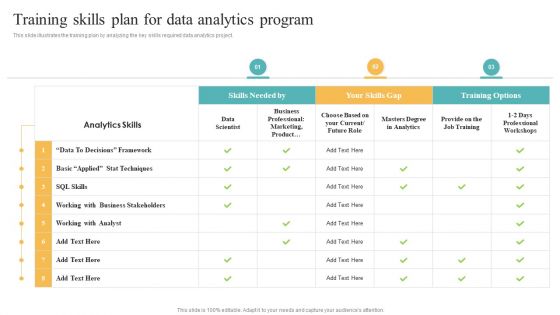
Transformation Toolkit Competitive Intelligence Information Analysis Training Skills Plan For Data Analytics Program Ideas PDF
This slide illustrates the training plan by analyzing the key skills required data analytics project. Get a simple yet stunning designed Transformation Toolkit Competitive Intelligence Information Analysis Training Skills Plan For Data Analytics Program Ideas PDF. It is the best one to establish the tone in your meetings. It is an excellent way to make your presentations highly effective. So, download this PPT today from Slidegeeks and see the positive impacts. Our easy to edit Transformation Toolkit Competitive Intelligence Information Analysis Training Skills Plan For Data Analytics Program Ideas PDF can be your go to option for all upcoming conferences and meetings. So, what are you waiting for Grab this template today.
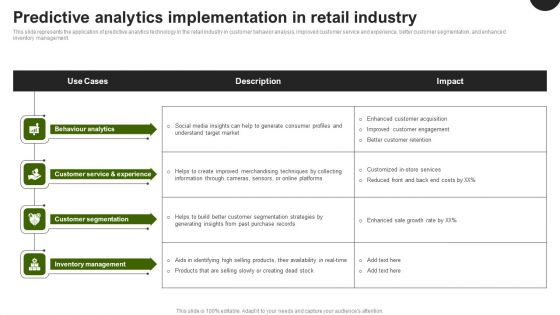
Predictive Analytics In The Age Of Big Data Predictive Analytics Implementation In Retail Industry Themes PDF
This slide represents the application of predictive analytics technology in the retail industry in customer behavior analysis, improved customer service and experience, better customer segmentation, and enhanced inventory management. Coming up with a presentation necessitates that the majority of the effort goes into the content and the message you intend to convey. The visuals of a PowerPoint presentation can only be effective if it supplements and supports the story that is being told. Keeping this in mind our experts created Predictive Analytics In The Age Of Big Data Predictive Analytics Implementation In Retail Industry Themes PDF to reduce the time that goes into designing the presentation. This way, you can concentrate on the message while our designers take care of providing you with the right template for the situation.

Predictive Analysis Value Chain Diagram Powerpoint Slide Themes
This is a predictive analysis value chain diagram powerpoint slide themes. This is a four stage process. The stages in this process are what is happening now, what is going happen in future, what happened why that happened, data, predictive analytics, reporting analysis, monitoring.
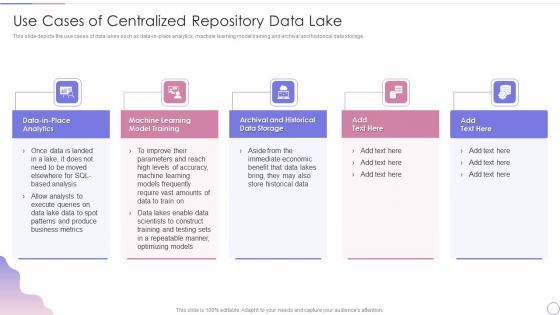
Data Lake Architecture Future Of Data Analysis Use Cases Of Centralized Repository Data Lake Template PDF
This slide depicts the use cases of data lakes such as data-in-place analytics, machine learning model training and archival and historical data storage.This is a Data Lake Architecture Future Of Data Analysis Use Cases Of Centralized Repository Data Lake Template PDF template with various stages. Focus and dispense information on five stages using this creative set, that comes with editable features. It contains large content boxes to add your information on topics like Archival And Historical, Patterns And Produce, Business Metrics. You can also showcase facts, figures, and other relevant content using this PPT layout. Grab it now.
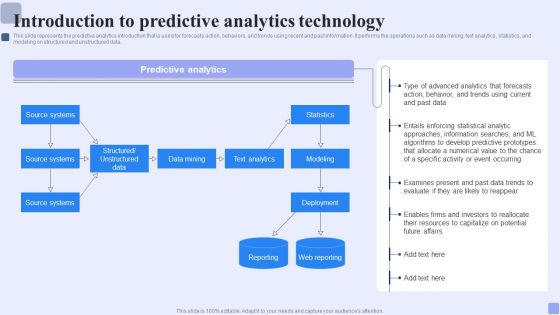
Introduction To Predictive Analytics Technology Forward Looking Analysis IT Structure PDF
This slide represents the predictive analytics introduction that is used for forecasts action, behaviors, and trends using recent and past information. It performs the operations such as data mining, text analytics, statistics, and modeling on structured and unstructured data.Get a simple yet stunning designed Introduction To Predictive Analytics Technology Forward Looking Analysis IT Structure PDF. It is the best one to establish the tone in your meetings. It is an excellent way to make your presentations highly effective. So, download this PPT today from Slidegeeks and see the positive impacts. Our easy-to-edit Introduction To Predictive Analytics Technology Forward Looking Analysis IT Structure PDF can be your go-to option for all upcoming conferences and meetings. So, what are you waiting for Grab this template today.
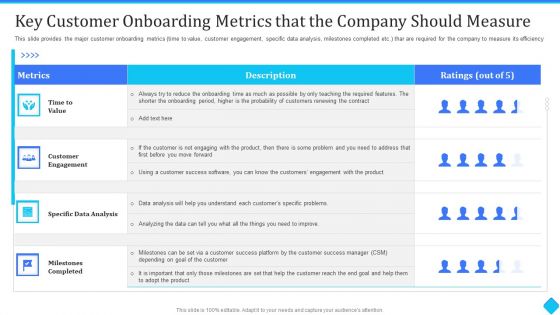
Key Customer Onboarding Metrics That The Company Should Measure Structure PDF
This slide provides the major customer onboarding metrics time to value, customer engagement, specific data analysis, milestones completed etc. thar are required for the company to measure its efficiency. Deliver an awe-inspiring pitch with this creative key customer onboarding metrics that the company should measure structure pdf bundle. Topics like time to value, customer engagement, specific data analysis can be discussed with this completely editable template. It is available for immediate download depending on the needs and requirements of the user.

Key Customer Onboarding Metrics That The Company Should Measure Infographics PDF
This slide provides the major customer onboarding metrics time to value, customer engagement, specific data analysis, milestones completed etc. thar are required for the company to measure its efficiency Deliver an awe inspiring pitch with this creative key customer onboarding metrics that the company should measure infographics pdf bundle. Topics like customer engagement, data analysis, customer success can be discussed with this completely editable template. It is available for immediate download depending on the needs and requirements of the user.

Supply Chain Management Operational Metrics Planning And Forecasting Graphics PDF
Presenting supply chain management operational metrics planning and forecasting graphics pdf. to provide visual cues and insights. Share and navigate important information on four stages that need your due attention. This template can be used to pitch topics like budget forecasting, demand forecasting, sales forecasting, production planning. In addtion, this PPT design contains high resolution images, graphics, etc, that are easily editable and available for immediate download.

Database Expansion And Optimization Team Structure For Data Management System Expansion Ppt Professional Example File
This slide represents the team structure for the data repository expansion project. It provides details regarding core and support team members in terms of job role and employee name. Deliver an awe inspiring pitch with this creative database expansion and optimization team structure for data management system expansion ppt professional example file bundle. Topics like analyst, technical, web designer, training, system administrator can be discussed with this completely editable template. It is available for immediate download depending on the needs and requirements of the user.
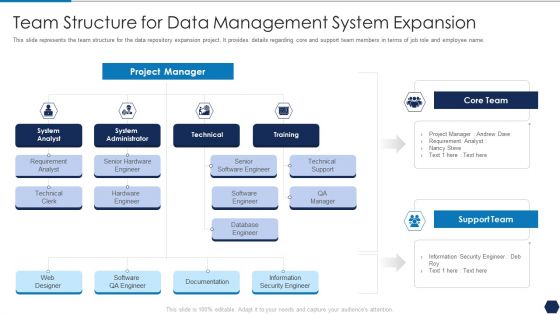
Tactical Plan For Upgrading DBMS Team Structure For Data Management System Expansion Template PDF
This slide represents the team structure for the data repository expansion project. It provides details regarding core and support team members in terms of job role and employee name. Deliver an awe inspiring pitch with this creative tactical plan for upgrading dbms team structure for data management system expansion template pdf bundle. Topics like analyst, technical, web designer, training, system administrator can be discussed with this completely editable template. It is available for immediate download depending on the needs and requirements of the user.
Horizontal Scaling Technique For Information Team Structure For Data Management System Expansion Icons PDF
This slide represents the team structure for the data repository expansion project. It provides details regarding core and support team members in terms of job role and employee name.Deliver and pitch your topic in the best possible manner with this Horizontal Scaling Technique For Information Team Structure For Data Management System Expansion Icons PDF Use them to share invaluable insights on Documentation Information, Security Engineer, Information Security Engineer and impress your audience. This template can be altered and modified as per your expectations. So, grab it now.
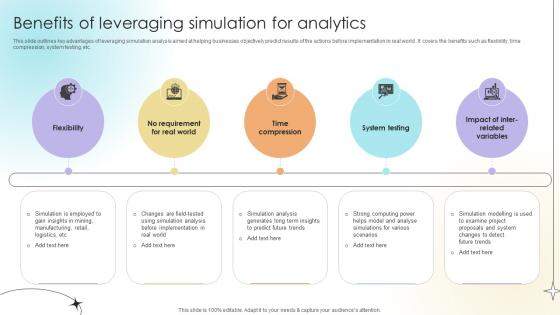
Benefits Of Leveraging Simulation For Analytics Data Analytics SS V
This slide outlines key advantages of leveraging simulation analysis aimed at helping businesses objectively predict results of the actions before implementation in real world . It covers the benefits such as flexibility, time compression, system testing, etc. This modern and well-arranged Benefits Of Leveraging Simulation For Analytics Data Analytics SS V provides lots of creative possibilities. It is very simple to customize and edit with the Powerpoint Software. Just drag and drop your pictures into the shapes. All facets of this template can be edited with Powerpoint, no extra software is necessary. Add your own material, put your images in the places assigned for them, adjust the colors, and then you can show your slides to the world, with an animated slide included.

Business Plan Review Dashboard With Task Details Sample PDF
The following slide showcases dashboard of plan review to track KPIs and other relevant details regarding business, department and projects. Key indicators covered are contracts, proposals, documents review, bid date, plan review, completion percentage and priority. Pitch your topic with ease and precision using this Business Plan Review Dashboard With Task Details Sample PDF. This layout presents information on Business Plan Review, Dashboard With Task Details. It is also available for immediate download and adjustment. So, changes can be made in the color, design, graphics or any other component to create a unique layout.
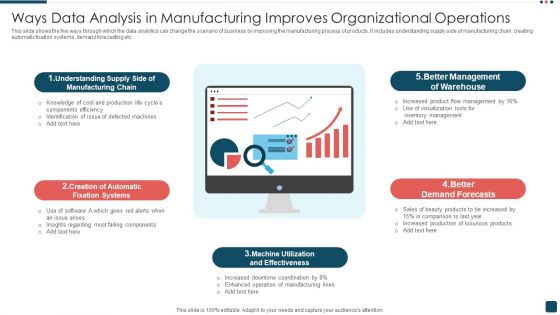
Ways Data Analysis In Manufacturing Improves Organizational Operations Formats PDF
This slide shows the five ways through which the data analytics can change the scenario of business by improving the manufacturing process of products. It includes understanding supply side of manufacturing chain, creating automatic fixation systems, demand forecasting etc. Persuade your audience using this Ways Data Analysis In Manufacturing Improves Organizational Operations Formats PDF. This PPT design covers five stages, thus making it a great tool to use. It also caters to a variety of topics including Manufacturing Chain, Better Management, Demand Forecasts. Download this PPT design now to present a convincing pitch that not only emphasizes the topic but also showcases your presentation skills.
Building Quality Inspection Dashboard With Customer Satisfaction Ratio Icons PDF
The following slide showcases dashboard of construction company exhibiting quality KPIs regarding safety, workmanship and customer satisfaction. Key indicators covered are site inspection success level, CSR, defect count, net promoter score, promotors, passives, defectors, total rework cost, safety meetings and average time taken to fix defects. Showcasing this set of slides titled Building Quality Inspection Dashboard With Customer Satisfaction Ratio Icons PDF. The topics addressed in these templates are Construction Project, Customer Satisfaction Ratio, Promoters. All the content presented in this PPT design is completely editable. Download it and make adjustments in color, background, font etc. as per your unique business setting.

Digital Marketing Campaign Performance Monitoring Dashboard Pictures PDF
This slide represents the dashboard for measuring and monitoring the performance of digital marketing campaign. It includes information related to the advertisement cost, cost per conversion, no. of clicks, conversion rate, impressions, cost per click, click through rate and cost per thousand impressions of the project.Pitch your topic with ease and precision using this Digital Marketing Campaign Performance Monitoring Dashboard Pictures PDF. This layout presents information on Conversion Rate, Per Conversion, Cost Per Thousand. It is also available for immediate download and adjustment. So, changes can be made in the color, design, graphics or any other component to create a unique layout.
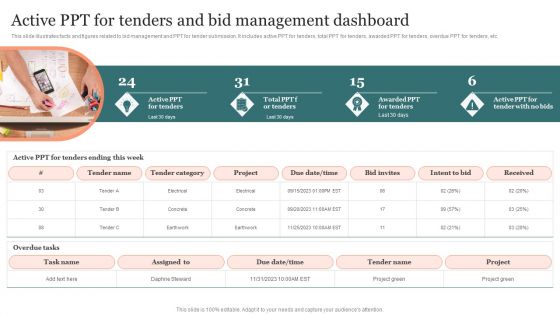
Active Ppt For Tenders And Bid Management Dashboard Microsoft PDF
This slide illustrates facts and figures related to bid management and PPT for tender submission. It includes active PPT for tenders, total PPT for tenders, awarded PPT for tenders, overdue PPT for tenders, etc. Presenting Active Ppt For Tenders And Bid Management Dashboard Microsoft PDF to dispense important information. This template comprises four stages. It also presents valuable insights into the topics including Project, Tender Name, Bid Invites. This is a completely customizable PowerPoint theme that can be put to use immediately. So, download it and address the topic impactfully.
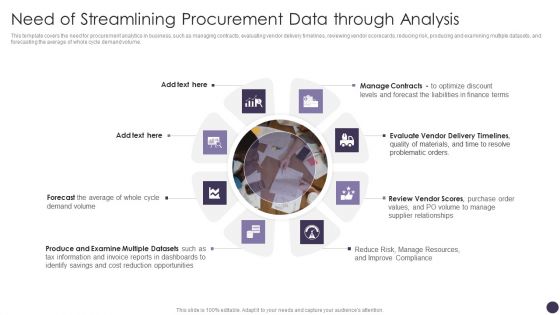
Need Of Streamlining Procurement Data Through Analysis Themes PDF
This template covers the need for procurement analytics in business, such as managing contracts, evaluating vendor delivery timelines, reviewing vendor scorecards, reducing risk, producing and examining multiple datasets, and forecasting the average of whole cycle demand volume. This is a Need Of Streamlining Procurement Data Through Analysis Themes PDF template with various stages. Focus and dispense information on eight stages using this creative set, that comes with editable features. It contains large content boxes to add your information on topics like Manage Contracts, Forecast The Liabilities, Problematic Orders. You can also showcase facts, figures, and other relevant content using this PPT layout. Grab it now.

Tasks Performed By Statistical Data Analytics For Informed Decision Ppt Presentation
This slide demonstrates the major activities involved in statistical analysis. These are offers insight into complex data, informs the decision-making process, assesses hypotheses, evaluates the efficacy of interventions and supports predictive modeling. Present like a pro with Tasks Performed By Statistical Data Analytics For Informed Decision Ppt Presentation. Create beautiful presentations together with your team, using our easy-to-use presentation slides. Share your ideas in real-time and make changes on the fly by downloading our templates. So whether you are in the office, on the go, or in a remote location, you can stay in sync with your team and present your ideas with confidence. With Slidegeeks presentation got a whole lot easier. Grab these presentations today.

BI Business Requirements With Feature Desired Details BI Transformation Toolset Slides PDF
This slide illustrates the requirement type and feature desired from the business intelligence project. It also provides information regarding the effect of specifications on business units and their associated activities. Presenting BI Business Requirements With Feature Desired Details BI Transformation Toolset Slides PDF to provide visual cues and insights. Share and navigate important information on four stages that need your due attention. This template can be used to pitch topics like Requirement, Applications Impacted, Business Units Affected, Metrices. In addtion, this PPT design contains high resolution images, graphics, etc, that are easily editable and available for immediate download.

Data Lake Architecture Future Of Data Analysis Why Use Centralized Repository Data Lake Formats PDF
This slide represents why organizations should use data lakes based on their features including business agility, beneficial forecasts, competitive edge, 360 degree perspective, and so on.This is a Data Lake Architecture Future Of Data Analysis Why Use Centralized Repository Data Lake Formats PDF template with various stages. Focus and dispense information on nine stages using this creative set, that comes with editable features. It contains large content boxes to add your information on topics like Outperform Competitors, Enterprises In Organic, Provides Competitive. You can also showcase facts, figures, and other relevant content using this PPT layout. Grab it now.

Key Components Of Business Structure Framework Ppt PowerPoint Presentation File Graphics PDF
Persuade your audience using this key components of business structure framework ppt powerpoint presentation file graphics pdf. This PPT design covers one stages, thus making it a great tool to use. It also caters to a variety of topics including stakeholders, policies, rules, regulations, capabilities, vision , strategies and tactics, organization, information, value streams, products and services, metrics and measures, decision and events, initiatives and projects, business architecture. Download this PPT design now to present a convincing pitch that not only emphasizes the topic but also showcases your presentation skills.
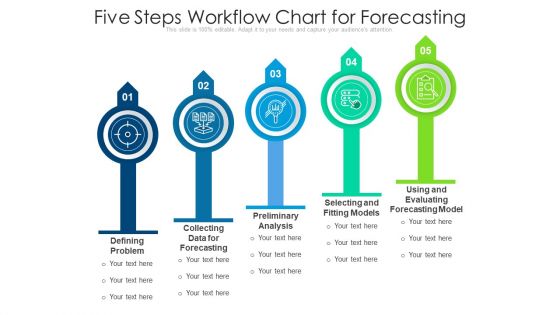
Five Steps Workflow Chart For Forecasting Ppt PowerPoint Presentation Outline Designs Download PDF
Presenting five steps workflow chart for forecasting ppt powerpoint presentation outline designs download pdf to dispense important information. This template comprises five stages. It also presents valuable insights into the topics including collecting data for forecasting, preliminary analysis, selecting and fitting models. This is a completely customizable PowerPoint theme that can be put to use immediately. So, download it and address the topic impactfully.
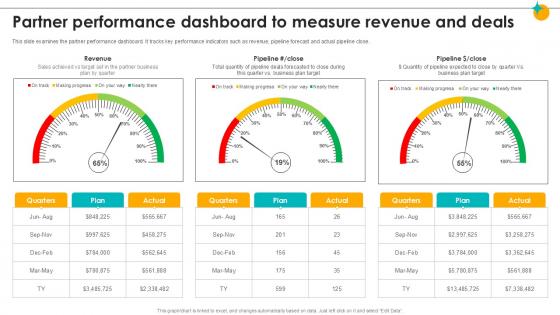
Partner Performance Dashboard To Measure Revenue Partner Relationship Ppt Template
This slide examines the partner performance dashboard. It tracks key performance indicators such as revenue, pipeline forecast and actual pipeline close. Are you in need of a template that can accommodate all of your creative concepts This one is crafted professionally and can be altered to fit any style. Use it with Google Slides or PowerPoint. Include striking photographs, symbols, depictions, and other visuals. Fill, move around, or remove text boxes as desired. Test out color palettes and font mixtures. Edit and save your work, or work with colleagues. Download Partner Performance Dashboard To Measure Revenue Partner Relationship Ppt Template and observe how to make your presentation outstanding. Give an impeccable presentation to your group and make your presentation unforgettable.

Business Intelligence And Big Data Analytics Program Checklist Demonstration PDF
This slide shows progress status of data analytics process which includes important key tasks that must be performed while initiating a project. This is a business intelligence and big data analytics program checklist demonstration pdf template with various stages. Focus and dispense information on one stages using this creative set, that comes with editable features. It contains large content boxes to add your information on topics like data collection, data analysis, statistical analysis, data modelling, data visualization. You can also showcase facts, figures, and other relevant content using this PPT layout. Grab it now.
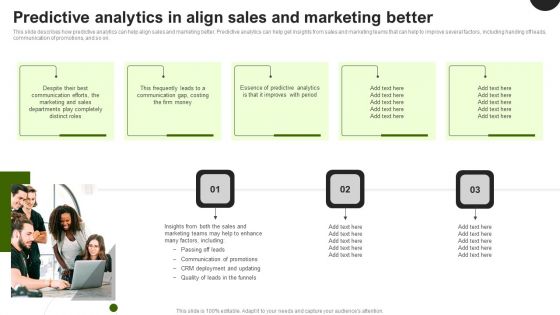
Predictive Analytics In The Age Of Big Data Predictive Analytics In Align Sales And Marketing Better Topics PDF
This slide describes how predictive analytics can help align sales and marketing better. Predictive analytics can help get insights from sales and marketing teams that can help to improve several factors, including handing off leads, communication of promotions, and so on. This modern and well arranged Predictive Analytics In The Age Of Big Data Predictive Analytics In Align Sales And Marketing Better Topics PDF provides lots of creative possibilities. It is very simple to customize and edit with the Powerpoint Software. Just drag and drop your pictures into the shapes. All facets of this template can be edited with Powerpoint no extra software is necessary. Add your own material, put your images in the places assigned for them, adjust the colors, and then you can show your slides to the world, with an animated slide included.
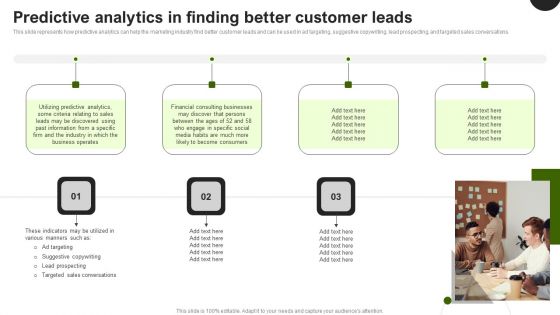
Predictive Analytics In The Age Of Big Data Predictive Analytics In Finding Better Customer Leads Diagrams PDF
This slide represents how predictive analytics can help the marketing industry find better customer leads and can be used in ad targeting, suggestive copywriting, lead prospecting, and targeted sales conversations. Welcome to our selection of the Predictive Analytics In The Age Of Big Data Predictive Analytics In Finding Better Customer Leads Diagrams PDF. These are designed to help you showcase your creativity and bring your sphere to life. Planning and Innovation are essential for any business that is just starting out. This collection contains the designs that you need for your everyday presentations. All of our PowerPoints are 100 percent editable, so you can customize them to suit your needs. This multi purpose template can be used in various situations. Grab these presentation templates today.

USA Healthcare Market Analysis Growth Prediction Trends Inspiration PDF
This slide shows growth in global market of health data analytics globally for medical research and development. It includes three different types of healthcare like descriptive analytics, predictive analytics, prescriptive analytics etc. Pitch your topic with ease and precision using this USA Healthcare Market Analysis Growth Prediction Trends Inspiration PDF. This layout presents information on USA Healthcare Market Analysis, Growth Prediction Trends. It is also available for immediate download and adjustment. So, changes can be made in the color, design, graphics or any other component to create a unique layout.
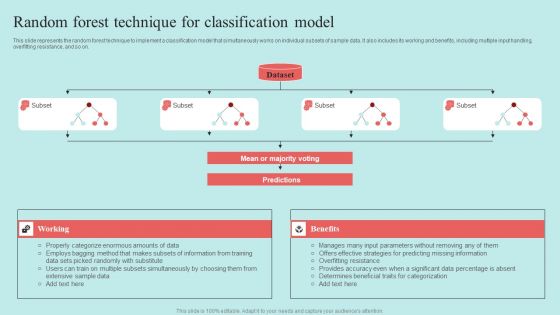
Predictive Data Model Random Forest Technique For Classification Model Download PDF

Marketing Success Metrics Key Elements Of Successful Marketing Analytics Portrait PDF
This slide covers three major components of effective market data analysis. It includes elements such as strategy to plan and run campaigns, analysis to collect and analyze relevant data, meaning to ensure data meets business goals. Boost your pitch with our creative Marketing Success Metrics Key Elements Of Successful Marketing Analytics Portrait PDF. Deliver an awe-inspiring pitch that will mesmerize everyone. Using these presentation templates you will surely catch everyones attention. You can browse the ppts collection on our website. We have researchers who are experts at creating the right content for the templates. So you dont have to invest time in any additional work. Just grab the template now and use them.
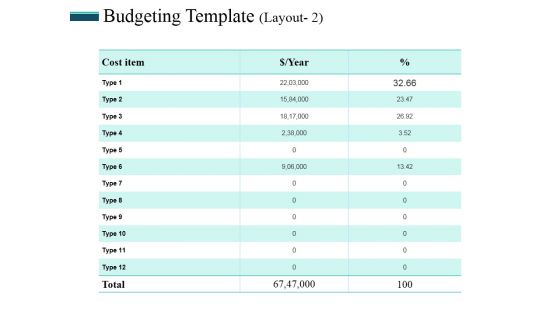
Budgeting Template 2 Ppt PowerPoint Presentation Portfolio Infographics
This is a budgeting template 2 ppt powerpoint presentation portfolio infographics. This is a three stage process. The stages in this process are table, cost, table, management, analysis.
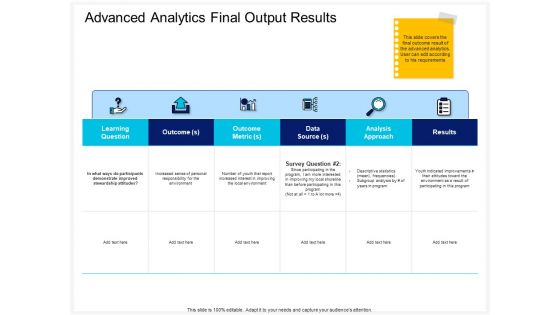
Enterprise Problem Solving And Intellect Advanced Analytics Final Output Results Metric Designs PDF
Presenting this set of slides with name enterprise problem solving and intellect advanced analytics final output results metric designs pdf. The topics discussed in these slides are learning question, outcome, outcome metric, data source analysis approach, results. This is a completely editable PowerPoint presentation and is available for immediate download. Download now and impress your audience.
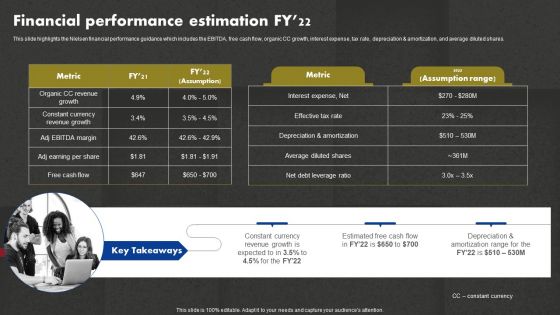
Data And Customer Analysis Company Outline Financial Performance Estimation FY22 Pictures PDF
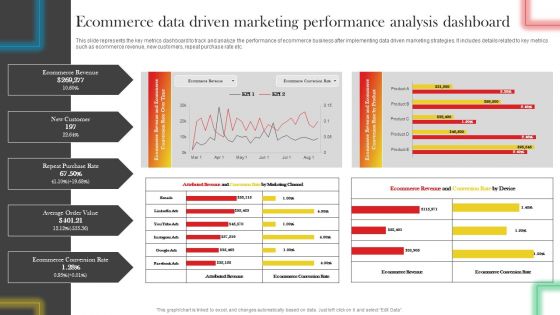
Ecommerce Data Driven Marketing Performance Analysis Dashboard Professional PDF
This slide represents the key metrics dashboard to track and analyze the performance of ecommerce business after implementing data driven marketing strategies. It includes details related to key metrics such as ecommerce revenue, new customers, repeat purchase rate etc. Get a simple yet stunning designed Ecommerce Data Driven Marketing Performance Analysis Dashboard Professional PDF. It is the best one to establish the tone in your meetings. It is an excellent way to make your presentations highly effective. So, download this PPT today from Slidegeeks and see the positive impacts. Our easy-to-edit Ecommerce Data Driven Marketing Performance Analysis Dashboard Professional PDF can be your go-to option for all upcoming conferences and meetings. So, what are you waiting for Grab this template today.
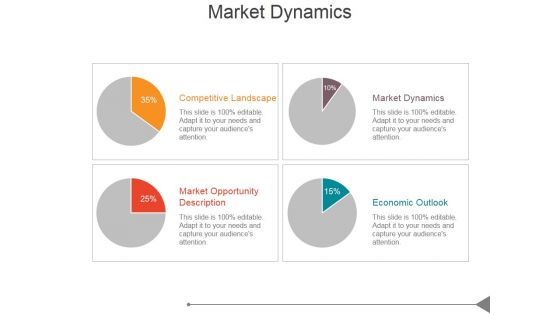
Market Dynamics Ppt PowerPoint Presentation Show
This is a market dynamics ppt powerpoint presentation show. This is a four stage process. The stages in this process are competitive landscape, market opportunity description, economic outlook, market dynamics.

Key Customer Onboarding Metrics That The Company Should Measure Ppt Professional Deck PDF
This slide provides the major customer onboarding metrics time to value, customer engagement, specific data analysis, milestones completed etc. thar are required for the company to measure its efficiency. Deliver an awe-inspiring pitch with this creative key customer onboarding metrics that the company should measure ppt professional deck pdf. bundle. Topics like time to value, customer engagement, specific data analysis, milestones completed can be discussed with this completely editable template. It is available for immediate download depending on the needs and requirements of the user.

IT Security Analysis To Prevent Insider Threats Infographics PDF
This slide covers the data on the security by using the technologies to protect the data from the insider threats. It includes the analysis with risk model, CWE, OWASP, SQL injection, misconfiguration, etc. Presenting IT Security Analysis To Prevent Insider Threats Infographics PDF to dispense important information. This template comprises nine stages. It also presents valuable insights into the topics including Security Project, Application, Risk Model. This is a completely customizable PowerPoint theme that can be put to use immediately. So, download it and address the topic impactfully.

IT Service Incorporation And Administration Customer Service Dashboard Addressing Inbound Leads Statistics Clipart PDF
This slide illustrates customer service dashboard covering informational stats about NPS score, growth rate, customer distribution, top customer locations, inbound leads and revenue by type. Deliver an awe inspiring pitch with this creative it service incorporation and administration customer service dashboard addressing inbound leads statistics clipart pdf bundle. Topics like standard customers, growth rate, net income vs projection, ca customer locations can be discussed with this completely editable template. It is available for immediate download depending on the needs and requirements of the user.

Scrum Dashboard With Key Release Management Kpis Ppt Summary Vector PDF
This slide illustrates graphical representation of scrum board for evidence based management of projects. It includes burn up status, story points status, workload division and results of testing. Showcasing this set of slides titled Scrum Dashboard With Key Release Management Kpis Ppt Summary Vector PDF. The topics addressed in these templates are Burn Up Chart, Workload Status Chart, Testing Results Status. All the content presented in this PPT design is completely editable. Download it and make adjustments in color, background, font etc. as per your unique business setting.

Key Performance Indicators Of Sales Coaching Program Ppt Styles Graphic Images PDF
The following slide highlights the key statistics of sales training program on overall business performance. It also includes three main elements namely retention, budget and impact. Presenting Key Performance Indicators Of Sales Coaching Program Ppt Styles Graphic Images PDF to dispense important information. This template comprises three stages. It also presents valuable insights into the topics including Retention, Budget, Impact, Employee. This is a completely customizable PowerPoint theme that can be put to use immediately. So, download it and address the topic impactfully.
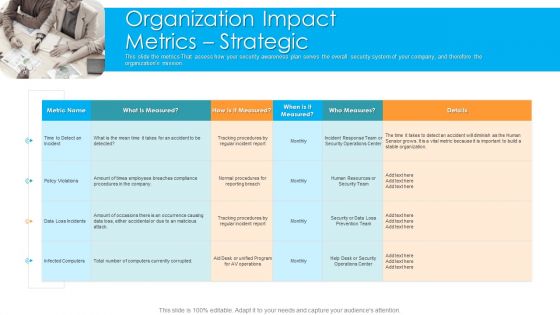
Organization Impact Metrics Strategic Hacking Prevention Awareness Training For IT Security Graphics PDF
This slide the metrics That assess how your security awareness plan serves the overall security system of your company, and therefore the organizations mission. Presenting organization impact metrics strategic hacking prevention awareness training for it security graphics pdf to provide visual cues and insights. Share and navigate important information on one stages that need your due attention. This template can be used to pitch topics like organization, policy violations, data loss incidents, human resources. In addtion, this PPT design contains high resolution images, graphics, etc, that are easily editable and available for immediate download.
Social Media Budget Template Ppt PowerPoint Presentation Icon Mockup
This is a social media budget template ppt powerpoint presentation icon mockup. This is a five stage process. The stages in this process are budget category, in house expense, outsource expense, total category.
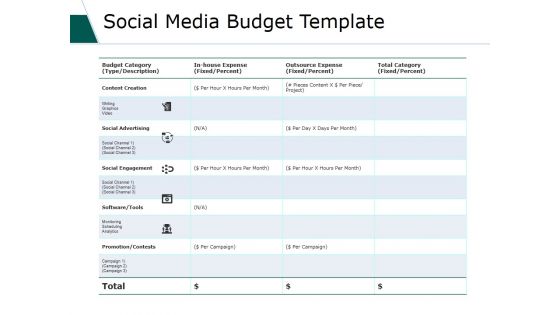
Social Media Budget Template Ppt PowerPoint Presentation Layouts Deck
This is a social media budget template ppt powerpoint presentation layouts deck. This is a four stage process. The stages in this process are budget category, writing, graphics, video, outsource expense, total category.
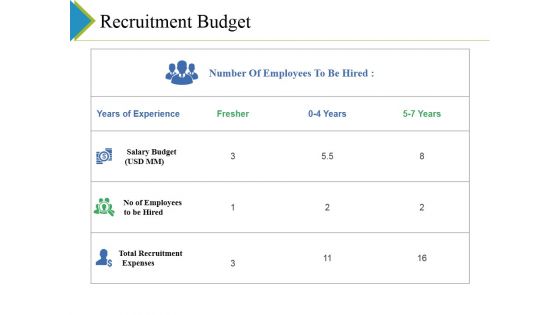
Recruitment Budget Ppt PowerPoint Presentation Infographic Template Brochure
This is a recruitment budget ppt powerpoint presentation infographic template brochure. This is a three stage process. The stages in this process are years of experience, fresher, salary budget, no of employees.
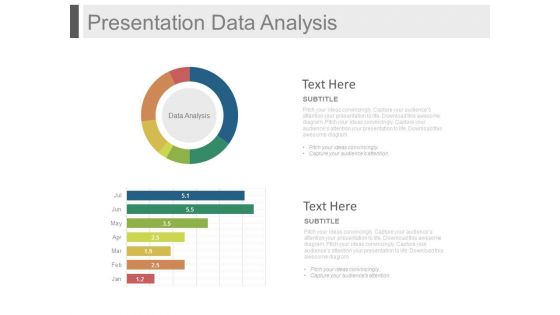
Presentation Data Analysis Ppt Slides
This is a presentation data analysis ppt slides. This is a two stage process. The stages in this process are business, finance, marketing.

Supply Chain Management Operational Metrics Demand Forecasting Slides PDF
Deliver and pitch your topic in the best possible manner with this supply chain management operational metrics demand forecasting slides pdf. Use them to share invaluable insights on demand forecasting and impress your audience. This template can be altered and modified as per your expectations. So, grab it now.

Supply Chain Management Operational Metrics Sales Forecasting Sales Formats PDF
Deliver an awe-inspiring pitch with this creative supply chain management operational metrics sales forecasting sales formats pdf. bundle. Topics like sales forecasting can be discussed with this completely editable template. It is available for immediate download depending on the needs and requirements of the user.

Supply Chain Management Operational Metrics Sales Forecasting Clipart PDF
Deliver and pitch your topic in the best possible manner with this supply chain management operational metrics sales forecasting clipart pdf. Use them to share invaluable insights on sales forecasting and impress your audience. This template can be altered and modified as per your expectations. So, grab it now.
Expenditure Assessment Icon For Budget Planning Topics PDF
Presenting Expenditure Assessment Icon For Budget Planning Topics PDF to dispense important information. This template comprises Four stages. It also presents valuable insights into the topics including Expenditure Assessment, Icon For Budget Planning. This is a completely customizable PowerPoint theme that can be put to use immediately. So, download it and address the topic impactfully.

Information Transformation Process Toolkit Data Analytics Business Case And Roadmap Professional PDF
This slide shows the business processes and key deliverables for developing the data analytics BI project. It starts with assessing and document the current state to identify priorities, analyze the process and ends at developing roadmap to achieve the outcomes. This is a Information Transformation Process Toolkit Data Analytics Business Case And Roadmap Professional PDF template with various stages. Focus and dispense information on five stages using this creative set, that comes with editable features. It contains large content boxes to add your information on topics like Identify Business Priorities, Analysis Of User Base, Process Analysis. You can also showcase facts, figures, and other relevant content using this PPT layout. Grab it now.
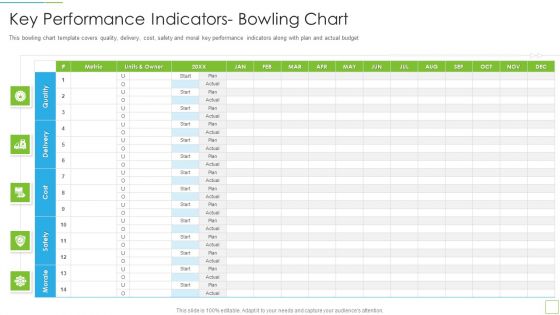
Hoshin Kanri Pitch Deck Key Performance Indicators Bowling Chart Introduction PDF
This bowling chart template covers quality, delivery, cost, safety and moral key performance indicators along with plan and actual budget Deliver an awe inspiring pitch with this creative hoshin kanri pitch deck key performance indicators bowling chart introduction pdf bundle. Topics like key performance indicators bowling chart can be discussed with this completely editable template. It is available for immediate download depending on the needs and requirements of the user.

Estimated Global Motor Vehicle Production By Type Global Automotive Manufacturing Market Analysis Information PDF
This slide covers a graphical representation of worldwide automobile manufacturing forecasts. It also includes key insights about as passenger cars, Chinese motorists, etc. The Estimated Global Motor Vehicle Production By Type Global Automotive Manufacturing Market Analysis Information PDF is a compilation of the most recent design trends as a series of slides. It is suitable for any subject or industry presentation, containing attractive visuals and photo spots for businesses to clearly express their messages. This template contains a variety of slides for the user to input data, such as structures to contrast two elements, bullet points, and slides for written information. Slidegeeks is prepared to create an impression.
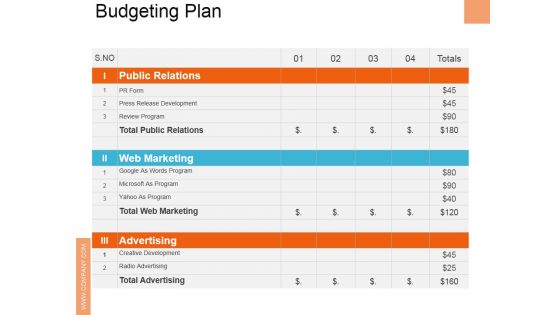
Budgeting Plan Ppt PowerPoint Presentation Show Slide Download
This is a budgeting plan ppt powerpoint presentation show slide download. This is a four stage process. The stages in this process are public relations, web marketing, advertising, press release development, review program.
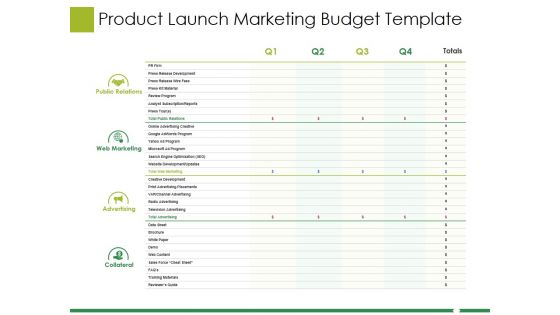
Product Launch Marketing Budget Template Ppt PowerPoint Presentation Pictures Objects
This is a product launch marketing budget template ppt powerpoint presentation pictures objects. This is a four stage process. The stages in this process are public relations, web marketing, advertising, collateral.
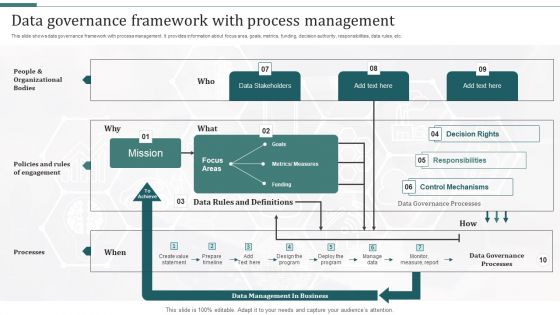
Data Governance Framework With Process Management Formats PDF
This slide shows data governance framework with process management. It provides information about focus area, goals, metrics, funding, decision authority, responsibilities, data rules, etc. Pitch your topic with ease and precision using this Data Governance Framework With Process Management Formats PDF. This layout presents information on Organizational Bodies, Measures, Metrics. It is also available for immediate download and adjustment. So, changes can be made in the color, design, graphics or any other component to create a unique layout.
Departmental Tracking Goals Progress Dashboard Diagrams PDF
This slide depicts a progress chart for maintaining transparency and alignment in tracking cross-functional goals. It also includes organizational objective details such as total on track objectives, recently updated, overall progress, etc. Showcasing this set of slides titled Departmental Tracking Goals Progress Dashboard Diagrams PDF. The topics addressed in these templates are Departmental Tracking Goals, Progress Dashboard . All the content presented in this PPT design is completely editable. Download it and make adjustments in color, background, font etc. as per your unique business setting.
Financial Forecast And Essential Metrics Icon Ppt Outline Display PDF
Persuade your audience using this Financial Forecast And Essential Metrics Icon Ppt Outline Display PDF. This PPT design covers three stages, thus making it a great tool to use. It also caters to a variety of topics including Financial Forecast, Essential Metrics, Icon. Download this PPT design now to present a convincing pitch that not only emphasizes the topic but also showcases your presentation skills.
Data Lake Architecture Future Of Data Analysis Overview Of Cloud Based Data Professional PDF
Deliver an awe inspiring pitch with this creative Data Lake Architecture Future Of Data Analysis Overview Of Cloud Based Data Professional PDF bundle. Topics like Lake Challenges, Predicting Requirements, Cost Savings can be discussed with this completely editable template. It is available for immediate download depending on the needs and requirements of the user.

Real Estate Business Sales Pipeline With Performance Indicators Background PDF
This slide showcases a sales funnel for real estate company to generate and acquire leads and maximize business profitability. It includes key components such as lead enters funnel, lead qualification, newsletter signup, schedule showing, negotiation, close, real estate deal won, etc. Presenting Real Estate Business Sales Pipeline With Performance Indicators Background PDF to dispense important information. This template comprises eight stages. It also presents valuable insights into the topics including Budget Preference, Newsletter Signup, Real Estate Deal Won. This is a completely customizable PowerPoint theme that can be put to use immediately. So, download it and address the topic impactfully.

 Home
Home