Project Kpi

Evaluation Criteria Of New Product Development Process New Product Portfolio Management Clipart PDF
Presenting this set of slides with name evaluation criteria of new product development process new product portfolio management clipart pdf. This is a four stage process. The stages in this process are project, discovery, basis interest, development, commercialization. This is a completely editable PowerPoint presentation and is available for immediate download. Download now and impress your audience.

Consumer Segmentation Dashboard For Business Intelligence Reporting Topics Pdf
This slide presents a customer segmentation dashboard for reporting real time data. It includes key components such as delighted NPS score, standard customers, growth rate, CA customer location, net income vs. projection, customer distribution, etc. Pitch your topic with ease and precision using this Consumer Segmentation Dashboard For Business Intelligence Reporting Topics Pdf. This layout presents information on Consumer Segmentation Dashboard, Business Intelligence Reporting, Growth Rate. It is also available for immediate download and adjustment. So, changes can be made in the color, design, graphics or any other component to create a unique layout.
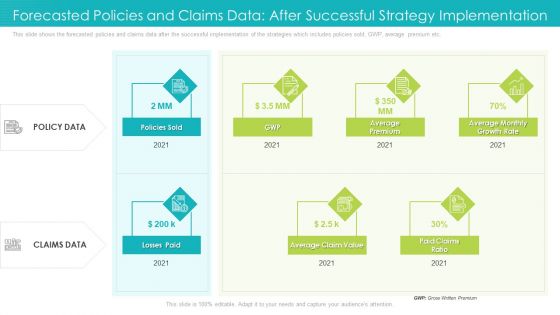
Forecasted Policies And Claims Data After Successful Strategy Implementation Ppt Model Introduction PDF
This slide shows the forecasted policies and claims data after the successful implementation of the strategies which includes policies sold, GWP, average premium etc. This is a forecasted policies and claims data after successful strategy implementation ppt model introduction pdf template with various stages. Focus and dispense information on two stages using this creative set, that comes with editable features. It contains large content boxes to add your information on topics like average premium, paid claims ratio, 2021. You can also showcase facts, figures, and other relevant content using this PPT layout. Grab it now.
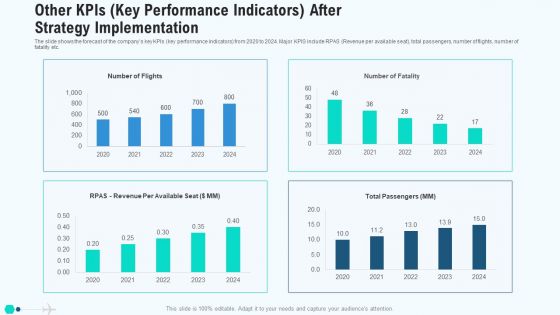
Other Kpis Key Performance Indicators After Strategy Implementation Mockup PDF
The slide shows the forecast of the companys key KPIs key performance indicators from 2020 to 2024. Major KPIS include RPAS Revenue per available seat, total passengers, number of flights, number of fatality etc. Deliver and pitch your topic in the best possible manner with this other kpis key performance indicators after strategy implementation mockup pdf. Use them to share invaluable insights on other kpis key performance indicators after strategy implementation and impress your audience. This template can be altered and modified as per your expectations. So, grab it now.
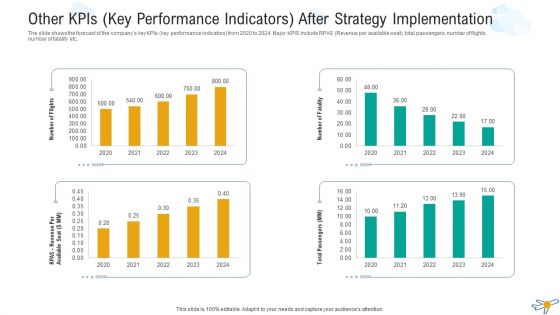
Other Kpis Key Performance Indicators After Strategy Implementation Microsoft PDF
The slide shows the forecast of the companys key KPIs key performance indicators from 2020 to 2024. Major KPIS include RPAS Revenue per available seat, total passengers, number of flights, number of fatality etc. Deliver and pitch your topic in the best possible manner with this other kpis key performance indicators after strategy implementation microsoft pdf. Use them to share invaluable insights on other kpis key performance indicators after strategy implementation and impress your audience. This template can be altered and modified as per your expectations. So, grab it now.
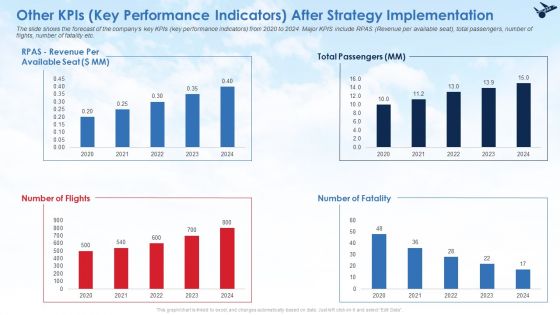
Other Kpis Key Performance Indicators After Strategy Implementation Infographics PDF
The slide shows the forecast of the companys key KPIs key performance indicators from 2020 to 2024. Major KPIS include RPAS Revenue per available seat, total passengers, number of flights, number of fatality etc. Deliver and pitch your topic in the best possible manner with this other kpis key performance indicators after strategy implementation infographics pdf. Use them to share invaluable insights on other kpis key performance indicators after strategy implementation and impress your audience. This template can be altered and modified as per your expectations. So, grab it now.
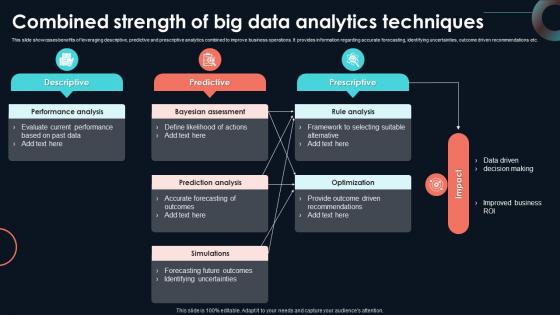
Combined Strength Of Big Data Analytics Developing Strategic Insights Using Big Data Analytics SS V
This slide showcases benefits of leveraging descriptive, predictive and prescriptive analytics combined to improve business operations. It provides information regarding accurate forecasting, identifying uncertainties, outcome driven recommendations etc. Formulating a presentation can take up a lot of effort and time, so the content and message should always be the primary focus. The visuals of the PowerPoint can enhance the presenters message, so our Combined Strength Of Big Data Analytics Developing Strategic Insights Using Big Data Analytics SS V was created to help save time. Instead of worrying about the design, the presenter can concentrate on the message while our designers work on creating the ideal templates for whatever situation is needed. Slidegeeks has experts for everything from amazing designs to valuable content, we have put everything into Combined Strength Of Big Data Analytics Developing Strategic Insights Using Big Data Analytics SS V
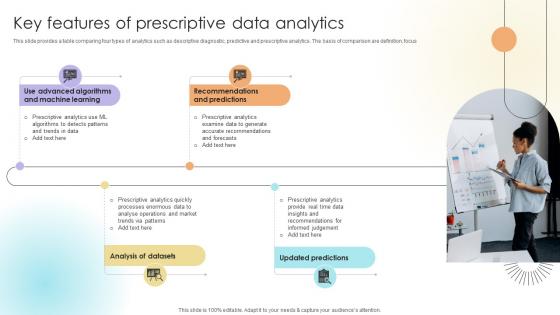
Key Features Of Prescriptive Data Analytics Data Analytics SS V
This slide provides a table comparing four types of analytics such as descriptive diagnostic, predictive and prescriptive analytics. The basis of comparison are definition, focus.Present like a pro with Key Features Of Prescriptive Data Analytics Data Analytics SS V. Create beautiful presentations together with your team, using our easy-to-use presentation slides. Share your ideas in real-time and make changes on the fly by downloading our templates. So whether you are in the office, on the go, or in a remote location, you can stay in sync with your team and present your ideas with confidence. With Slidegeeks presentation got a whole lot easier. Grab these presentations today.

Other Kpis Key Performance Indicators After Strategy Implementation Professional PDF
The slide shows the forecast of the companys key KPIs key performance indicators from 2020 to 2024. Major KPIS include RPAS Revenue per available seat, total passengers, number of flights, number of fatality etc.Deliver and pitch your topic in the best possible manner with this other KPIs key performance indicators after strategy implementation professional pdf. Use them to share invaluable insights on total passengers, number of flights, 2020 to 2024 and impress your audience. This template can be altered and modified as per your expectations. So, grab it now.

Latest Trends Of Real Time Big Data Analytics Ppt Infographic Template Smartart Pdf
The following slide highlights latest patterns of real time big data analytics. It includes various trends such as artificial intelligence, cloud adoption, edge computing, predictive analysis and natural language processing. Showcasing this set of slides titled Latest Trends Of Real Time Big Data Analytics Ppt Infographic Template Smartart Pdf. The topics addressed in these templates are Edge Computing, Predictive Analysis, Natural Language Processing. All the content presented in this PPT design is completely editable. Download it and make adjustments in color, background, font etc. as per your unique business setting.

Predictive Analytics In The Age Of Big Data Uses Of Predictive Analytics Credit Ideas PDF
This slide describes the usage of predictive analytics in banking and other financial institutions for credit purposes. It is used to calculate the credit score of a person or organization and to ensure that borrower doesnot fail to return the loan. Present like a pro with Predictive Analytics In The Age Of Big Data Uses Of Predictive Analytics Credit Ideas PDF Create beautiful presentations together with your team, using our easy to use presentation slides. Share your ideas in real time and make changes on the fly by downloading our templates. So whether you are in the office, on the go, or in a remote location, you can stay in sync with your team and present your ideas with confidence. With Slidegeeks presentation got a whole lot easier. Grab these presentations today.

Effective Inventory Forecasting To Meet Customer Demands Ideas PDF
This slide presents an overview of inventory forecasting. It details methods for forecasting demand, such as time series forecasting, seasonal forecasting, trend analysis and demand forecasting software. The Effective Inventory Forecasting To Meet Customer Demands Ideas PDF is a compilation of the most recent design trends as a series of slides. It is suitable for any subject or industry presentation, containing attractive visuals and photo spots for businesses to clearly express their messages. This template contains a variety of slides for the user to input data, such as structures to contrast two elements, bullet points, and slides for written information. Slidegeeks is prepared to create an impression.
Change Requests Tracking Metrics For Company Microsoft PDF
This slide displays dashboard to monitor change requests count assigned and completed for the organization. It includes key components such as models, owners, over time progress, etc Showcasing this set of slides titled Change Requests Tracking Metrics For Company Microsoft PDF The topics addressed in these templates are Departments, Model Owners, Requests. All the content presented in this PPT design is completely editable. Download it and make adjustments in color, background, font etc. as per your unique business setting.

Overview Data Driven And Analytics Model DT SS V
This slide help gain an understanding of data-driven and analytics business model with its impact on businesses. It also mentions other types of data-driven business such as automation, analysis, decision support, analytics, metrics, benchmarking, reporting, market research, optimization and experiments.Explore a selection of the finest Overview Data Driven And Analytics Model DT SS V here. With a plethora of professionally designed and pre-made slide templates, you can quickly and easily find the right one for your upcoming presentation. You can use our Overview Data Driven And Analytics Model DT SS V to effectively convey your message to a wider audience. Slidegeeks has done a lot of research before preparing these presentation templates. The content can be personalized and the slides are highly editable. Grab templates today from Slidegeeks.
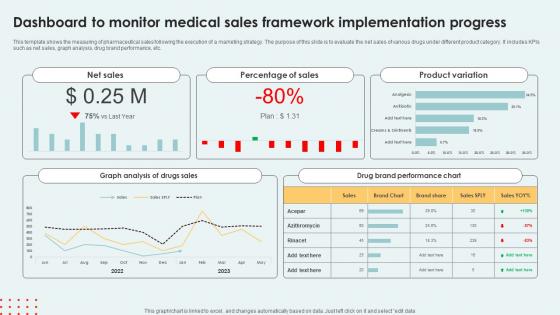
Dashboard To Monitor Medical Sales Framework Implementation Progress Formats Pdf
This template shows the measuring of pharmaceutical sales following the execution of a marketing strategy. The purpose of this slide is to evaluate the net sales of various drugs under different product category. It includes KPIs such as net sales, graph analysis, drug brand performance, etc. Showcasing this set of slides titled Dashboard To Monitor Medical Sales Framework Implementation Progress Formats Pdf The topics addressed in these templates are Percentage Sales, Product Variation, Brand Performance Chart All the content presented in this PPT design is completely editable. Download it and make adjustments in color, background, font etc. as per your unique business setting.

Key Components Of Statistical Data Analytics For Informed Decision Ppt Example
This slide outlines the various sections of Statistical Analysis Plan SAP. The components include document information, sample size calculation, analysis goals and objectives, outcome measures, data analysis procedures, statistical significance, etc. This Key Components Of Statistical Data Analytics For Informed Decision Ppt Example is perfect for any presentation, be it in front of clients or colleagues. It is a versatile and stylish solution for organizing your meetings. The Key Components Of Statistical Data Analytics For Informed Decision Ppt Example features a modern design for your presentation meetings. The adjustable and customizable slides provide unlimited possibilities for acing up your presentation. Slidegeeks has done all the homework before launching the product for you. So, do not wait, grab the presentation templates today
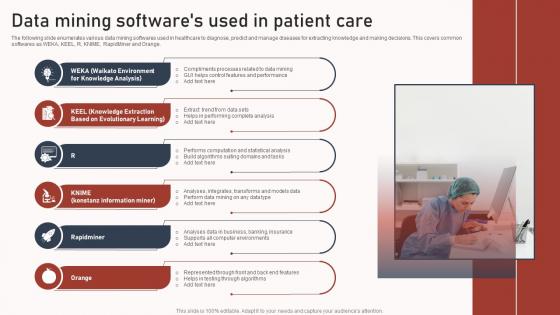
Data Mining Softwares Used In Patient Care Graphics Pdf
The following slide enumerates various data mining softwares used in healthcare to diagnose, predict and manage diseases for extracting knowledge and making decisions. This covers common softwares as WEKA, KEEL, R, KNIME, RapidMiner and Orange. Pitch your topic with ease and precision using this Data Mining Softwares Used In Patient Care Graphics Pdf. This layout presents information on Compliments Processes, Extract Trend, Performs Computation. It is also available for immediate download and adjustment. So, changes can be made in the color, design, graphics or any other component to create a unique layout.

Six Steps Of Business Predictive Analysis Process Ppt Gallery Graphics Template PDF
The following slide highlights the six steps of business forecasting process illustrating key headings which includes problem identification, information collection, preliminary analysis, forecasting model, data analysis and performance review. Persuade your audience using this six steps of business predictive analysis process ppt gallery graphics template pdf. This PPT design covers six stages, thus making it a great tool to use. It also caters to a variety of topics including problem identification, preliminary analysis, data analysis, information collection, forecasting model, performance review. Download this PPT design now to present a convincing pitch that not only emphasizes the topic but also showcases your presentation skills.
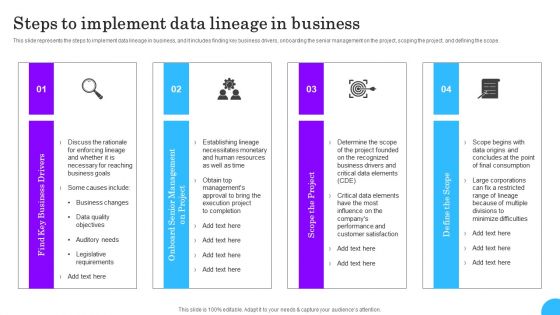
Comprehensive Analysis Of Different Data Lineage Classification Steps To Implement Data Lineage Designs PDF
This slide represents the steps to implement data lineage in business, and it includes finding key business drivers, onboarding the senior management on the project, scoping the project, and defining the scope. Find highly impressive Comprehensive Analysis Of Different Data Lineage Classification Steps To Implement Data Lineage Designs PDF on Slidegeeks to deliver a meaningful presentation. You can save an ample amount of time using these presentation templates. No need to worry to prepare everything from scratch because Slidegeeks experts have already done a huge research and work for you. You need to download Comprehensive Analysis Of Different Data Lineage Classification Steps To Implement Data Lineage Designs PDF for your upcoming presentation. All the presentation templates are 100 percent editable and you can change the color and personalize the content accordingly. Download now
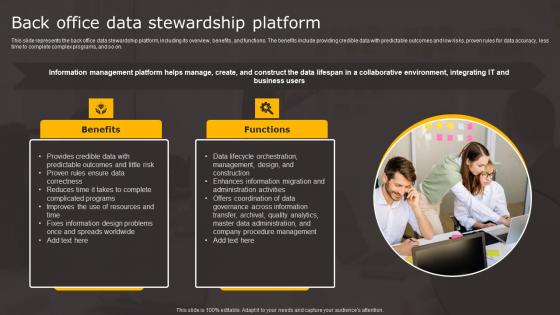
Data Stewardship In Business Processes Back Office Data Stewardship Portrait Pdf
This slide represents the back office data stewardship platform, including its overview, benefits, and functions. The benefits include providing credible data with predictable outcomes and low risks, proven rules for data accuracy, less time to complete complex programs, and so on. Coming up with a presentation necessitates that the majority of the effort goes into the content and the message you intend to convey. The visuals of a PowerPoint presentation can only be effective if it supplements and supports the story that is being told. Keeping this in mind our experts created Data Stewardship In Business Processes Back Office Data Stewardship Portrait Pdf to reduce the time that goes into designing the presentation. This way, you can concentrate on the message while our designers take care of providing you with the right template for the situation.

Organization Compliance Metrics Hacking Prevention Awareness Training For IT Security Inspiration PDF
This slide covers the metrics that measure what you are doing with the awareness project, exactly how you will train and how. Such metrics are of particular importance for purposes of compliance and monitoring. Deliver and pitch your topic in the best possible manner with this organization compliance metrics hacking prevention awareness training for it security inspiration pdf. Use them to share invaluable insights on training completion, communication methods, policy sign off and impress your audience. This template can be altered and modified as per your expectations. So, grab it now.
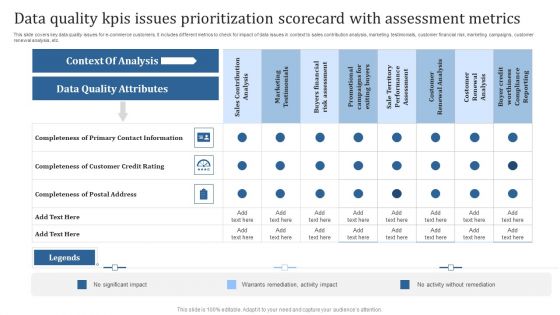
Data Quality Kpis Issues Prioritization Scorecard With Assessment Metrics Ideas PDF
This slide covers key data quality issues for e-commerce customers. It includes different metrics to check for impact of data issues in context to sales contribution analysis, marketing testimonials, customer financial risk, marketing campaigns, customer renewal analysis, etc. Showcasing this set of slides titled Data Quality Kpis Issues Prioritization Scorecard With Assessment Metrics Ideas PDF. The topics addressed in these templates are Context Of Analysis, Data Quality Attributes. All the content presented in this PPT design is completely editable. Download it and make adjustments in color, background, font etc. as per your unique business setting.
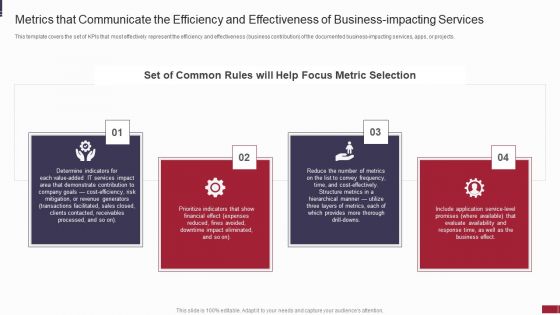
IT Value Story Significant To Corporate Leadership Metrics That Communicate The Efficiency Background PDF
This template covers the set of KPIs that most effectively represent the efficiency and effectiveness business contribution of the documented business-impacting services, apps, or projects. Presenting it value story significant to corporate leadership metrics that communicate the efficiency background pdf to provide visual cues and insights. Share and navigate important information on four stages that need your due attention. This template can be used to pitch topics like determine, financial, expenses, metrics. In addtion, this PPT design contains high resolution images, graphics, etc, that are easily editable and available for immediate download.

Collection Of Quality Assurance PPT Data Quality Management Metrics Information PDF
Mentioned slide displays customer data quality management dashboard with metrics namely consistency, accuracy, completeness, auditability, orderliness, uniqueness and timeliness. This is a collection of quality assurance ppt data quality management metrics information pdf template with various stages. Focus and dispense information on eight stages using this creative set, that comes with editable features. It contains large content boxes to add your information on topics like accuracy, auditability, consistency, completeness, uniqueness. You can also showcase facts, figures, and other relevant content using this PPT layout. Grab it now.

Predictive Analytics Methods Predictive Analytics Models For Predictive Problems Graphics PDF
This slide depicts the overview of predictive analytics models, including the predictive problems they solve, such as binary results, number prediction, detecting odd behavior, and so on. The models include classification, forecasting, anomaly, cluster, and time series. The Predictive Analytics Methods Predictive Analytics Models For Predictive Problems Graphics PDF is a compilation of the most recent design trends as a series of slides. It is suitable for any subject or industry presentation, containing attractive visuals and photo spots for businesses to clearly express their messages. This template contains a variety of slides for the user to input data, such as structures to contrast two elements, bullet points, and slides for written information. Slidegeeks is prepared to create an impression.

Call Center Process Key Performance Indicator Dashboard Mockup PDF
This slide showcases call center process measurements and key performance indicators so managers and teams can keep track of and improve performance . It includes received calls, calculating speed of answering calls , ended calls before starting conversations , average calls per minute etc. Showcasing this set of slides titled Call Center Process Key Performance Indicator Dashboard Mockup PDF. The topics addressed in these templates are Received Calls, Conversation, Abandon Rate. All the content presented in this PPT design is completely editable. Download it and make adjustments in color, background, font etc. as per your unique business setting.
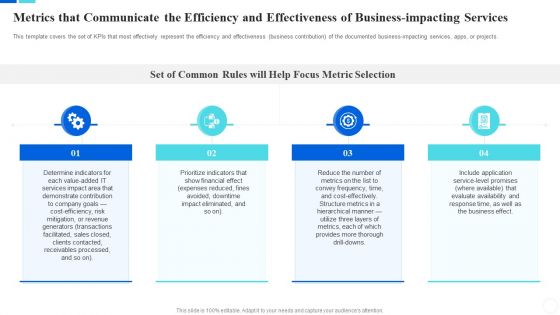
Communicate Company Value To Your Stakeholders Metrics That Communicate The Efficiency Download PDF
This template covers the set of KPIs that most effectively represent the efficiency and effectiveness business contribution of the documented business-impacting services, apps, or projects. This is a communicate company value to your stakeholders metrics that communicate the efficiency download pdf template with various stages. Focus and dispense information on four stages using this creative set, that comes with editable features. It contains large content boxes to add your information on topics like determine, services, financial, expenses, reduce. You can also showcase facts, figures, and other relevant content using this PPT layout. Grab it now.

Logistics Management Dashboard With Monthly Key Performance Indicators Rules PDF
This slide showcases status dashboard for shipping that can help organization to calculate accurate shipping information and identify latest tracking updates. Its key components are order status, volume today, global financial performance, inventory and monthly KPIs. Pitch your topic with ease and precision using this Logistics Management Dashboard With Monthly Key Performance Indicators Rules PDF. This layout presents information on Orders, Inventory, Kpis Monthly. It is also available for immediate download and adjustment. So, changes can be made in the color, design, graphics or any other component to create a unique layout.

Calculate Facebook Key Performance Indicator The Specific Campaign Details Introduction PDF
Showcasing this set of slides titled calculate facebook key performance indicator the specific campaign details introduction pdf. The topics addressed in these templates are calculate facebook key performance indicator the specific campaign details. All the content presented in this PPT design is completely editable. Download it and make adjustments in color, background, font etc. as per your unique business setting.
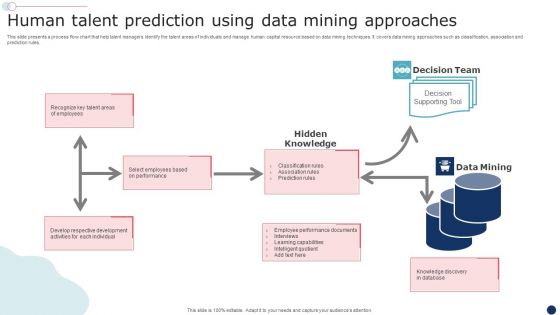
Human Talent Prediction Using Data Mining Approaches Mockup PDF
This slide presents a process flow chart that help talent managers identify the talent areas of individuals and manage human capital resource based on data mining techniques. It covers data mining approaches such as classification, association and prediction rules. Showcasing this set of slides titled Human Talent Prediction Using Data Mining Approaches Mockup PDF. The topics addressed in these templates are Human Talent, Prediction Using, Data Mining Approaches. All the content presented in this PPT design is completely editable. Download it and make adjustments in color, background, font etc. as per your unique business setting.
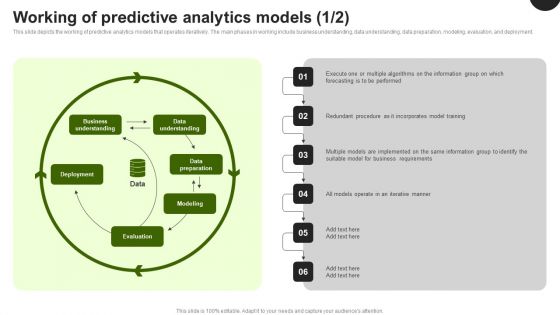
Predictive Analytics In The Age Of Big Data Working Of Predictive Analytics Models Introduction PDF
This slide depicts the working of predictive analytics models that operates iteratively. The main phases in working include business understanding, data understanding, data preparation, modeling, evaluation, and deployment. Find highly impressive Predictive Analytics In The Age Of Big Data Working Of Predictive Analytics Models Introduction PDF on Slidegeeks to deliver a meaningful presentation. You can save an ample amount of time using these presentation templates. No need to worry to prepare everything from scratch because Slidegeeks experts have already done a huge research and work for you. You need to download Predictive Analytics In The Age Of Big Data Working Of Predictive Analytics Models Introduction PDF for your upcoming presentation. All the presentation templates are 100 percent editable and you can change the color and personalize the content accordingly. Download now.

Comparison Between Data Analytics For Informed Decision Ppt Presentation
The purpose of this slide is to outline the differences between data analysis and statistical analysis. The comparison is based on several factors such as focus, tools, audience, purpose, proof and predictions, etc. From laying roadmaps to briefing everything in detail, our templates are perfect for you. You can set the stage with your presentation slides. All you have to do is download these easy-to-edit and customizable templates. Comparison Between Data Analytics For Informed Decision Ppt Presentation will help you deliver an outstanding performance that everyone would remember and praise you for. Do download this presentation today.
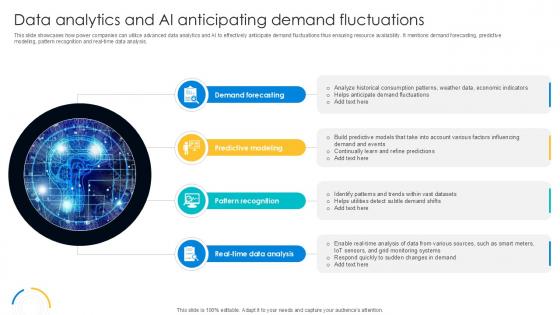
Data Analytics And AI Anticipating Digital Transformation Journey PPT Example DT SS V
This slide showcases how power companies can utilize advanced data analytics and AI to effectively anticipate demand fluctuations thus ensuring resource availability. It mentions demand forecasting, predictive modeling, pattern recognition and real-time data analysis. Formulating a presentation can take up a lot of effort and time, so the content and message should always be the primary focus. The visuals of the PowerPoint can enhance the presenters message, so our Data Analytics And AI Anticipating Digital Transformation Journey PPT Example DT SS V was created to help save time. Instead of worrying about the design, the presenter can concentrate on the message while our designers work on creating the ideal templates for whatever situation is needed. Slidegeeks has experts for everything from amazing designs to valuable content, we have put everything into Data Analytics And AI Anticipating Digital Transformation Journey PPT Example DT SS V

Steps To Develop Cashflow Budget For Effective And Efficient Tools To Develop Fin SS V
This slide shows ten step process which can be used to calculate cashflow budget for a business organization. It includes steps such as identifying select timeframe, identify cash inflow and outflows, etc. The Steps To Develop Cashflow Budget For Effective And Efficient Tools To Develop Fin SS V is a compilation of the most recent design trends as a series of slides. It is suitable for any subject or industry presentation, containing attractive visuals and photo spots for businesses to clearly express their messages. This template contains a variety of slides for the user to input data, such as structures to contrast two elements, bullet points, and slides for written information. Slidegeeks is prepared to create an impression.
Predictive Big Data Analytics And Processing Icons PDF
Pitch your topic with ease and precision using this predictive big data analytics and processing icons pdf. This layout presents information on data mining, deployment, data evaluation. It is also available for immediate download and adjustment. So, changes can be made in the color, design, graphics or any other component to create a unique layout.
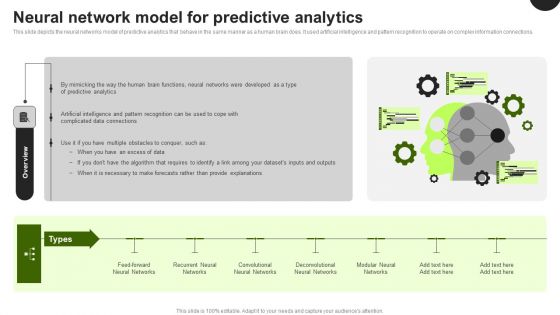
Predictive Analytics In The Age Of Big Data Neural Network Model For Predictive Analytics Demonstration PDF
This slide depicts the neural networks model of predictive analytics that behave in the same manner as a human brain does. It used artificial intelligence and pattern recognition to operate on complex information connections. Do you have an important presentation coming up Are you looking for something that will make your presentation stand out from the rest Look no further than Predictive Analytics In The Age Of Big Data Neural Network Model For Predictive Analytics Demonstration PDF. With our professional designs, you can trust that your presentation will pop and make delivering it a smooth process. And with Slidegeeks, you can trust that your presentation will be unique and memorable. So why wait Grab Predictive Analytics In The Age Of Big Data Neural Network Model For Predictive Analytics Demonstration PDF today and make your presentation stand out from the rest.
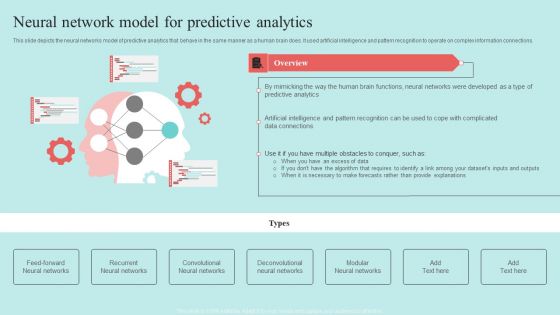
Predictive Data Model Neural Network Model For Predictive Analytics Structure PDF

Predictive Analytics Methods Methods Of Data Clustering In Predictive Analytics Inspiration PDF
This slide outlines the two primary information clustering methods used in the predictive analytics clustering model. The methods include K-means and K-nearest neighbor clustering, including the working of both approaches. Do you have to make sure that everyone on your team knows about any specific topic I yes, then you should give Predictive Analytics Methods Methods Of Data Clustering In Predictive Analytics Inspiration PDF a try. Our experts have put a lot of knowledge and effort into creating this impeccable Predictive Analytics Methods Methods Of Data Clustering In Predictive Analytics Inspiration PDF. You can use this template for your upcoming presentations, as the slides are perfect to represent even the tiniest detail. You can download these templates from the Slidegeeks website and these are easy to edit. So grab these today.
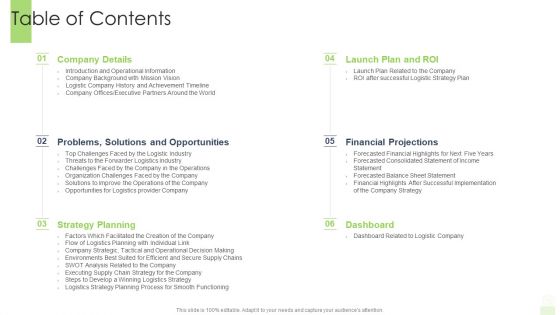
Developing Functional Logistic Plan Business Table Of Contents Ppt Infographics Information PDF
Deliver and pitch your topic in the best possible manner with this developing functional logistic plan business table of contents ppt infographics information pdf. Use them to share invaluable insights on strategy planning, dashboard, financial projections, opportunities and impress your audience. This template can be altered and modified as per your expectations. So, grab it now.
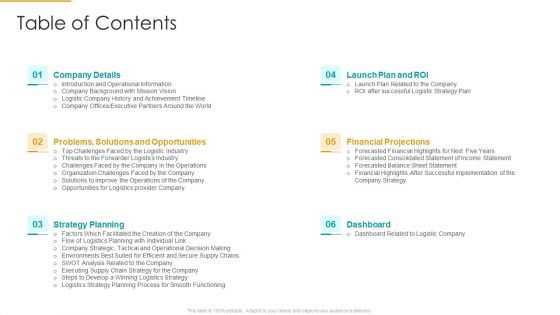
Role Of Logistics Strategy In Production Table Of Contents Demonstration PDF
Deliver an awe inspiring pitch with this creative role of logistics strategy in production table of contents demonstration pdf bundle. Topics like company details, opportunities, plan, financial projections, dashboard can be discussed with this completely editable template. It is available for immediate download depending on the needs and requirements of the user.

Statistics Report Showing Marketing Intelligence Guide Data Gathering Slides Pdf
This slide presents an statistics reports providing valuable insights of global market based on data collection and analysis. It covers key elements such as forecasted market CAGR, incremental growth, estimated YoY rate, revenue generating market region and key drivers. Get a simple yet stunning designed Statistics Report Showing Marketing Intelligence Guide Data Gathering Slides Pdf. It is the best one to establish the tone in your meetings. It is an excellent way to make your presentations highly effective. So, download this PPT today from Slidegeeks and see the positive impacts. Our easy to edit Statistics Report Showing Marketing Intelligence Guide Data Gathering Slides Pdf can be your go to option for all upcoming conferences and meetings. So, what are you waiting for Grab this template today.
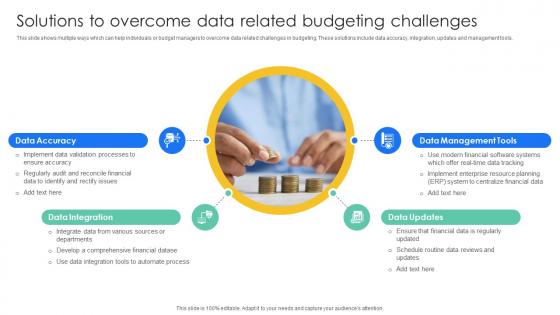
Solutions To Overcome Data Related Effective And Efficient Tools To Develop Fin SS V
This slide shows multiple ways which can help individuals or budget managers to overcome data related challenges in budgeting. These solutions include data accuracy, integration, updates and management tools. Welcome to our selection of the Solutions To Overcome Data Related Effective And Efficient Tools To Develop Fin SS V. These are designed to help you showcase your creativity and bring your sphere to life. Planning and Innovation are essential for any business that is just starting out. This collection contains the designs that you need for your everyday presentations. All of our PowerPoints are 100Percent editable, so you can customize them to suit your needs. This multi-purpose template can be used in various situations. Grab these presentation templates today.
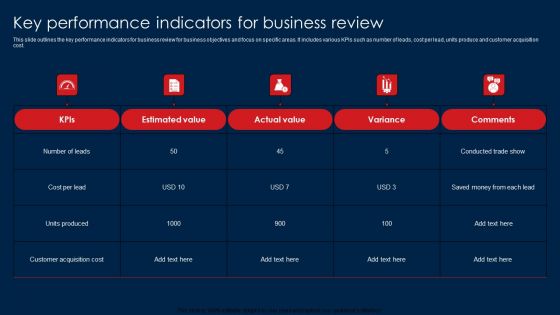
Key Performance Indicators For Business Review Mockup PDF
This slide outlines the key performance indicators for business review for business objectives and focus on specific areas. It includes various KPIs such as number of leads, cost per lead, units produce and customer acquisition cost. Showcasing this set of slides titled Key Performance Indicators For Business Review Mockup PDF. The topics addressed in these templates are Estimated Value, Actual Value, Variance. All the content presented in this PPT design is completely editable. Download it and make adjustments in color, background, font etc. as per your unique business setting.
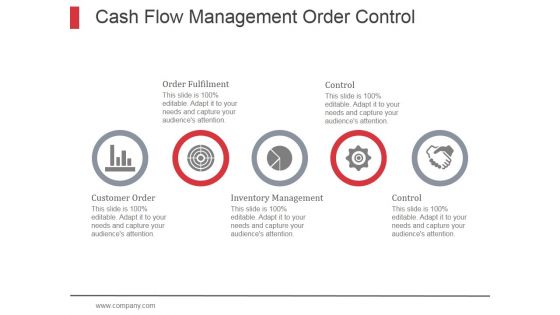
Cash Flow Management Order Control Ppt PowerPoint Presentation Design Ideas
This is a cash flow management order control ppt powerpoint presentation design ideas. This is a five stage process. The stages in this process are management, cash flow management, budget, financial analysis.

Predictive Analytics In The Age Of Big Data Applications Of Predictive Analytics Fraud Detection Formats PDF
This slide represents the application of predictive analytics in fraud detection in various industries. Predictive analytics help combat these frauds by sifting through large amounts of information and submitting the suspicious ones to the investigation teams. Boost your pitch with our creative Predictive Analytics In The Age Of Big Data Applications Of Predictive Analytics Fraud Detection Formats PDF. Deliver an awe-inspiring pitch that will mesmerize everyone. Using these presentation templates you will surely catch everyones attention. You can browse the ppts collection on our website. We have researchers who are experts at creating the right content for the templates. So you do not have to invest time in any additional work. Just grab the template now and use them.
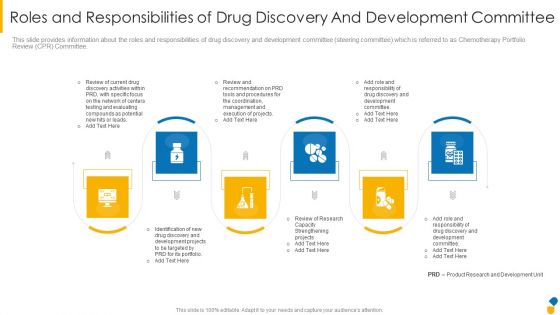
Roles And Responsibilities Of Drug Discovery And Development Committee Portrait PDF
This slide provides information about the roles and responsibilities of drug discovery and development committee steering committee which is referred to as Chemotherapy Portfolio Review CPR Committee. This is a roles and responsibilities of drug discovery and development committee portrait pdf template with various stages. Focus and dispense information on six stages using this creative set, that comes with editable features. It contains large content boxes to add your information on topics like review of research capacity strengthening projects, responsibility of drug discovery, identification of new drug discovery. You can also showcase facts, figures, and other relevant content using this PPT layout. Grab it now.

Agenda Data Management Solutions Download PDF
This is a Agenda Data Management Solutions Download PDF template with various stages. Focus and dispense information on six stages using this creative set, that comes with editable features. It contains large content boxes to add your information on topics like Governance Requirements, Minimizing Data Movement, Analysis Project. You can also showcase facts, figures, and other relevant content using this PPT layout. Grab it now.

Targeting And Positioning Ppt Presentation Examples
This is a targeting and positioning ppt presentation examples. This is a ten stage process. The stages in this process are targeting and positioning, unique value proposition, digital scope and project, data integration, management planning, goal performance, customer insight, competitive analysis, customer journey, digital value chain analysis.

Predictive Analytics In The Age Of Big Data Timeline For Predictive Analytics Model Development Information PDF
This slide depicts the roadmap for predictive analytics model development, including describing the project, information collection, information analysis, statistics, modeling, implementation of the model, and model monitoring. There are so many reasons you need a Predictive Analytics In The Age Of Big Data Timeline For Predictive Analytics Model Development Information PDF. The first reason is you cannot spend time making everything from scratch, Thus, Slidegeeks has made presentation templates for you too. You can easily download these templates from our website easily.

Predictive Analytics For Empowering Predictive Analytics Forecast Model Introduction Inspiration Pdf
This slide outlines the introduction of the forecast model used for predictive analytics to make the metric value predictions for business processes. This model uses the Prophet algorithm to make predictions and includes its use cases in the manufacturing industry. Make sure to capture your audiences attention in your business displays with our gratis customizable Predictive Analytics For Empowering Predictive Analytics Forecast Model Introduction Inspiration Pdf These are great for business strategies, office conferences, capital raising or task suggestions. If you desire to acquire more customers for your tech business and ensure they stay satisfied, create your own sales presentation with these plain slides.
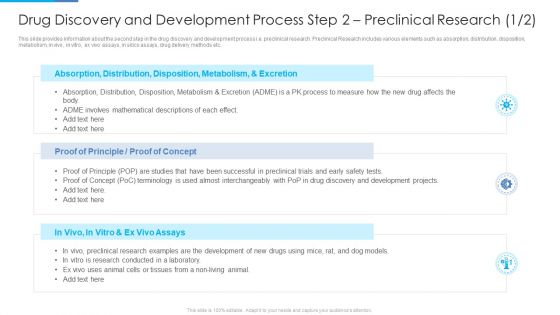
Drug Discovery And Development Process Step 2 Preclinical Research Proof Summary PDF
This slide provides information about the second step in the drug discovery and development process i.e. preclinical research. Preclinical Research includes various elements such as absorption, distribution, disposition, metabolism, in vivo, in vitro, ex vivo assays, in silico assays, drug delivery methods etc. This is a drug discovery and development process step 2 preclinical research proof summary pdf template with various stages. Focus and dispense information on three stages using this creative set, that comes with editable features. It contains large content boxes to add your information on topics like development, projects, process. You can also showcase facts, figures, and other relevant content using this PPT layout. Grab it now.
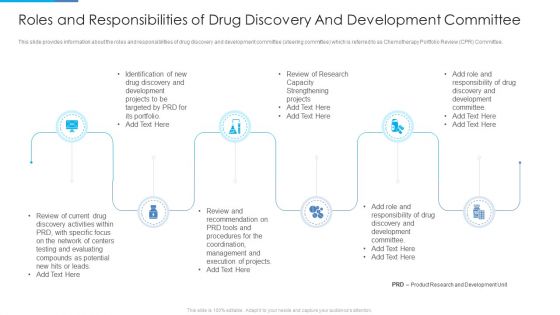
Roles And Responsibilities Of Drug Discovery And Development Committee Pictures PDF
This slide provides information about the roles and responsibilities of drug discovery and development committee steering committee which is referred to as Chemotherapy Portfolio Review CPR Committee. Presenting roles and responsibilities of drug discovery and development committee pictures pdf to provide visual cues and insights. Share and navigate important information on six stages that need your due attention. This template can be used to pitch topics like management, development, strengthening projects, network, research capacity. In addtion, this PPT design contains high resolution images, graphics, etc, that are easily editable and available for immediate download.
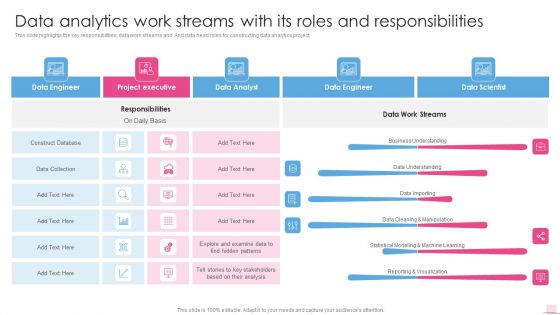
Data Analytics Work Streams With Its Roles And Responsibilities Business Analysis Modification Toolkit Inspiration PDF
This slide highlights the key responsibilities, data work streams and. And data head roles for constructing data analytics project.Deliver an awe inspiring pitch with this creative Data Analytics Work Streams With Its Roles And Responsibilities Business Analysis Modification Toolkit Inspiration PDF bundle. Topics like Machine Learning, Reporting Visualization can be discussed with this completely editable template. It is available for immediate download depending on the needs and requirements of the user.
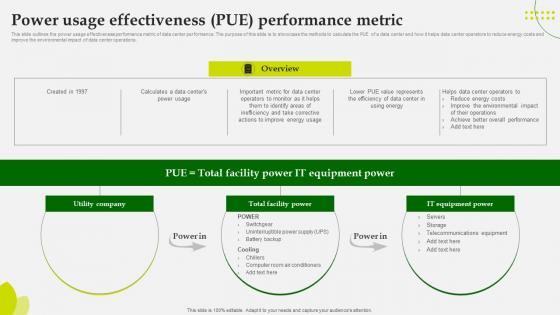
Green Computing Power Usage Effectiveness Pue Performance Metric
This slide outlines the power usage effectiveness performance metric of data center performance. The purpose of this slide is to showcase the methods to calculate the PUE of a data center and how it helps data center operators to reduce energy costs and improve the environmental impact of data center operations. Create an editable Green Computing Power Usage Effectiveness Pue Performance Metric that communicates your idea and engages your audience. Whether you are presenting a business or an educational presentation, pre-designed presentation templates help save time. Green Computing Power Usage Effectiveness Pue Performance Metric is highly customizable and very easy to edit, covering many different styles from creative to business presentations. Slidegeeks has creative team members who have crafted amazing templates. So, go and get them without any delay.
Five Different Types Of Calculate Facebook Key Performance Indicator Results Icons PDF
Pitch your topic with ease and precision using this five different types of calculate facebook key performance indicator results icons pdf. This layout presents information on reach kpis, traffic kpis, engagement kpis, conversions kpis, brand awareness kpis. It is also available for immediate download and adjustment. So, changes can be made in the color, design, graphics or any other component to create a unique layout.

Predictive Analytics In The Age Of Big Data Methods Of Data Clustering In Predictive Analytics Topics PDF
This slide outlines the two primary information clustering methods used in the predictive analytics clustering model. The methods include K-means and K-nearest neighbor clustering, including the working of both approaches. Slidegeeks is here to make your presentations a breeze with Predictive Analytics In The Age Of Big Data Methods Of Data Clustering In Predictive Analytics Topics PDF With our easy to use and customizable templates, you can focus on delivering your ideas rather than worrying about formatting. With a variety of designs to choose from, you are sure to find one that suits your needs. And with animations and unique photos, illustrations, and fonts, you can make your presentation pop. So whether you are giving a sales pitch or presenting to the board, make sure to check out Slidegeeks first.

Direct Response Marketing Guide Ultimate Success Dashboard To Track Progress Diagrams PDF
This slide provides an overview of the dashboard depicting the status of the digital marketing campaign with the help of performance metrics. The dashboard includes ad spend, return on ad spend, purchase rate and cost per order. Are you in need of a template that can accommodate all of your creative concepts This one is crafted professionally and can be altered to fit any style. Use it with Google Slides or PowerPoint. Include striking photographs, symbols, depictions, and other visuals. Fill, move around, or remove text boxes as desired. Test out color palettes and font mixtures. Edit and save your work, or work with colleagues. Download Direct Response Marketing Guide Ultimate Success Dashboard To Track Progress Diagrams PDF and observe how to make your presentation outstanding. Give an impeccable presentation to your group and make your presentation unforgettable.

Advanced Big Data Analytics Framework Developing Strategic Insights Using Big Data Analytics SS V
This slide showcases framework illustrating use of big data analytics in retain industry to improve operational efficiency. It includes elements such as demand forecasting, personalized marketing, price optimization, fraud detection etc. Boost your pitch with our creative Advanced Big Data Analytics Framework Developing Strategic Insights Using Big Data Analytics SS V. Deliver an awe-inspiring pitch that will mesmerize everyone. Using these presentation templates you will surely catch everyones attention. You can browse the ppts collection on our website. We have researchers who are experts at creating the right content for the templates. So you do not have to invest time in any additional work. Just grab the template now and use them.

Introduction To IoT Data Analysis IoT Fleet Monitoring Ppt PowerPoint IoT SS V
This slide provides an overview of the IoT data analysis that make future predictions after gathering and assessing data. The slide includes applications and components such as data collection, storage, processing, analysis and visualization. Are you in need of a template that can accommodate all of your creative concepts This one is crafted professionally and can be altered to fit any style. Use it with Google Slides or PowerPoint. Include striking photographs, symbols, depictions, and other visuals. Fill, move around, or remove text boxes as desired. Test out color palettes and font mixtures. Edit and save your work, or work with colleagues. Download Introduction To IoT Data Analysis IoT Fleet Monitoring Ppt PowerPoint IoT SS V and observe how to make your presentation outstanding. Give an impeccable presentation to your group and make your presentation unforgettable.
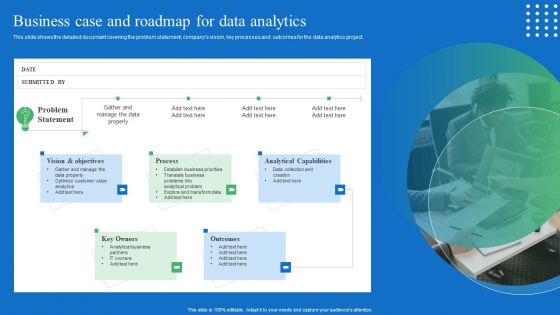
Toolkit For Data Science And Analytics Transition Business Case And Roadmap For Data Analytics Microsoft PDF
This slide shows the detailed document covering the problem statement, companys vision, key processes and outcomes for the data analytics project.There are so many reasons you need a Toolkit For Data Science And Analytics Transition Business Case And Roadmap For Data Analytics Microsoft PDF. The first reason is you can not spend time making everything from scratch, Thus, Slidegeeks has made presentation templates for you too. You can easily download these templates from our website easily.

 Home
Home