Profit And Loss Dashboard
Stages To Prevent Revenue Loss Ppt PowerPoint Presentation Icon File Formats PDF
Persuade your audience using this stages to prevent revenue loss ppt powerpoint presentation icon file formats pdf. This PPT design covers one stages, thus making it a great tool to use. It also caters to a variety of topics including encourage higher product registration rate, revaluate how to capture customer data, conduct ongoing installed based data analysis, deliver actionable business intelligence, address low cost contract renewals with automation. Download this PPT design now to present a convincing pitch that not only emphasizes the topic but also showcases your presentation skills.

Revenue And Loss Local Currency Vs Us Dollar Comparison Structure PDF
This slide covers a currency analysis sheet for analyzing subsidiaries data in a foreign currency. It includes an analysis basis such as month to date and year-to-date values in local currency and US dollars. Pitch your topic with ease and precision using this Revenue And Loss Local Currency Vs Us Dollar Comparison Structure PDF. This layout presents information on Cost Of Sales, Revenue, Departmental Expenses. It is also available for immediate download and adjustment. So, changes can be made in the color, design, graphics or any other component to create a unique layout.
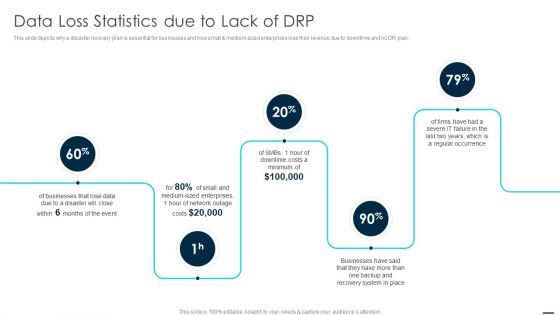
Technology Disaster Recovery Plan Data Loss Statistics Due To Lack Of DRP Guidelines PDF
This slide depicts why a disaster recovery plan is essential for businesses and how small and medium sized enterprises lose their revenue due to downtime and no DR plan. Presenting Technology Disaster Recovery Plan Data Loss Statistics Due To Lack Of DRP Guidelines PDF to provide visual cues and insights. Share and navigate important information on five stages that need your due attention. This template can be used to pitch topics like Recovery System, Businesses, Enterprises. In addtion, this PPT design contains high resolution images, graphics, etc, that are easily editable and available for immediate download.

Security Management Plan Steps In Detail Data Backup And Data Loss Recovery Plan Portrait PDF
Presenting security management plan steps in detail data backup and data loss recovery plan portrait pdf to provide visual cues and insights. Share and navigate important information on one stage that need your due attention. This template can be used to pitch topics like outline business continuity, recovery infrastructure, inventory of the business. In addtion, this PPT design contains high resolution images, graphics, etc, that are easily editable and available for immediate download.

Security Management Plan Steps In Detail Data Backup And Data Loss Recovery Plan Professional PDF
This is a security management plan steps in detail data backup and data loss recovery plan professional pdf template with various stages. Focus and dispense information on four stages using this creative set, that comes with editable features. It contains large content boxes to add your information on topics like application security tools, categories of application, data backup frequency. You can also showcase facts, figures, and other relevant content using this PPT layout. Grab it now.
Data Loss Prevention Strategy With Icons Ppt PowerPoint Presentation Gallery Slides PDF
Persuade your audience using this data loss prevention strategy with icons ppt powerpoint presentation gallery slides pdf. This PPT design covers four stages, thus making it a great tool to use. It also caters to a variety of topics including data, social security, network. Download this PPT design now to present a convincing pitch that not only emphasizes the topic but also showcases your presentation skills.
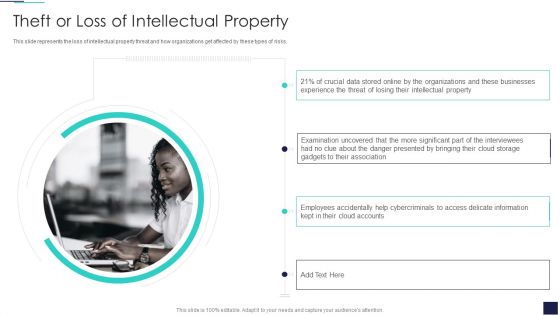
Cloud Information Security Theft Or Loss Of Intellectual Property Ppt Show Guidelines PDF
Presenting Cloud Information Security Theft Or Loss Of Intellectual Property Ppt Show Guidelines PDF to provide visual cues and insights. Share and navigate important information on one stages that need your due attention. This template can be used to pitch topics like Crucial Data, Businesses Experience, Cloud Storage. In addtion, this PPT design contains high resolution images, graphics, etc, that are easily editable and available for immediate download.
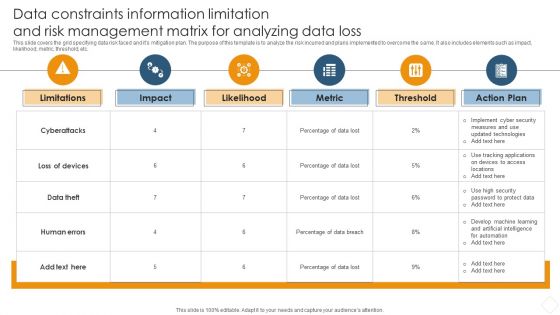
Data Constraints Information Limitation And Risk Management Matrix For Analyzing Data Loss Brochure PDF
This slide covers the grid specifying data risk faced and its mitigation plan. The purpose of this template is to analyze the risk incurred and plans implemented to overcome the same. It also includes elements such as impact, likelihood, metric, threshold, etc.Showcasing this set of slides titled Data Constraints Information Limitation And Risk Management Matrix For Analyzing Data Loss Brochure PDF. The topics addressed in these templates are Data Distribution, Secure Computation, Verifiable Computation. All the content presented in this PPT design is completely editable. Download it and make adjustments in color, background, font etc. as per your unique business setting.

Risk Management Matrix With Probability And Loss Ppt PowerPoint Presentation Infographic Template Deck PDF
This slides highlights risk metrics and prioritized threats. It also includes service disruption, data leakage, cyber fraud and vendor cyber risk. Presenting risk management matrix with probability and loss ppt powerpoint presentation infographic template deck pdf to dispense important information. This template comprises four stages. It also presents valuable insights into the topics including service disruption, disable of internal and external services, risk matrix. This is a completely customizable PowerPoint theme that can be put to use immediately. So, download it and address the topic impactfully.
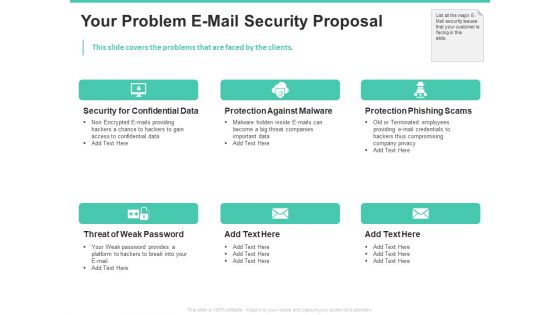
Email Security Encryption And Data Loss Prevention Your Problem E Mail Security Proposal Rules PDF
This slide covers the problems that are faced by the clients. Presenting email security encryption and data loss prevention your problem e mail security proposal rules pdf to provide visual cues and insights. Share and navigate important information on six stages that need your due attention. This template can be used to pitch topics like security confidential data, protection against malware, protection phishing scams, threat weak password. In addtion, this PPT design contains high-resolution images, graphics, etc, that are easily editable and available for immediate download.
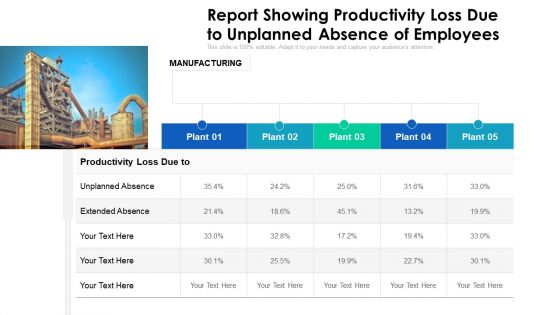
Report Showing Productivity Loss Due To Unplanned Absence Of Employees Ppt PowerPoint Presentation Gallery Topics PDF
Showcasing this set of slides titled empty desk with warning sign vector icon ppt powerpoint presentation file deck pdf. The topics addressed in these templates are unplanned absence, extended absence, productivity lo. All the content presented in this PPT design is completely editable. Download it and make adjustments in color, background, font etc. as per your unique business setting.

Loss Of Income And Financials Decline In An Automobile Organization Case Study Key Performance Indicators Brochure PDF
The slide shows the key Performance Indicator KPI s which will help the company to track the success rate of implemented strategies. Major KPIs include number of vehicle sold and manufactured, utilization rate, number of visitors, customer satisfaction level etc.Deliver an awe inspiring pitch with this creative loss of income and financials decline in an automobile organization case study key performance indicators brochure pdf bundle. Topics like key performance indicator, utilization rate, customer satisfaction level can be discussed with this completely editable template. It is available for immediate download depending on the needs and requirements of the user

Pyramid Diagram Planning Process Non Profit Business Template PowerPoint Templates
We present our pyramid diagram planning process non profit business template PowerPoint templates.Present our Process and Flows PowerPoint Templates because Our PowerPoint Templates and Slides are focused like a searchlight beam. They highlight your ideas for your target audience. Download and present our Triangles PowerPoint Templates because You have the co-ordinates for your destination of success. Let our PowerPoint Templates and Slides map out your journey. Download and present our Business PowerPoint Templates because You are well armed with penetrative ideas. Our PowerPoint Templates and Slides will provide the gunpowder you need. Use our Marketing PowerPoint Templates because Our PowerPoint Templates and Slides will provide the perfect balance. Your weighty ideas will get the ideal impetus. Use our Shapes PowerPoint Templates because Our PowerPoint Templates and Slides will let your ideas bloom. Create a bed of roses for your audience.Use these PowerPoint slides for presentations relating to Pyramid, chart, graph, diagram, vector, growth, business, progress, support, symbol, level, shape, object, stage, isolated, triangle, data pyramid, hierarchy, presentation, bright, multicolor, layer, top, abstract, layered, pyramid, illustration, reflection, group, construction, structure, performance. The prominent colors used in the PowerPoint template are Green, Green lime, Yellow.
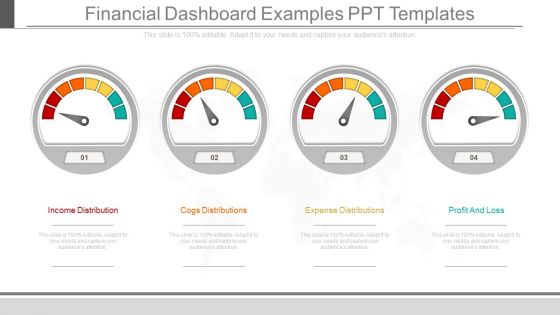
Financial Dashboard Examples Ppt Templates
This is a financial dashboard examples ppt templates. This is a four stage process. The stages in this process are income distribution, cogs distributions, expense distributions, profit and loss.
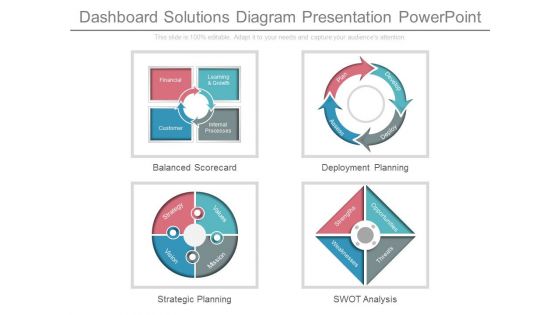
Dashboard Solutions Diagram Presentation Powerpoint
This is a dashboard solutions diagram presentation powerpoint. This is a four stage process. The stages in this process are financial, learning and growth, customer, internal processes, balanced scorecard, values, mission, strategy, vision, strategic planning, plan, develop, assess, deploy, deployment planning, strengths, opportunities, weaknesses, threats, swot analysis.

Stock Investment Fundamental Trend Analysis Table With Net Profit Sample PDF
This slide shows the table representing the analysis of stock in which investment is to be made. It shows data related to calculation of profit or loss for the upcoming years along with their operating profit, expenses, interest etc.Showcasing this set of slides titled Stock Investment Fundamental Trend Analysis Table With Net Profit Sample PDF. The topics addressed in these templates are Profit Loss, Consolidated Figures, Operating Profit. All the content presented in this PPT design is completely editable. Download it and make adjustments in color, background, font etc. as per your unique business setting.
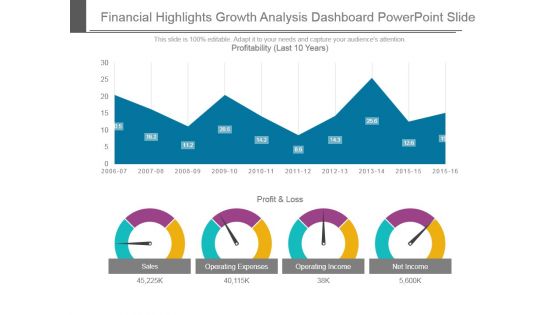
Financial Highlights Growth Analysis Dashboard Powerpoint Slide
This is a financial highlights growth analysis dashboard powerpoint slide. This is a four stage process. The stages in this process are profit and loss, sales, operating expenses, operating income, net income, profitability.
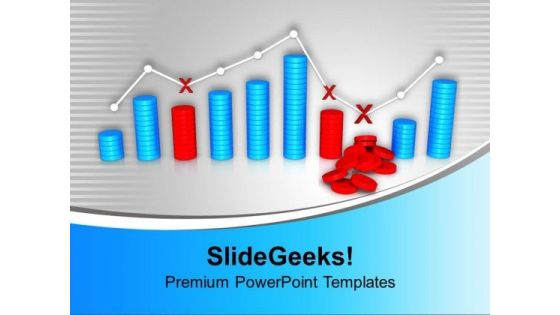
Graphical Representation Of Profit Business PowerPoint Templates Ppt Backgrounds For Slides 1112
We present our Graphical Representation Of Profit Business PowerPoint Templates PPT Backgrounds For Slides 1112.Use our Marketing PowerPoint Templates because networking is an imperative in todays world. You need to access the views of others. Similarly you need to give access to them of your abilities. Present our Business PowerPoint Templates because you have had a great year or so business wise. It is time to celebrate the efforts of your team. Use our Finance PowerPoint Templates because you have some excellent plans to spread some more of it across your community. Download and present our Future PowerPoint Templates because let this slide illustrates others piggyback on you to see well over the horizon. Present our Shapes PowerPoint Templates because they help to lay the base of your trend of thought.Use these PowerPoint slides for presentations relating to Profit and loss graph, business, shapes, finance, future, marketing. The prominent colors used in the PowerPoint template are Blue light, Red, Gray. People tell us our Graphical Representation Of Profit And Loss Business PowerPoint Templates PPT Backgrounds For Slides 1112 are readymade to fit into any presentation structure. Presenters tell us our shapes PowerPoint templates and PPT Slides are Ultra. PowerPoint presentation experts tell us our Graphical Representation Of Profit And Loss Business PowerPoint Templates PPT Backgrounds For Slides 1112 will impress their bosses and teams. Customers tell us our marketing PowerPoint templates and PPT Slides will generate and maintain the level of interest you desire. They will create the impression you want to imprint on your audience. Customers tell us our Graphical Representation Of Profit And Loss Business PowerPoint Templates PPT Backgrounds For Slides 1112 are Wistful. Customers tell us our finance PowerPoint templates and PPT Slides are the best it can get when it comes to presenting.

Sales Performance Dashboard Ppt PowerPoint Presentation Show
This is a sales performance dashboard ppt powerpoint presentation show. This is a four stage process. The stages in this process are lead sources revenue share, total sales by month, opportunities total sales by probability, win loss ratio.

Sales Performance Dashboard Ppt PowerPoint Presentation Good
This is a sales performance dashboard ppt powerpoint presentation good. This is a four stage process. The stages in this process are lead sources revenue share, total sales by month, opportunities total sales by probability, win loss ratio.
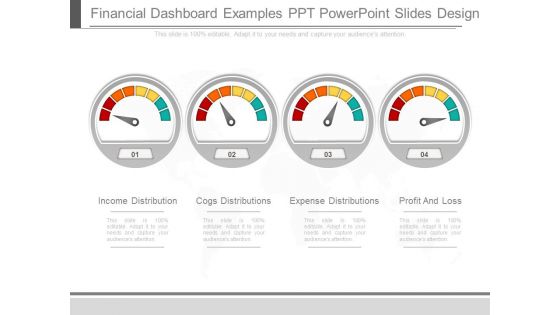
Financial Dashboard Examples Ppt Powerpoint Slides Design
This is a financial dashboard examples ppt powerpoint slides design. This is a four stage process. The stages in this process are income distribution, cogs distributions, expense distributions, profit and loss.

Property Management Dashboard One Pager Documents
This page provides the property management dashboard including details such as net income revenue and total cost, occupancy rate, tenant turnover, tenant acquisition cost, loss due to vacancy, revenue and cost overview graph etc. Presenting you an exemplary Property Management Dashboard One Pager Documents. Our one-pager comprises all the must-have essentials of an inclusive document. You can edit it with ease, as its layout is completely editable. With such freedom, you can tweak its design and other elements to your requirements. Download this Property Management Dashboard One Pager Documents brilliant piece now.
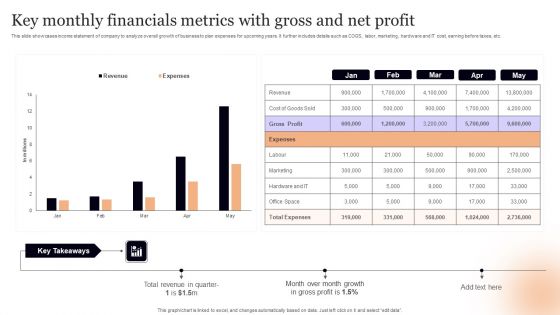
Key Monthly Financials Metrics With Gross And Net Profit Guidelines PDF
This slide showcases income statement of company to analyze overall growth of business to plan expenses for upcoming years. It further includes details such as COGS, labor, marketing, hardware and IT cost, earning before taxes, etc. Showcasing this set of slides titled Key Monthly Financials Metrics With Gross And Net Profit Guidelines PDF. The topics addressed in these templates are Key Takeaways, Total Revenue, Profit. All the content presented in this PPT design is completely editable. Download it and make adjustments in color, background, font etc. as per your unique business setting.

Enterprise Dashboard Ppt Presentation Powerpoint Example
This is a enterprise dashboard ppt presentation powerpoint example. This is a three stage process. The stages in this process are balance scorecard, enterprise performance, industry trends.

Balanced Scorecard Dashboard Framework Ppt Sample
This is a balanced scorecard dashboard framework ppt sample. This is a four stage process. The stages in this process are learning and growth, financial, internal business processes, customer.

Strategy Planning Dashboard Example Ppt Slide
This is a strategy planning dashboard example ppt slide. This is a two stage process. The stages in this process are strategy map, kpis, balanced scorecard, action plan, benchmarks, dashboard.

Balanced Scorecard Dashboard Illustration Ppt Slides
This is a balanced scorecard dashboard illustration ppt slides. This is a five stage process. The stages in this process are business benefits, financials, schedule, technology, customer.

Balanced Scorecard Customer Dashboard Ppt Slides
This is a balanced scorecard customer dashboard ppt slides. This is a five stage process. The stages in this process are processes, partner, technology, stakeholders, people.
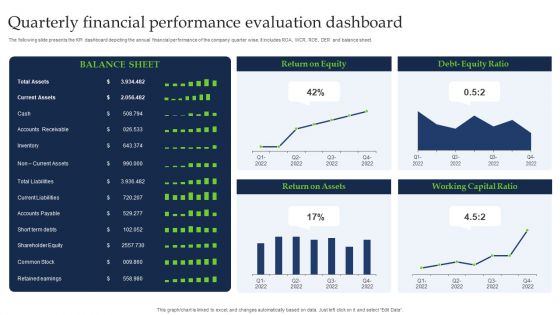
Quarterly Financial Performance Evaluation Dashboard Guidelines PDF
The following slide presents the KPI dashboard depicting the annual financial performance of the company quarter wise. It includes ROA, WCR, ROE, DER and balance sheet. Pitch your topic with ease and precision using this Quarterly Financial Performance Evaluation Dashboard Guidelines PDF. This layout presents information on Current Assets, Shareholder Equity, Common Stock. It is also available for immediate download and adjustment. So, changes can be made in the color, design, graphics or any other component to create a unique layout.
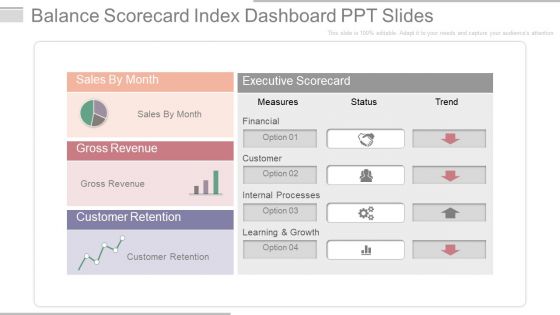
Balance Scorecard Index Dashboard Ppt Slides
This is a balance scorecard index dashboard ppt slides. This is a one stage process. The stages in this process are sales by month, gross revenue, customer retention, executive scorecard, measures, status, trend, financial, option, customer, internal processes, learning and growth.
Investment Fund Performance Tracking Dashboard Microsoft PDF
This slide showcases a dashboard to track and supervise funds performance for portfolio balancing . it includes key components such as amount invested in funds, number of invested funds, rate of return, annual investments and rating wise investments. Pitch your topic with ease and precision using this Investment Fund Performance Tracking Dashboard Microsoft PDF. This layout presents information on Amount Invented Funds, Rate Return, Rating Wise Investments. It is also available for immediate download and adjustment. So, changes can be made in the color, design, graphics or any other component to create a unique layout.
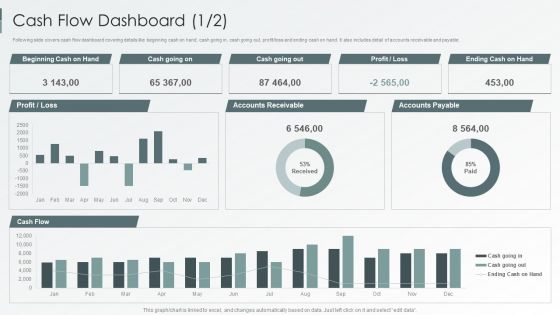
Enterprise Sustainability Performance Metrics Cash Flow Dashboard Inspiration PDF
Following slide covers cash flow dashboard covering details like beginning cash on hand, cash going in, cash going out, profit loss and ending cash on hand. It also includes detail of accounts receivable and payable.Deliver an awe inspiring pitch with this creative Enterprise Sustainability Performance Metrics Cash Flow Dashboard Inspiration PDF bundle. Topics like Accounts Receivable, Accounts Payable, Profit Loss can be discussed with this completely editable template. It is available for immediate download depending on the needs and requirements of the user.
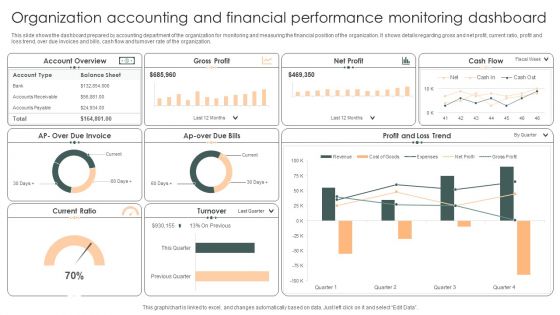
Organization Accounting And Financial Performance Monitoring Dashboard Pictures PDF
This slide shows the dashboard prepared by accounting department of the organization for monitoring and measuring the financial position of the organization. It shows details regarding gross and net profit, current ratio, profit and loss trend, over due invoices and bills, cash flow and turnover rate of the organization.Showcasing this set of slides titled Organization Accounting And Financial Performance Monitoring Dashboard Pictures PDF. The topics addressed in these templates are Account Overview, Due Invoice, Loss Trend. All the content presented in this PPT design is completely editable. Download it and make adjustments in color, background, font etc. as per your unique business setting.
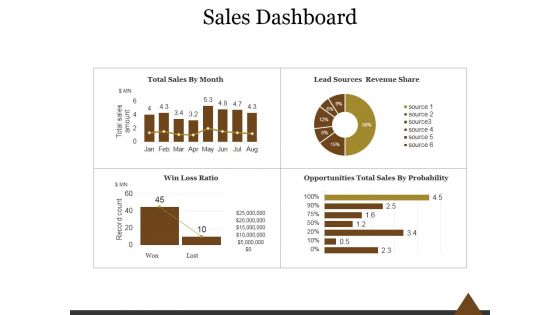
Sales Dashboard Template 2 Ppt PowerPoint Presentation Introduction
This is a sales dashboard template 2 ppt powerpoint presentation introduction. This is a four stage process. The stages in this process are total sales by month, lead sources revenue share, win loss ratio, opportunities total sales by probability.
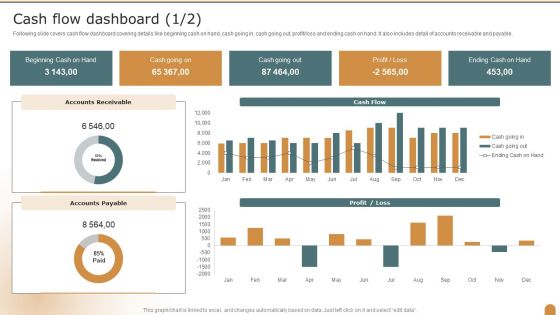
Cash Flow Dashboard Company Performance Evaluation Using KPI Formats PDF
Following slide covers cash flow dashboard covering details like beginning cash on hand, cash going in, cash going out, profit loss and ending cash on hand. It also includes detail of accounts receivable and payable. Deliver an awe inspiring pitch with this creative Cash Flow Dashboard Company Performance Evaluation Using KPI Formats PDF bundle. Topics like Beginning Cash, Profit, Cash Flow Dashboard can be discussed with this completely editable template. It is available for immediate download depending on the needs and requirements of the user.
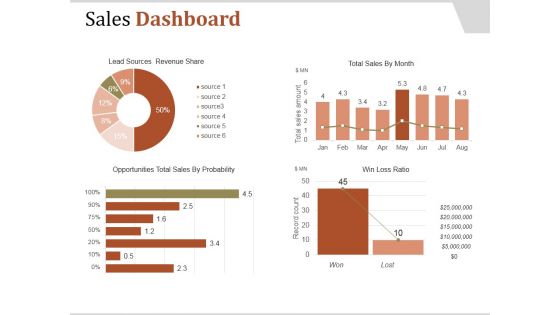
Sales Dashboard Template 2 Ppt PowerPoint Presentation Clipart
This is a sales dashboard template 2 ppt powerpoint presentation clipart. This is a four stage process. The stages in this process are lead sources revenue share, total sales by month, win loss ratio, opportunities total sales by probability.
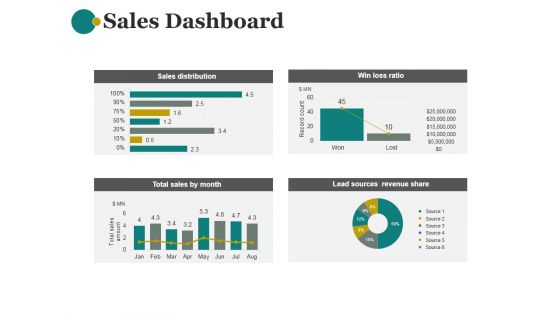
Sales Dashboard Template 2 Ppt PowerPoint Presentation Examples
This is a sales dashboard template 2 ppt powerpoint presentation examples. This is a four stage process. The stages in this process are sales distribution, win loss ratio, lead sources revenue share, total sales by month.
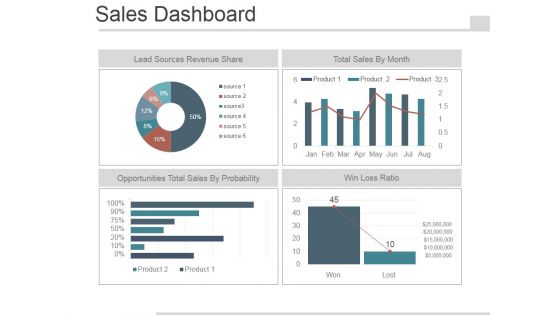
Sales Dashboard Slide Template 2 Ppt PowerPoint Presentation Images
This is a sales dashboard slide template 2 ppt powerpoint presentation images. This is a four stage process. The stages in this process are lead sources revenue share, total sales by month, opportunities total sales by probability, win loss ratio.

Kpis For Evaluating Business Sustainability Cash Flow Dashboard Background PDF
Following slide covers cash flow dashboard covering details like beginning cash on hand, cash going in, cash going out, profit or loss and ending cash on hand. It also includes detail of accounts receivable and payable. Deliver an awe inspiring pitch with this creative Kpis For Evaluating Business Sustainability Cash Flow Dashboard Background PDF bundle. Topics like Accounts Receivable, Accounts Payable, Cash Flow can be discussed with this completely editable template. It is available for immediate download depending on the needs and requirements of the user.

Metrics To Measure Business Performance Cash Flow Dashboard Rules PDF
Following slide covers cash flow dashboard covering details like beginning cash on hand, cash going in, cash going out, profit or loss and ending cash on hand. It also includes detail of accounts receivable and payable. Deliver an awe inspiring pitch with this creative Metrics To Measure Business Performance Cash Flow Dashboard Rules PDF bundle. Topics like Beginning Cash Hand, Cash Going Out, Accounts Payable, Accounts Receivable can be discussed with this completely editable template. It is available for immediate download depending on the needs and requirements of the user.
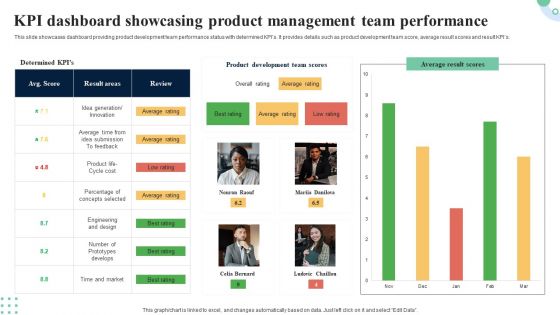
KPI Dashboard Showcasing Product Management Team Performance Demonstration PDF
This slide represents dashboard showcasing revenue assessment for new product development. It projects information regarding revenue breakdown, revenue per product, time to marketing and win or loss analysis. Showcasing this set of slides titled KPI Dashboard Showcasing Product Management Team Performance Demonstration PDF. The topics addressed in these templates are Revenue Per Project, Revenue Breakdown, Loss Analysis. All the content presented in this PPT design is completely editable. Download it and make adjustments in color, background, font etc. as per your unique business setting.
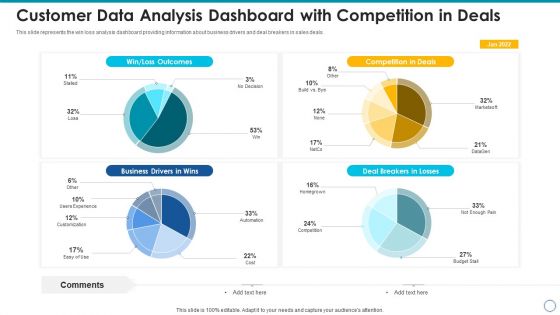
Customer Data Analysis Dashboard With Competition In Deals Infographics PDF
This slide represents the win loss analysis dashboard providing information about business drivers and deal breakers in sales deals. Pitch your topic with ease and precision using this customer data analysis dashboard with competition in deals infographics pdf. This layout presents information on customer data analysis dashboard with competition in deals. It is also available for immediate download and adjustment. So, changes can be made in the color, design, graphics or any other component to create a unique layout.

Customer Data Analysis Dashboard With Spread Of Opportunity Professional PDF
This slide indicates the win loss analysis dashboard providing information regarding opportunity spread across multiple regions of target sales territory. Showcasing this set of slides titled customer data analysis dashboard with spread of opportunity professional pdf. The topics addressed in these templates are customer data analysis dashboard with spread of opportunity. All the content presented in this PPT design is completely editable. Download it and make adjustments in color, background, font etc. as per your unique business setting.

Annual Financial Data With KPI Insights Dashboard Structure PDF
The following slides highlights the financial kpas in summarized form to evaluate companys annual operating performance. It includes metrics such as gross, operating and net profit margin, income statement, target versus actual EBIT etc. Pitch your topic with ease and precision using this Annual Financial Data With KPI Insights Dashboard Structure PDF. This layout presents information on Gross Profit Margin, Operating Profit Margin, Net Profit Margin. It is also available for immediate download and adjustment. So, changes can be made in the color, design, graphics or any other component to create a unique layout.
IT Security Hacker Dashboard For Threat Tracking Rules PDF
This slide depicts the dashboard for threat tracking through cyber security measures and ethical hackers by covering monthly threat status, current risk status, threat-based on the role, threats by owners, risk by threats, and threat report.Deliver an awe inspiring pitch with this creative IT Security Hacker Dashboard For Threat Tracking Rules PDF bundle. Topics like Threat Dashboard, Loss Of Information, Regulations And Contracts can be discussed with this completely editable template. It is available for immediate download depending on the needs and requirements of the user.
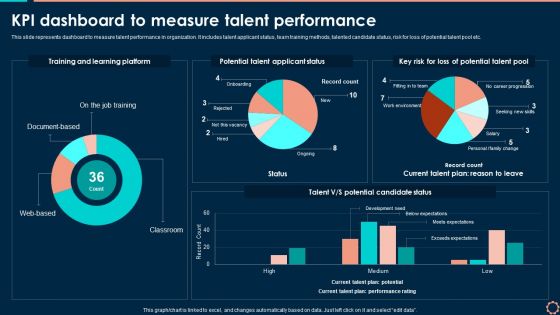
KPI Dashboard To Measure Talent Performance Slides PDF
This slide represents dashboard to measure talent performance in organization. It includes talent applicant status, team training methods, talented candidate status, risk for loss of potential talent pool etc. Get a simple yet stunning designed KPI Dashboard To Measure Talent Performance Slides PDF. It is the best one to establish the tone in your meetings. It is an excellent way to make your presentations highly effective. So, download this PPT today from Slidegeeks and see the positive impacts. Our easy to edit KPI Dashboard To Measure Talent Performance Slides PDF can be your go-to option for all upcoming conferences and meetings. So, what are you waiting for Grab this template today.

Startup Business Financial Dashboard With Income Statement Portrait PDF
This slide represents dashboard showing financial position of the startup business. It shows details related to net profit margin, income and expenses, accounts payable and receivable, net profit, quick and current ratio etc. Showcasing this set of slides titled Startup Business Financial Dashboard With Income Statement Portrait PDF. The topics addressed in these templates are Accounts Receivable Income, Income And Expenses, Net Profit Margin. All the content presented in this PPT design is completely editable. Download it and make adjustments in color, background, font etc. as per your unique business setting.
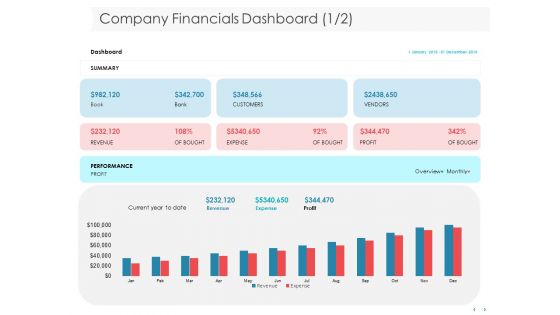
Managing CFO Services Company Financials Dashboard Ppt Styles Skills PDF
Presenting this set of slides with name managing cfo services company financials dashboard ppt styles skills pdf. The topics discussed in these slides are income, sales, expenses, profit and loss. This is a completely editable PowerPoint presentation and is available for immediate download. Download now and impress your audience.

Kpi Dashboard To Measure Talent Performance Brochure PDF
This slide represents dashboard to measure talent performance in organization. It includes talent applicant status, team training methods, talented candidate status, risk for loss of potential talent pool etc. Are you in need of a template that can accommodate all of your creative concepts This one is crafted professionally and can be altered to fit any style. Use it with Google Slides or PowerPoint. Include striking photographs, symbols, depictions, and other visuals. Fill, move around, or remove text boxes as desired. Test out color palettes and font mixtures. Edit and save your work, or work with colleagues. Download Kpi Dashboard To Measure Talent Performance Brochure PDF and observe how to make your presentation outstanding. Give an impeccable presentation to your group and make your presentation unforgettable.
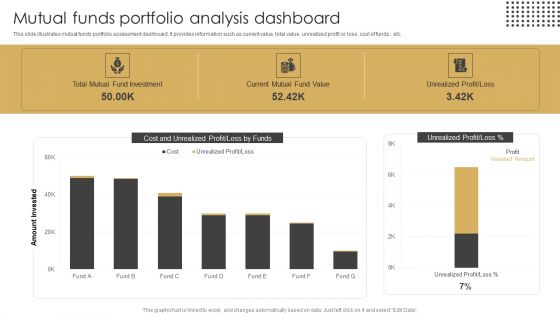
Mutual Funds Portfolio Analysis Dashboard Ppt Layouts Brochure PDF
This slide illustrates mutual funds portfolio assessment dashboard. It provides information such as current value, total value, unrealized profit or loss, cost of funds , etc. Showcasing this set of slides titled Mutual Funds Portfolio Analysis Dashboard Ppt Layouts Brochure PDF. The topics addressed in these templates are Total Mutual, Fund Investment, Current Mutual, Fund Value. All the content presented in this PPT design is completely editable. Download it and make adjustments in color, background, font etc. as per your unique business setting.

Financial Dashboard For Month Closing Income And Expenses Ideas PDF
This slide illustrates facts and figures related to month end financials of a corporation. It includes income statement graph, profit margin, income and expenditure graph etc.Showcasing this set of slides titled Financial Dashboard For Month Closing Income And Expenses Ideas PDF The topics addressed in these templates are Accounts Receivable, Income Statement, Expenditure All the content presented in this PPT design is completely editable. Download it and make adjustments in color, background, font etc. as per your unique business setting.

Financial Projecting Dashboard With Various KPI Themes Pdf
Following slide showcasing the dashboard on financial planning of an organization to generate maximum of revenue by reducing their cost. The KPI such as waterfall statement , income and expenditure, payable accounts , etc . Pitch your topic with ease and precision using this Financial Projecting Dashboard With Various KPI Themes Pdf. This layout presents information on Income Budget, Expenses Budget, Net Profit Margin. It is also available for immediate download and adjustment. So, changes can be made in the color, design, graphics or any other component to create a unique layout.

Recurring Income Generation Model Business Performance Dashboard Clipart PDF
The following slide display a business performance dashboard that highlights the average revenue per unit, customer Acquisition Cost and profit earned. Crafting an eye catching presentation has never been more straightforward. Let your presentation shine with this tasteful yet straightforward Recurring Income Generation Model Business Performance Dashboard Clipart PDF template. It offers a minimalistic and classy look that is great for making a statement. The colors have been employed intelligently to add a bit of playfulness while still remaining professional. Construct the ideal Recurring Income Generation Model Business Performance Dashboard Clipart PDF that effortlessly grabs the attention of your audience. Begin now and be certain to wow your customers.
Cryptocurrency Portfolio Tracking Dashboard Summary Cryptocurrency Management With Blockchain
This slide represents the cryptocurrency performance indicators for the individual. The key components include invested money, profit and loss, rate of investment ROI, current valuation of money, etc.Formulating a presentation can take up a lot of effort and time, so the content and message should always be the primary focus. The visuals of the PowerPoint can enhance the presenters message, so our Cryptocurrency Portfolio Tracking Dashboard Summary Cryptocurrency Management With Blockchain was created to help save time. Instead of worrying about the design, the presenter can concentrate on the message while our designers work on creating the ideal templates for whatever situation is needed. Slidegeeks has experts for everything from amazing designs to valuable content, we have put everything into Cryptocurrency Portfolio Tracking Dashboard Summary Cryptocurrency Management With Blockchain.
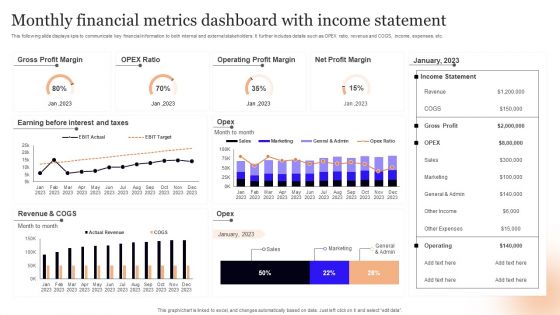
Monthly Financial Metrics Dashboard With Income Statement Infographics PDF
This following slide displays kpis to communicate key financial information to both internal and external stakeholders. It further includes details such as OPEX ratio, revenue and COGS, income, expenses, etc. Showcasing this set of slides titled Monthly Financial Metrics Dashboard With Income Statement Infographics PDF. The topics addressed in these templates are Gross Profit Margin, Taxes, Revenue. All the content presented in this PPT design is completely editable. Download it and make adjustments in color, background, font etc. as per your unique business setting.
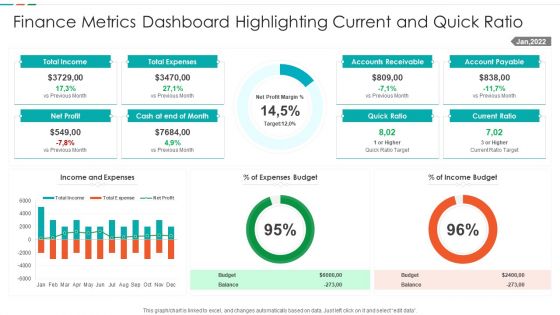
Finance Metrics Dashboard Highlighting Current And Quick Ratio Template PDF
This graph or chart is linked to excel, and changes automatically based on data. Just left click on it and select edit data. Showcasing this set of slides titled Finance Metrics Dashboard Highlighting Current And Quick Ratio Template PDF. The topics addressed in these templates are Total Income Budget, Total Expenses Balance, Net Profit Quick, Ratio Current Ratio. All the content presented in this PPT design is completely editable. Download it and make adjustments in color, background, font etc. as per your unique business setting.
Finance Metrics Dashboard Illustrating Account Payables Icons PDF
This graph or chart is linked to excel, and changes automatically based on data. Just left click on it and select edit data. Pitch your topic with ease and precision using this Total Income Budget, Total Expenses Balance, Net Profit Quick, Ratio Current Ratio. This layout presents information on Account Payable Age, Average Creditor Days, Cash On Hand. It is also available for immediate download and adjustment. So, changes can be made in the color, design, graphics or any other component to create a unique layout.

Network Service Assessment Monitoring Dashboard With Throughput Time Structure PDF
Mentioned slide outlines a KPI dashboard which can be used to monitor network performance. The kpis highlighted in the dashboard are call setup time, packet loss, throughput time, round trip time etc. Showcasing this set of slides titled Network Service Assessment Monitoring Dashboard With Throughput Time Structure PDF. The topics addressed in these templates are Network Service Assessment Monitoring Dashboard With Throughput Time. All the content presented in this PPT design is completely editable. Download it and make adjustments in color, background, font etc. as per your unique business setting.

Portfolio Risk Evaluation Dashboard With Regulatory Parameters Slides PDF
Pitch your topic with ease and precision using this Portfolio Risk Evaluation Dashboard With Regulatory Parameters Slides PDF. This layout presents information on Probability Of Default, Expected Loss, Credit Risk Rating. It is also available for immediate download and adjustment. So, changes can be made in the color, design, graphics or any other component to create a unique layout.
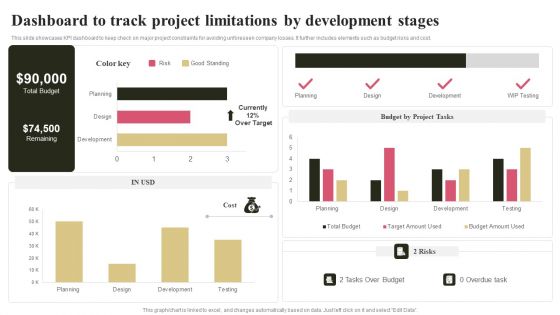
Dashboard To Track Project Limitations By Development Stages Ideas PDF
This slide showcases KPI dashboard to keep check on major project constraints for avoiding unforeseen company losses. It further includes elements such as budget risks and cost. Pitch your topic with ease and precision using this Dashboard To Track Project Limitations By Development Stages Ideas PDF. This layout presents information on Budget By Project Tasks, Risks. It is also available for immediate download and adjustment. So, changes can be made in the color, design, graphics or any other component to create a unique layout.

 Home
Home