Profit And Loss Dashboard
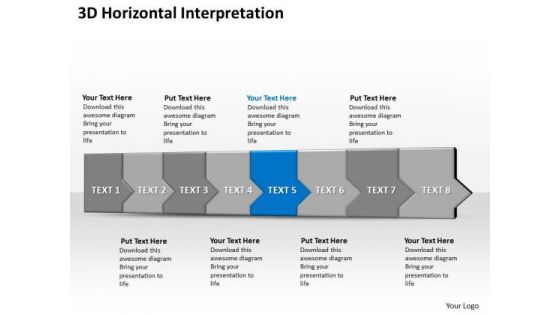
Ppt 3d Horizontal Illustration To Hold Off Marketing Losses Eight Steps PowerPoint Templates
PPT 3d horizontal illustration to hold off marketing losses eight steps PowerPoint Templates-The theme of this PowerPoint template is linear arrows. Use them to illustrate a stepwise process or a phase structure.-PPT 3d horizontal illustration to hold off marketing losses eight steps PowerPoint Templates-8 Steps, 8 Steps Diagram, Arrow, Artfulness, Chart, Circle, Circular, Circulation, Concept, Connection, Continuity, Correlate, Course, Diagram, Direction, Duplicate, Flow, Four, Iterate, Manage, Method, Order, Phase, Presentation, Procedure, Process, React, Recycle, Refresh, Relate, Repeat, Repetition, Report, Review, Section, Sequence, Simple, Stage, Step, Strategy, Success, Swirl, System, Work Flow
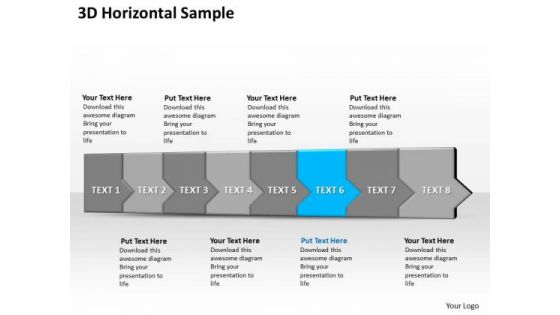
Ppt 3d Horizontal Illustration To Prohibit Marketing Losses Eight Steps PowerPoint Templates
PPT 3d horizontal illustration to prohibit marketing losses eight steps PowerPoint Templates-The theme of this PowerPoint template is linear arrows. Use them to illustrate a stepwise process or a phase structure.-PPT 3d horizontal illustration to prohibit marketing losses eight steps PowerPoint Templates-8 Steps, 8 Steps Diagram, Arrow, Artfulness, Chart, Circle, Circular, Circulation, Concept, Connection, Continuity, Correlate, Course, Diagram, Direction, Duplicate, Flow, Four, Iterate, Manage, Method, Order, Phase, Presentation, Procedure, Process, React, Recycle, Refresh, Relate, Repeat, Repetition, Report, Review, Section, Sequence, Simple, Stage, Step, Strategy, Success, Swirl, System, Work Flow

Ppt 3d Horizontal Illustration To Slow Down Marketing Losses Eight Steps PowerPoint Templates
PPT 3d horizontal illustration to slow down marketing losses eight steps PowerPoint Templates-The theme of this PowerPoint template is linear arrows. Use them to illustrate a stepwise process or a phase structure.-PPT 3d horizontal illustration to slow down marketing losses eight steps PowerPoint Templates-8 Steps, 8 Steps Diagram, Arrow, Artfulness, Chart, Circle, Circular, Circulation, Concept, Connection, Continuity, Correlate, Course, Diagram, Direction, Duplicate, Flow, Four, Iterate, Manage, Method, Order, Phase, Presentation, Procedure, Process, React, Recycle, Refresh, Relate, Repeat, Repetition, Report, Review, Section, Sequence, Simple, Stage, Step, Strategy, Success, Swirl, System, Work Flow

Steady Way To Prevent Production Losses 9 Steps Diagram Of Business Plan PowerPoint Templates
We present our steady way to prevent production losses 9 steps diagram of business plan PowerPoint templates.Use our Arrows PowerPoint Templates because, You have some great folks working with you, thinking with you. Use our Leadership PowerPoint Templates because, We provide the means to project your views. Use our Business PowerPoint Templates because, You have had your share of being a goldfish in a small bowl.You are ready to launch out and spread your wings Use our Symbol PowerPoint Templates because, As a result we often end up with errors. Use our Process and Flows PowerPoint Templates because,You can Start with the fundamental basic activities and slowly but surely hone them down to the top of the pyramid, the ultimate goal.Use these PowerPoint slides for presentations relating to Abstract, Action, Attach, Box, Business, Center, Chain, Chart, Color, Communication, Concept, Connection, Cube, Cycle, Data, Diagram, Flow, Globe, Horizontal, Idea, Illustration, Information, Interaction, Jigsaw, Join, Link, Pieces, Process, Puzzle, Relation, Relationship, Shape, Success. The prominent colors used in the PowerPoint template are Blue navy, Black, Gray. People tell us our steady way to prevent production losses 9 steps diagram of business plan PowerPoint templates are Beautiful. PowerPoint presentation experts tell us our Business PowerPoint templates and PPT Slides are Bright. PowerPoint presentation experts tell us our steady way to prevent production losses 9 steps diagram of business plan PowerPoint templates will impress their bosses and teams. Professionals tell us our Attach PowerPoint templates and PPT Slides are Sparkling. Professionals tell us our steady way to prevent production losses 9 steps diagram of business plan PowerPoint templates effectively help you save your valuable time. People tell us our Box PowerPoint templates and PPT Slides are Glamorous.

Steady Way To Prevent Production Losses 9 Steps Ppt Open Source Uml PowerPoint Slides
We present our steady way to prevent production losses 9 steps ppt open source uml PowerPoint Slides.Use our Arrows PowerPoint Templates because, The atmosphere in the worplace is electric. Use our Leadership PowerPoint Templates because,This diagram can be used to illustrate the logical path or system Use our Business PowerPoint Templates because,This diagram can set an example to enthuse your team with the passion and fervour of your ideas. Use our Symbol PowerPoint Templates because,You know your business and have a vision for it. Use our Process and Flows PowerPoint Templates because,This diagram helps you to develop your marketing strategy and communicate your enthusiasm and motivation to raise the bar.Use these PowerPoint slides for presentations relating to Abstract, Action, Attach, Box, Business, Center, Chain, Chart, Color, Communication, Concept, Connection, Cube, Cycle, Data, Diagram, Flow, Globe, Horizontal, Idea, Illustration, Information, Interaction, Jigsaw, Join, Link, Pieces, Process, Puzzle, Relation, Relationship, Shape, Success. The prominent colors used in the PowerPoint template are Blue navy, Black, Gray. People tell us our steady way to prevent production losses 9 steps ppt open source uml PowerPoint Slides are Quaint. PowerPoint presentation experts tell us our Color PowerPoint templates and PPT Slides are Nostalgic. PowerPoint presentation experts tell us our steady way to prevent production losses 9 steps ppt open source uml PowerPoint Slides are Beautiful. Professionals tell us our Box PowerPoint templates and PPT Slides are Second to none. Professionals tell us our steady way to prevent production losses 9 steps ppt open source uml PowerPoint Slides are Adorable. People tell us our Business PowerPoint templates and PPT Slides are Exuberant.
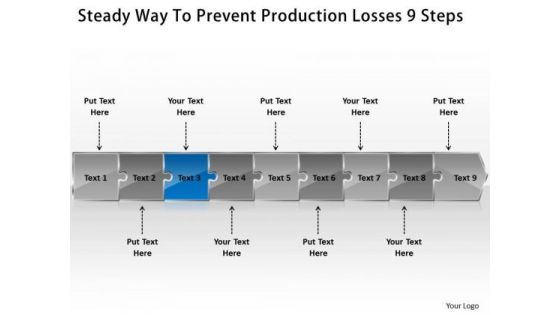
Steady Way To Prevent Production Losses 9 Steps Basic Process Flow Chart PowerPoint Templates
We present our steady way to prevent production losses 9 steps basic process flow chart PowerPoint templates.Use our Arrows PowerPoint Templates because,You can Employ the right colours for your brilliant ideas. Use our Leadership PowerPoint Templates because,Displaying your ideas and highlighting your ability will accelerate the growth of your company and yours. Use our Business PowerPoint Templates because,This layout helps you to bring some important aspects of your business process to the notice of all concerned. Streamline the flow of information across the board Use our Symbol PowerPoint Templates because,You can asked to strive to give true form to your great dream. Use our Process and Flows PowerPoint Templates because,You can gain the success to desired levels in one go.Use these PowerPoint slides for presentations relating to Abstract, Action, Attach, Box, Business, Center, Chain, Chart, Color, Communication, Concept, Connection, Cube, Cycle, Data, Diagram, Flow, Globe, Horizontal, Idea, Illustration, Information, Interaction, Jigsaw, Join, Link, Pieces, Process, Puzzle, Relation, Relationship, Shape, Success. The prominent colors used in the PowerPoint template are Blue, Black, Gray. People tell us our steady way to prevent production losses 9 steps basic process flow chart PowerPoint templates are Exuberant. PowerPoint presentation experts tell us our Color PowerPoint templates and PPT Slides are Pretty. PowerPoint presentation experts tell us our steady way to prevent production losses 9 steps basic process flow chart PowerPoint templates are Splendid. Professionals tell us our Attach PowerPoint templates and PPT Slides are Beautiful. Professionals tell us our steady way to prevent production losses 9 steps basic process flow chart PowerPoint templates are Ritzy. People tell us our Business PowerPoint templates and PPT Slides are Spectacular.

Steady Way To Prevent Production Losses 9 Steps What Is Flow Chart Used For PowerPoint Slides
We present our steady way to prevent production losses 9 steps what is flow chart used for PowerPoint Slides.Use our Arrows PowerPoint Templates because,you have the ability to judge Which out of late have been proving to be a hassle. Use our Leadership PowerPoint Templates because,This diagram can be used to illustrate the logical path or system Use our Business PowerPoint Templates because, A brainwave has occurred to you after review. You know just how to push the graph skyward Use our Symbol PowerPoint Templates because,This one depicts the popular chart. Use our Process and Flows PowerPoint Templates because,Your business and plans for its growth consist of processes that are highly co-related.Use these PowerPoint slides for presentations relating to Abstract, Action, Attach, Box, Business, Center, Chain, Chart, Color, Communication, Concept, Connection, Cube, Cycle, Data, Diagram, Flow, Globe, Horizontal, Idea, Illustration, Information, Interaction, Jigsaw, Join, Link, Pieces, Process, Puzzle, Relation, Relationship, Shape, Success. The prominent colors used in the PowerPoint template are Blue, Black, Gray. People tell us our steady way to prevent production losses 9 steps what is flow chart used for PowerPoint Slides are Royal. PowerPoint presentation experts tell us our Chart PowerPoint templates and PPT Slides are Great. PowerPoint presentation experts tell us our steady way to prevent production losses 9 steps what is flow chart used for PowerPoint Slides are Graceful. Professionals tell us our Center PowerPoint templates and PPT Slides are Amazing. Professionals tell us our steady way to prevent production losses 9 steps what is flow chart used for PowerPoint Slides are readymade to fit into any presentation structure. People tell us our Business PowerPoint templates and PPT Slides are Glamorous.
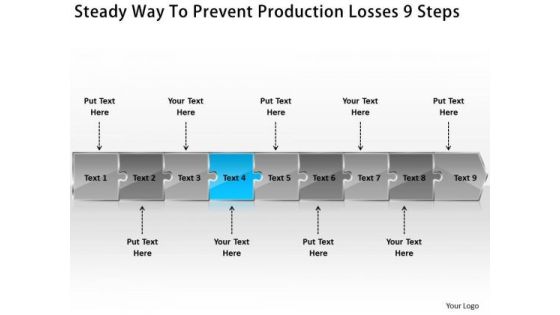
Steady Way To Prevent Production Losses 9 Steps Flow Chart Creator Online PowerPoint Slides
We present our steady way to prevent production losses 9 steps flow chart creator online PowerPoint Slides.Use our Arrows PowerPoint Templates because,These slides are the triggers of our growth. Use our Leadership PowerPoint Templates because,You can Educate your team with the attention to be paid. Use our Business PowerPoint Templates because, You have had a great year or so business wise. It is time to celebrate the efforts of your team Use our Symbol PowerPoint Templates because,You have the right arrows in your quiver. Use our Process and Flows PowerPoint Templates because,you have an idea of which you are sure.Use these PowerPoint slides for presentations relating to Abstract, Action, Attach, Box, Business, Center, Chain, Chart, Color, Communication, Concept, Connection, Cube, Cycle, Data, Diagram, Flow, Globe, Horizontal, Idea, Illustration, Information, Interaction, Jigsaw, Join, Link, Pieces, Process, Puzzle, Relation, Relationship, Shape, Success. The prominent colors used in the PowerPoint template are Blue light, Black, Gray. People tell us our steady way to prevent production losses 9 steps flow chart creator online PowerPoint Slides are Colorful. PowerPoint presentation experts tell us our Box PowerPoint templates and PPT Slides are designed by professionals PowerPoint presentation experts tell us our steady way to prevent production losses 9 steps flow chart creator online PowerPoint Slides are Nice. Professionals tell us our Color PowerPoint templates and PPT Slides are Nice. Professionals tell us our steady way to prevent production losses 9 steps flow chart creator online PowerPoint Slides have awesome images to get your point across. People tell us our Attach PowerPoint templates and PPT Slides are Appealing.

Steady Way To Prevent Production Losses 9 Steps Flow Chart Maker Online PowerPoint Templates
We present our steady way to prevent production losses 9 steps flow chart maker online PowerPoint templates.Use our Arrows PowerPoint Templates because, You have churned your mind and come up with effective ways and means to further refine it. Use our Leadership PowerPoint Templates because, Brilliant ideas are your forte. Use our Business PowerPoint Templates because,This layout helps you to bring some important aspects of your business process to the notice of all concerned. Streamline the flow of information across the board Use our Symbol PowerPoint Templates because, This diagram helps you to discuss each step slowly but surely move up the pyramid narrowing down to the best and most success oriented project. Use our Process and Flows PowerPoint Templates because, You can Transmit this concern to your staff using our helpful slides.Use these PowerPoint slides for presentations relating to Abstract, Action, Attach, Box, Business, Center, Chain, Chart, Color, Communication, Concept, Connection, Cube, Cycle, Data, Diagram, Flow, Globe, Horizontal, Idea, Illustration, Information, Interaction, Jigsaw, Join, Link, Pieces, Process, Puzzle, Relation, Relationship, Shape, Success. The prominent colors used in the PowerPoint template are Blue , Black, Gray. People tell us our steady way to prevent production losses 9 steps flow chart maker online PowerPoint templates are Exuberant. PowerPoint presentation experts tell us our Center PowerPoint templates and PPT Slides are Swanky. PowerPoint presentation experts tell us our steady way to prevent production losses 9 steps flow chart maker online PowerPoint templates are Detailed. Professionals tell us our Chain PowerPoint templates and PPT Slides are Appealing. Professionals tell us our steady way to prevent production losses 9 steps flow chart maker online PowerPoint templates are Endearing. People tell us our Chart PowerPoint templates and PPT Slides are Magnificent.
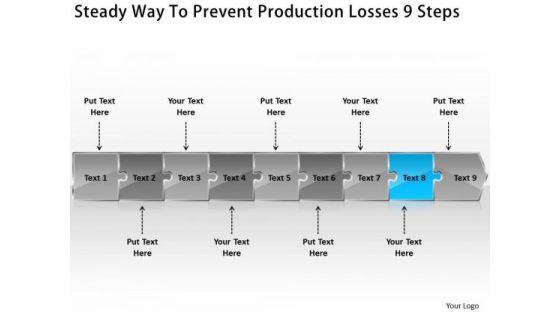
Steady Way To Prevent Production Losses 9 Steps Schematic Design PowerPoint Slides
We present our steady way to prevent production losses 9 steps schematic design PowerPoint Slides.Use our Arrows PowerPoint Templates because,Sprout your thoughts into the minds of your colleagues. Use our Leadership PowerPoint Templates because,Your business and plans for its growth consist of processes that are highly co-related. Use our Business PowerPoint Templates because, You can see clearly through to the bigger bowl ahead. Time your jump to perfection and hit the nail on the head Use our Symbol PowerPoint Templates because,you can Master them all and you have it made. Use our Process and Flows PowerPoint Templates because,Educate your staff on the means to provide the required support for speedy recovery.Use these PowerPoint slides for presentations relating to Abstract, Action, Attach, Box, Business, Center, Chain, Chart, Color, Communication, Concept, Connection, Cube, Cycle, Data, Diagram, Flow, Globe, Horizontal, Idea, Illustration, Information, Interaction, Jigsaw, Join, Link, Pieces, Process, Puzzle, Relation, Relationship, Shape, Success. The prominent colors used in the PowerPoint template are Blue, Black, Gray. People tell us our steady way to prevent production losses 9 steps schematic design PowerPoint Slides are Versatile. PowerPoint presentation experts tell us our Box PowerPoint templates and PPT Slides are Ritzy. PowerPoint presentation experts tell us our steady way to prevent production losses 9 steps schematic design PowerPoint Slides are Stylish. Professionals tell us our Box PowerPoint templates and PPT Slides are Ritzy. Professionals tell us our steady way to prevent production losses 9 steps schematic design PowerPoint Slides are Beautiful. People tell us our Center PowerPoint templates and PPT Slides are Ritzy.
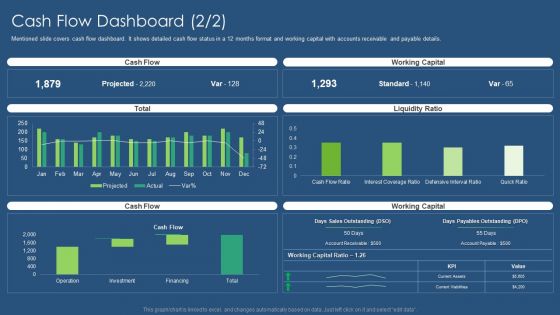
Sustainability Calculation With KPI Cash Flow Dashboard Liquidity Ratio Inspiration PDF Introduction PDF
Following slide covers cash flow dashboard covering details like beginning cash on hand, cash going in, cash going out, profit loss and ending cash on hand. It also includes detail of accounts receivable and payable. Deliver an awe inspiring pitch with this creative sustainability calculation with kpi cash flow dashboard cash designs pdf bundle. Topics like beginning cash on hand, cash going out, profit and loss, ending cash on hand can be discussed with this completely editable template. It is available for immediate download depending on the needs and requirements of the user.
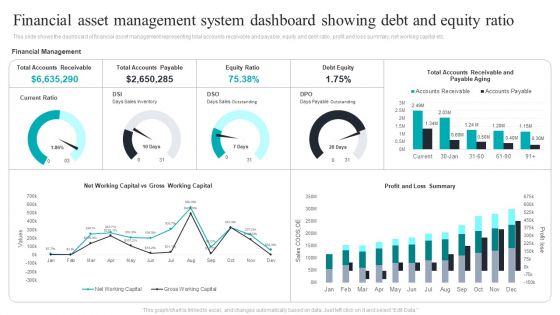
Financial Asset Management System Dashboard Showing Debt And Equity Ratio Graphics PDF
This slide shows the dashboard of financial asset management representing total accounts receivable and payable, equity and debt ratio, profit and loss summary, net working capital etc. Showcasing this set of slides titled Financial Asset Management System Dashboard Showing Debt And Equity Ratio Graphics PDF. The topics addressed in these templates are Financial Asset, Management System, Debt And Equity Ratio. All the content presented in this PPT design is completely editable. Download it and make adjustments in color, background, font etc. as per your unique business setting.

Enterprise Risk Management Dashboard With Compliance Communication Strategies And Action Plan Infographics PDF
This slide shows enterprise risk management dashboard with compliance communication and action plan. It also includes details such as top risks, loss events, actions, compliance, etc. Showcasing this set of slides titled Enterprise Risk Management Dashboard With Compliance Communication Strategies And Action Plan Infographics PDF. The topics addressed in these templates are Top 10 Risks, Loss Events, Actions. All the content presented in this PPT design is completely editable. Download it and make adjustments in color, background, font etc. as per your unique business setting.

Promotion Guide To Advertise Brand On Youtube Youtube Marketing Dashboard Sample PDF
This slide showcases the YouTube marketing dashboard which includes subscriber gained vs loss list which includes traffic sources and lasted uploaded videos data.Deliver and pitch your topic in the best possible manner with this Promotion Guide To Advertise Brand On Youtube Youtube Marketing Dashboard Sample PDF Use them to share invaluable insights on Youtube Marketing Dashboard Highlighting Traffic Source And Average Views and impress your audience. This template can be altered and modified as per your expectations. So, grab it now.

Marketing Manual For Product Promotion On Youtube Channel Youtube Marketing Dashboard Highlighting Traffic Professional PDF
This slide showcases the YouTube marketing dashboard which includes subscriber gained vs loss list which includes traffic sources and lasted uploaded videos data.Deliver an awe inspiring pitch with this creative Marketing Manual For Product Promotion On Youtube Channel Youtube Marketing Dashboard Highlighting Traffic Professional PDF bundle. Topics like Direct Traffic, External Sources, Suggested Video can be discussed with this completely editable template. It is available for immediate download depending on the needs and requirements of the user.
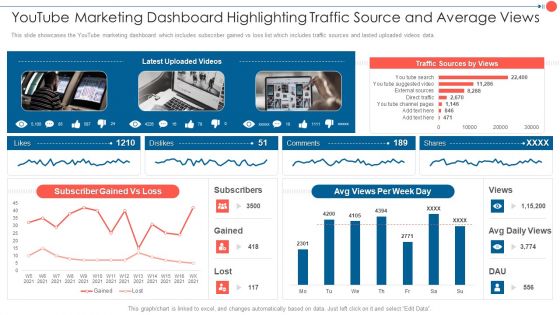
Youtube Advertising Techniques Youtube Marketing Dashboard Highlighting Traffic Source Summary PDF
This slide showcases the YouTube marketing dashboard which includes subscriber gained vs loss list which includes traffic sources and lasted uploaded videos data. Deliver an awe inspiring pitch with this creative Youtube Advertising Techniques Youtube Marketing Dashboard Highlighting Traffic Source Summary PDF bundle. Topics like Subscriber Gained, Traffic Sources, Avg Views can be discussed with this completely editable template. It is available for immediate download depending on the needs and requirements of the user.
CRM System Competitive Dashboard With Sales Pipeline Ppt PowerPoint Presentation Icon Outfit PDF
Showcasing this set of slides titled crm system competitive dashboard with sales pipeline ppt powerpoint presentation icon outfit pdf. The topics addressed in these templates are sales forecast by competitor, win loss report, open opportunity revenue by competitor, sales pipeline by sales rep, competitor. All the content presented in this PPT design is completely editable. Download it and make adjustments in color, background, font etc. as per your unique business setting.
Youtube Marketing Dashboard Highlighting Traffic Source And Average Views Icons PDF
This slide showcases the youtube marketing dashboard which includes subscriber gained vs loss list which includes traffic sources and lasted uploaded videos data.Create an editable Youtube Marketing Dashboard Highlighting Traffic Source And Average Views Icons PDF that communicates your idea and engages your audience. Whether you are presenting a business or an educational presentation, pre-designed presentation templates help save time. Youtube Marketing Dashboard Highlighting Traffic Source And Average Views Icons PDF is highly customizable and very easy to edit, covering many different styles from creative to business presentations. Slidegeeks has creative team members who have crafted amazing templates. So, go and get them without any delay.

Data Theft And Breach Threats Monitoring Dashboard Ppt Outline Designs PDF
This slide covers dashboard to monitor top data breaches and loss of confidential data in organization. It includes KPIs such percentage of data risks detected, number of data risks, data risk analysis, response progress for data risks, data risk ratings. Showcasing this set of slides titled Data Theft And Breach Threats Monitoring Dashboard Ppt Outline Designs PDF. The topics addressed in these templates are Number Risk Threshold, Data Analysts Progress, Action Plan Breakdown. All the content presented in this PPT design is completely editable. Download it and make adjustments in color, background, font etc. as per your unique business setting.
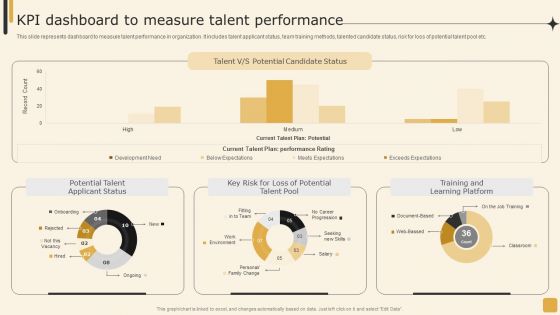
Kpi Dashboard To Measure Talent Performance Employee Performance Management Tactics Professional PDF
This slide represents dashboard to measure talent performance in organization. It includes talent applicant status, team training methods, talented candidate status, risk for loss of potential talent pool etc.The Kpi Dashboard To Measure Talent Performance Employee Performance Management Tactics Professional PDF is a compilation of the most recent design trends as a series of slides. It is suitable for any subject or industry presentation, containing attractive visuals and photo spots for businesses to clearly express their messages. This template contains a variety of slides for the user to input data, such as structures to contrast two elements, bullet points, and slides for written information. Slidegeeks is prepared to create an impression.

Workforce Management Strategies For Effective Hiring Process Kpi Dashboard To Measure Talent Performance Formats PDF
This slide represents dashboard to measure talent performance in organization. It includes talent applicant status, team training methods, talented candidate status, risk for loss of potential talent pool etc. Deliver an awe inspiring pitch with this creative Workforce Management Strategies For Effective Hiring Process Kpi Dashboard To Measure Talent Performance Formats PDF bundle. Topics like Potential Candidate, Talent Performance, Learning Platform can be discussed with this completely editable template. It is available for immediate download depending on the needs and requirements of the user.

Talent Management Optimization With Workforce Staffing Kpi Dashboard To Measure Talent Performance Sample PDF
This slide represents dashboard to measure talent performance in organization. It includes talent applicant status, team training methods, talented candidate status, risk for loss of potential talent pool etc. If your project calls for a presentation, then Slidegeeks is your go to partner because we have professionally designed, easy to edit templates that are perfect for any presentation. After downloading, you can easily edit Talent Management Optimization With Workforce Staffing Kpi Dashboard To Measure Talent Performance Sample PDF and make the changes accordingly. You can rearrange slides or fill them with different images. Check out all the handy templates.

Lean Operational Excellence Strategy Manufacturing Dashboard To Check Production System Efficiency Pictures PDF
This slide showcases manufacturing dashboard to track KPIs defined under lean and kaizen process improvement plans. Key performance metrics included here are TEEP, OEE, loading time, production quality, losses by hours, losses by categories etc. Pitch your topic with ease and precision using this Lean Operational Excellence Strategy Manufacturing Dashboard To Check Production System Efficiency Pictures PDF. This layout presents information on Loading, Availability, Performance. It is also available for immediate download and adjustment. So, changes can be made in the color, design, graphics or any other component to create a unique layout.
Erp Management Dashboard For Tracking Gross Erp And Digital Transformation For Maximizing DT SS V
This slide presents a ERP integrated finance monitoring dashboard that helps in tracking gross and net profit margin of business. It monitors KPIs such as balance, quick ratio, current ratio, total income, total expenses, accounts payable.Here you can discover an assortment of the finest PowerPoint and Google Slides templates. With these templates, you can create presentations for a variety of purposes while simultaneously providing your audience with an eye-catching visual experience. Download Erp Management Dashboard For Tracking Gross Erp And Digital Transformation For Maximizing DT SS V to deliver an impeccable presentation. These templates will make your job of preparing presentations much quicker, yet still, maintain a high level of quality. Slidegeeks has experienced researchers who prepare these templates and write high-quality content for you. Later on, you can personalize the content by editing the Erp Management Dashboard For Tracking Gross Erp And Digital Transformation For Maximizing DT SS V.

Property Investing Management Dashboard For Investing In Rental Services Template PDF
The following slide showcases dashboard to track real estate investing about how much rent is paid on time and on arrears. It presents information related to occupancy rate, vacancy loss, cost, revenue, etc. Showcasing this set of slides titled Property Investing Management Dashboard For Investing In Rental Services Template PDF. The topics addressed in these templates are Cost, Property Management, Revenue. All the content presented in this PPT design is completely editable. Download it and make adjustments in color, background, font etc. as per your unique business setting.
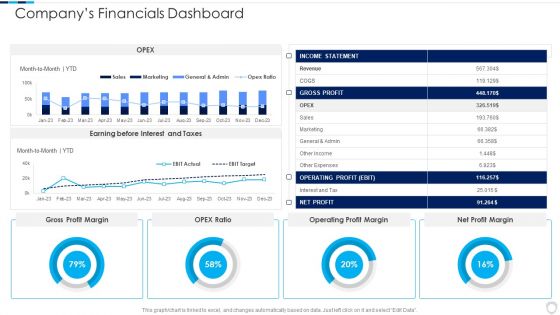
Financial Report Of An IT Firm Companys Financials Dashboard Infographics PDF
Deliver an awe inspiring pitch with this creative Financial Report Of An IT Firm Companys Financials Dashboard Infographics PDF bundle. Topics like Operating Profit, Gross Profit, Income Statement can be discussed with this completely editable template. It is available for immediate download depending on the needs and requirements of the user.

Mastering Blockchain Wallets Dashboard To Track Crypto Balance In Desktop Wallet BCT SS V
This slide covers dashboard to determine users balances using crypto wallets. The purpose of this template is to provide overview on crypto balance, trends on bitcoins, ethereum, binance, luna along with portfolio balances etc. This Mastering Blockchain Wallets Dashboard To Track Crypto Balance In Desktop Wallet BCT SS V is perfect for any presentation, be it in front of clients or colleagues. It is a versatile and stylish solution for organizing your meetings. The Mastering Blockchain Wallets Dashboard To Track Crypto Balance In Desktop Wallet BCT SS V features a modern design for your presentation meetings. The adjustable and customizable slides provide unlimited possibilities for acing up your presentation. Slidegeeks has done all the homework before launching the product for you. So, do not wait, grab the presentation templates today

Cloud Intelligence Framework For Application Consumption Financial Losses To The Organizations Due To Security Issues Mockup PDF
The slide provides total financial losses from the year 2017 to 2021 reported by the organizations in United states along with the key reasons behind those losses. Deliver an awe inspiring pitch with this creative cloud intelligence framework for application consumption financial losses to the organizations due to security issues mockup pdf bundle. Topics like security vulnerabilities, primary reasons for the growing, physical theft of a data-carrying device, 2016 to 2020 can be discussed with this completely editable template. It is available for immediate download depending on the needs and requirements of the user.
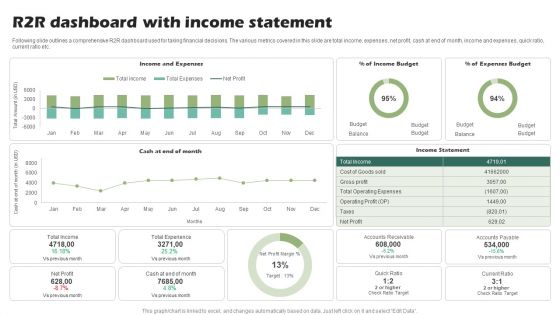
R2R Dashboard With Income Statement Ppt PowerPoint Presentation Show Slide Download PDF
Following slide outlines a comprehensive R2R dashboard used for taking financial decisions. The various metrics covered in this slide are total income, expenses, net profit, cash at end of month, income and expenses, quick ratio, current ratio etc.Showcasing this set of slides titled R2R Dashboard With Income Statement Ppt PowerPoint Presentation Show Slide Download PDF. The topics addressed in these templates are Operating Expenses, Total Experience, Accounts Receivable. All the content presented in this PPT design is completely editable. Download it and make adjustments in color, background, font etc. as per your unique business setting.

Cloud Kitchen Business Performance Management Dashboard Global Virtual Restaurant Structure Pdf
This slide highlights a dashboard to track and manage performance progress of a dark kitchen business. It showcases components such as income, expense, order rate, activity, total order complete, total order delivered, total order cancelled, order pending and popular food. Crafting an eye-catching presentation has never been more straightforward. Let your presentation shine with this tasteful yet straightforward Cloud Kitchen Business Performance Management Dashboard Global Virtual Restaurant Structure Pdf template. It offers a minimalistic and classy look that is great for making a statement. The colors have been employed intelligently to add a bit of playfulness while still remaining professional. Construct the ideal Cloud Kitchen Business Performance Management Dashboard Global Virtual Restaurant Structure Pdf that effortlessly grabs the attention of your audience. Begin now and be certain to wow your customers.

Degree Of Operational Leverage Dashboard With Income Statement Ppt Infographics Layout PDF
This slide illustrates graphical representation of company revenue and income statement. It includes monthly revenue, revenue by products, revenue by country etc. Pitch your topic with ease and precision using this Degree Of Operational Leverage Dashboard With Income Statement Ppt Infographics Layout PDF. This layout presents information on Monthly Revenue, Income Statement, Product. It is also available for immediate download and adjustment. So, changes can be made in the color, design, graphics or any other component to create a unique layout.

Venture Capitalist Control Board Private Equity Dashboard For Financial Review Of Company Portfolio Information PDF
Presenting this set of slides with name venture capitalist control board private equity dashboard for financial review of company portfolio information pdf. The topics discussed in these slides are contribution margin, margin analysis, income statement, dashboards controls. This is a completely editable PowerPoint presentation and is available for immediate download. Download now and impress your audience.
Dashboard For Reverse Proxy Performance Tracking Reverse Proxy For Load Balancing Slides PDF
This slide represents the dashboard for reverse proxy performance tracking by covering details of CPU load, available memory, and connections.Deliver an awe inspiring pitch with this creative Dashboard For Reverse Proxy Performance Tracking Reverse Proxy For Load Balancing Slides PDF bundle. Topics like Dashboard For Reverse, Proxy Performance, Tracking can be discussed with this completely editable template. It is available for immediate download depending on the needs and requirements of the user.

Mastering Blockchain Wallets Dashboard To Track Users Wallet Transactions BCT SS V
This slide covers dashboard to evaluate users transactions using crypto wallets. The purpose of this template is to provide an overview on crypto balance, market scenario, latest transactions, trends, etc. Welcome to our selection of the Mastering Blockchain Wallets Dashboard To Track Users Wallet Transactions BCT SS V. These are designed to help you showcase your creativity and bring your sphere to life. Planning and Innovation are essential for any business that is just starting out. This collection contains the designs that you need for your everyday presentations. All of our PowerPoints are 100Percent editable, so you can customize them to suit your needs. This multi-purpose template can be used in various situations. Grab these presentation templates today.

Techniques To Optimize UX Customer Support Service Analysis Dashboard Template PDF
This slide exhibits customer service dashboard to improve visibility. The dashboard includes resolved and active cases, incoming cases by subject, priority, SLA status and age, CSAT and escalated case volume. Crafting an eye-catching presentation has never been more straightforward. Let your presentation shine with this tasteful yet straightforward Techniques To Optimize UX Customer Support Service Analysis Dashboard Template PDF template. It offers a minimalistic and classy look that is great for making a statement. The colors have been employed intelligently to add a bit of playfulness while still remaining professional. Construct the ideal Techniques To Optimize UX Customer Support Service Analysis Dashboard Template PDF that effortlessly grabs the attention of your audience Begin now and be certain to wow your customers.
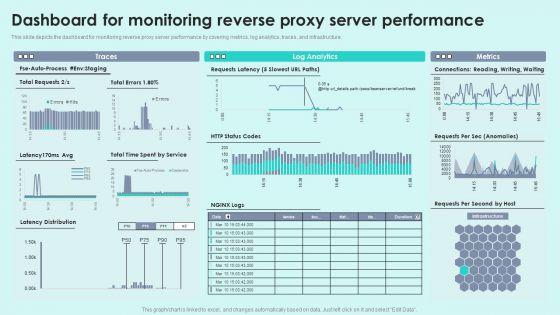
Dashboard For Monitoring Reverse Proxy Server Performance Reverse Proxy For Load Balancing Structure PDF
This slide depicts the dashboard for monitoring reverse proxy server performance by covering metrics, log analytics, traces, and infrastructure.Deliver and pitch your topic in the best possible manner with this Dashboard For Monitoring Reverse Proxy Server Performance Reverse Proxy For Load Balancing Structure PDF. Use them to share invaluable insights on Connections, Reading, Writing and impress your audience. This template can be altered and modified as per your expectations. So, grab it now.
Patient Healthcare Online Transformation Dashboard Ppt PowerPoint Presentation Icon Example File PDF
This slide displays the dashboard depicting the results of patients after the digital transformation. It includes the daily activity of the patients on the app, appointments, water balance, etc. Pitch your topic with ease and precision using this Patient Healthcare Online Transformation Dashboard Ppt PowerPoint Presentation Icon Example File PDF. This layout presents information on General Health, Water Balance, Transformation Dashboard. It is also available for immediate download and adjustment. So, changes can be made in the color, design, graphics or any other component to create a unique layout.
Environmental Assessment Financial Dashboard For Business Impact Tracking Ppt Layouts Guidelines PDF
This slide shows financial dashboard for business impact tracking with key performance indicators like quick ratio, current ratio, monthly cash flow etc Deliver and pitch your topic in the best possible manner with this environmental assessment financial dashboard for business impact tracking ppt layouts guidelines pdf. Use them to share invaluable insights on sales outstanding, cash balance, accounts payable and impress your audience. This template can be altered and modified as per your expectations. So, grab it now.
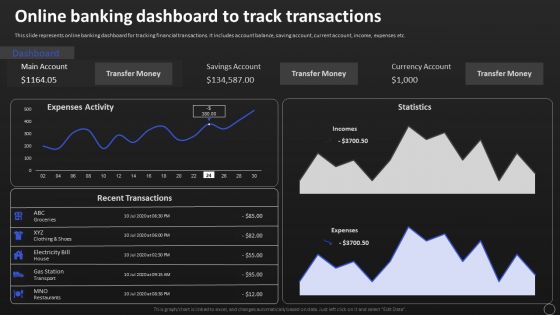
Net Banking Channel And Service Management Online Banking Dashboard To Track Transactions Professional PDF
This slide represents online banking dashboard for tracking financial transactions. It includes account balance, saving account, current account, income, expenses etc. Boost your pitch with our creative Net Banking Channel And Service Management Online Banking Dashboard To Track Transactions Professional PDF. Deliver an awe inspiring pitch that will mesmerize everyone. Using these presentation templates you will surely catch everyones attention. You can browse the ppts collection on our website. We have researchers who are experts at creating the right content for the templates. So you dont have to invest time in any additional work. Just grab the template now and use them.

Stock Market Research Report Organization Performance Dashboard For Equity Research Slides PDF
Deliver an awe-inspiring pitch with this creative stock market research report organization performance dashboard for equity research slides pdf bundle. Topics like balance sheet, return on assets, working capital ratio, return on equity, debt equity ratio can be discussed with this completely editable template. It is available for immediate download depending on the needs and requirements of the user.

Business Dashboard Showing Return On Assests Ppt PowerPoint Presentation Show Graphic Images PDF
Presenting this set of slides with name business dashboard showing return on assests ppt powerpoint presentation show graphic images pdf. The topics discussed in these slides are return on assets, working capital ratio, balance sheet, return on equity, debt equity ratio. This is a completely editable PowerPoint presentation and is available for immediate download. Download now and impress your audience.

Using Balanced Scorecard Strategy Maps Drive Performance Dashboard Ppt Styles Themes PDF
Presenting this set of slides with name using balanced scorecard strategy maps drive performance dashboard ppt styles themes pdf. The topics discussed in these slides are financial perspective, customer perspective, internal perspective, learning and growth perspective. This is a completely editable PowerPoint presentation and is available for immediate download. Download now and impress your audience.

Balanced Scorecard Outline Performance Dashboard Ppt PowerPoint Presentation Outline Slides PDF
Presenting this set of slides with name balanced scorecard outline performance dashboard ppt powerpoint presentation outline slides pdf. The topics discussed in these slides are financial perspective, customer perspective, internal perspective, learning and growth perspective, actual, target, trade. This is a completely editable PowerPoint presentation and is available for immediate download. Download now and impress your audience.

Staff Turnover Ratio BSC Employee Turnover Rate Balanced Scorecard Dashboard Professional PDF
Deliver an awe inspiring pitch with this creative staff turnover ratio bsc employee turnover rate balanced scorecard dashboard professional pdf bundle. Topics like employees, hiring, termination, absenteeism, performance, trainings can be discussed with this completely editable template. It is available for immediate download depending on the needs and requirements of the user.

Cash Management Dashboard With Sales Outstanding And Liquidity Ratio Analysis Information PDF
This showcases dashboard that can help organization in cash management and track KPIs to evaluate the financial performance of company. It key components are liquidity ratios, cash balance. days sales outstanding, days inventory outstanding and days payable outstanding. Pitch your topic with ease and precision using this Cash Management Dashboard With Sales Outstanding And Liquidity Ratio Analysis Information PDF. This layout presents information on Cash Conversion, Working Capital, Cash Balance. It is also available for immediate download and adjustment. So, changes can be made in the color, design, graphics or any other component to create a unique layout.

Facts Assessment Business Intelligence KPI Dashboard Assets Ppt PowerPoint Presentation Slides Show PDF
Presenting this set of slides with name facts assessment business intelligence kpi dashboard assets ppt powerpoint presentation slides show pdf. The topics discussed in these slides are expenses class, top 5 accounts receivables balance, assets profile, working capital, checking savings, monthly revenues and expenses. This is a completely editable PowerPoint presentation and is available for immediate download. Download now and impress your audience.

Effective Financial Planning Assessment Techniques Performance Kpi Dashboard To Measure Financial Graphics PDF
The following slide outlines a comprehensive key performance indicator KPI dashboard highlighting different financial metrics. The KPIs are quick and current ratio, cash balance, days sales outstanding etc. The best PPT templates are a great way to save time, energy, and resources. Slidegeeks have 100 precent editable powerpoint slides making them incredibly versatile. With these quality presentation templates, you can create a captivating and memorable presentation by combining visually appealing slides and effectively communicating your message. Download Effective Financial Planning Assessment Techniques Performance Kpi Dashboard To Measure Financial Graphics PDF from Slidegeeks and deliver a wonderful presentation.

Financial Forecast And Essential Metrics Dashboard Showing Cash Management Designs PDF
This slide contains the projections of the company financials to predict the future position so that better decisions could be taken for the growth prospective. It also includes ratios, cash balance, inventory analysis , etc. Showcasing this set of slides titled Financial Forecast And Essential Metrics Dashboard Showing Cash Management Designs PDF. The topics addressed in these templates are Days Sales Outstanding, Cash Management Dashboard, Days Inventory Outstanding. All the content presented in this PPT design is completely editable. Download it and make adjustments in color, background, font etc. as per your unique business setting.
Dashboard For Domestic Budget Planning And Management Ppt PowerPoint Presentation Icon Maker PDF
This slide showcases a dashboard for domestic planning and efficient spending. Its key elements are total receipts, total payments, receipts classification, expenses classification, cash transactions, current cash balance and cash transactions. Showcasing this set of slides titled Dashboard For Domestic Budget Planning And Management Ppt PowerPoint Presentation Icon Maker PDF. The topics addressed in these templates are Total Receipts, Total Payments, Cash Transactions. All the content presented in this PPT design is completely editable. Download it and make adjustments in color, background, font etc. as per your unique business setting.

Introduction To Digital Banking Services Metric Dashboard To Track Internet Banking Activities Download PDF
This slide represents KPI dashboard showcasing metrics for internet banking enabling customer to track progress. It includes account balance, income, expenditure, loan etc. Slidegeeks is here to make your presentations a breeze with Introduction To Digital Banking Services Metric Dashboard To Track Internet Banking Activities Download PDF With our easy to use and customizable templates, you can focus on delivering your ideas rather than worrying about formatting. With a variety of designs to choose from, you are sure to find one that suits your needs. And with animations and unique photos, illustrations, and fonts, you can make your presentation pop. So whether you are giving a sales pitch or presenting to the board, make sure to check out Slidegeeks first.

Firm Productivity Administration Business Intelligence KPI Dashboard Assets Ppt PowerPoint Presentation Slides Background Designs PDF
Presenting this set of slides with name firm productivity administration business intelligence kpi dashboard assets ppt powerpoint presentation slides background designs pdf. The topics discussed in these slides are expenses class, top 5 accounts receivables balance, assets profile, working capital, checking savings, monthly revenues and expenses. This is a completely editable PowerPoint presentation and is available for immediate download. Download now and impress your audience.

Enterprise Problem Solving And Intellect Business Intelligence KPI Dashboard Profile Ppt PowerPoint Presentation Summary Structure PDF
Presenting this set of slides with name enterprise problem solving and intellect business intelligence kpi dashboard profile ppt powerpoint presentation summary structure pdf. The topics discussed in these slides are expenses class, top 5 accounts receivables balance, assets profile, working capital, checking savings, monthly revenues and expenses. This is a completely editable PowerPoint presentation and is available for immediate download. Download now and impress your audience.
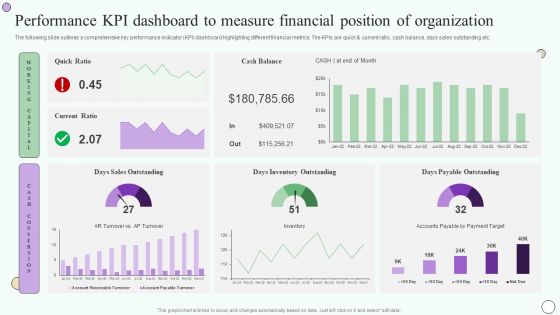
Estimating Business Overall Performance Kpi Dashboard To Measure Financial Position Inspiration PDF
The following slide outlines a comprehensive key performance indicator KPI dashboard highlighting different financial metrics. The KPIs are quick and current ratio, cash balance, days sales outstanding etc. Welcome to our selection of the Estimating Business Overall Performance Kpi Dashboard To Measure Financial Position Inspiration PDF. These are designed to help you showcase your creativity and bring your sphere to life. Planning and Innovation are essential for any business that is just starting out. This collection contains the designs that you need for your everyday presentations. All of our PowerPoints are 100 percent editable, so you can customize them to suit your needs. This multi-purpose template can be used in various situations. Grab these presentation templates today.

Overview Of Organizational Performance Kpi Dashboard To Measure Financial Position Sample PDF
The following slide outlines a comprehensive key performance indicator KPI dashboard highlighting different financial metrics. The KPIs are quick and current ratio, cash balance, days sales outstanding etc. Welcome to our selection of the Overview Of Organizational Performance Kpi Dashboard To Measure Financial Position Sample PDF. These are designed to help you showcase your creativity and bring your sphere to life. Planning and Innovation are essential for any business that is just starting out. This collection contains the designs that you need for your everyday presentations. All of our PowerPoints are 100 percent editable, so you can customize them to suit your needs. This multi-purpose template can be used in various situations. Grab these presentation templates today.
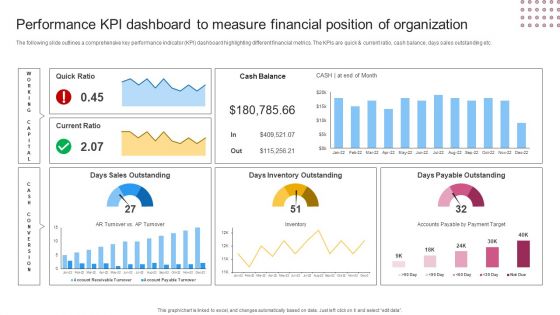
Performance KPI Dashboard To Measure Financial Position Of Organization Pictures PDF
The following slide outlines a comprehensive key performance indicator KPI dashboard highlighting different financial metrics. The KPIs are quick and current ratio, cash balance, days sales outstanding etc. Slidegeeks is here to make your presentations a breeze with Performance KPI Dashboard To Measure Financial Position Of Organization Pictures PDF With our easy to use and customizable templates, you can focus on delivering your ideas rather than worrying about formatting. With a variety of designs to choose from, you are sure to find one that suits your needs. And with animations and unique photos, illustrations, and fonts, you can make your presentation pop. So whether you are giving a sales pitch or presenting to the board, make sure to check out Slidegeeks first.
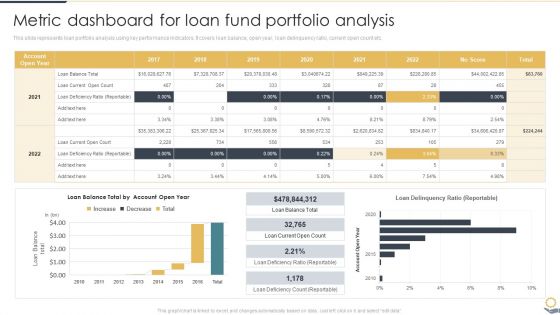
Metric Dashboard For Loan Fund Portfolio Analysis Portfolio Investment Analysis Formats PDF
This slide represents loan portfolio analysis using key performance indicators. It covers loan balance, open year, loan delinquency ratio, current open count etc.From laying roadmaps to briefing everything in detail, our templates are perfect for you. You can set the stage with your presentation slides. All you have to do is download these easy-to-edit and customizable templates. Metric Dashboard For Loan Fund Portfolio Analysis Portfolio Investment Analysis Formats PDF will help you deliver an outstanding performance that everyone would remember and praise you for. Do download this presentation today.

Company Financial Performance Indicators Dashboard With Liquidity And Turnover Ratios Formats PDF
This graph or chart is linked to excel, and changes automatically based on data. Just left click on it and select Edit Data. Pitch your topic with ease and precision using this Company Financial Performance Indicators Dashboard With Liquidity And Turnover Ratios Formats PDF. This layout presents information on Cash Balance, Days Inventory Outstanding, Days Payable Outstanding. It is also available for immediate download and adjustment. So, changes can be made in the color, design, graphics or any other component to create a unique layout.
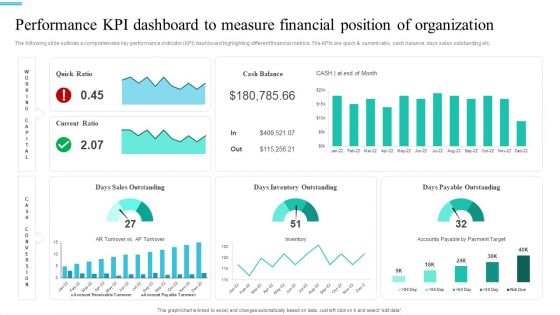
Monetary Planning And Evaluation Guide Performance KPI Dashboard To Measure Financial Position Of Organization Ppt File Slides PDF
The following slide outlines a comprehensive key performance indicator KPI dashboard highlighting different financial metrics. The KPIs are quick and current ratio, cash balance, days sales outstanding etc. The best PPT templates are a great way to save time, energy, and resources. Slidegeeks have 100 percent editable powerpoint slides making them incredibly versatile. With these quality presentation templates, you can create a captivating and memorable presentation by combining visually appealing slides and effectively communicating your message. Download Monetary Planning And Evaluation Guide Performance KPI Dashboard To Measure Financial Position Of Organization Ppt File Slides PDF from Slidegeeks and deliver a wonderful presentation.

Adjusting Financial Strategies And Planning Quarterly Income Statement For Monitoring Business Profitability Infographics PDF
This slide provides glimpse about quarterly profit and loss statement that can help our business to calculate net profit or loss. It includes revenue, net sales, cost of goods sold, operating expenses, operating profit, etc. The Adjusting Financial Strategies And Planning Quarterly Income Statement For Monitoring Business Profitability Infographics PDF is a compilation of the most recent design trends as a series of slides. It is suitable for any subject or industry presentation, containing attractive visuals and photo spots for businesses to clearly express their messages. This template contains a variety of slides for the user to input data, such as structures to contrast two elements, bullet points, and slides for written information. Slidegeeks is prepared to create an impression.
Product Manufacturing Dashboards Ppt Icon Inspiration PDF
Following slide shows product manufacturing dashboard. This includes production rate, overall productivity, unit loss and operators availability status.Deliver and pitch your topic in the best possible manner with this product manufacturing dashboards ppt icon inspiration pdf. Use them to share invaluable insights on overall plant productivity, overall productivity, productivity and impress your audience. This template can be altered and modified as per your expectations. So, grab it now.

 Home
Home