Percentage
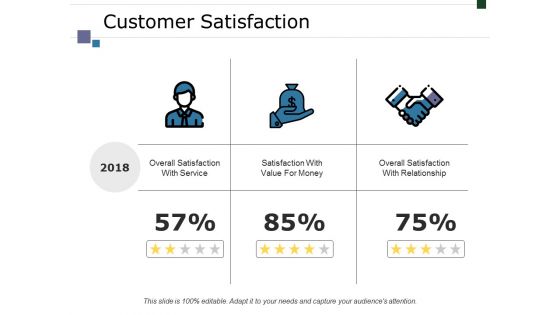
Customer Satisfaction Ppt PowerPoint Presentationmodel Brochure
This is a customer satisfaction ppt powerpoint presentationmodel brochure. This is a three stage process. The stages in this process are business, marketing, overall satisfaction with service, satisfaction with value for money, overall satisfaction with relationship, percentage, years.
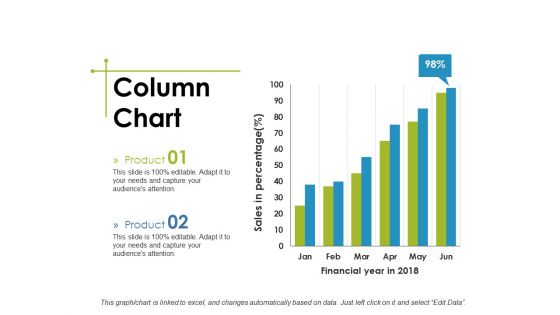
Column Chart Ppt PowerPoint Presentation Show Structure
This is a column chart ppt powerpoint presentation show structure. This is a two stage process. The stages in this process are business, financial year in, sales in percentage, marketing, graph.

Scatter Bubble Chart Ppt PowerPoint Presentation Model Designs
This is a scatter bubble chart ppt powerpoint presentation model designs. This is a two stage process. The stages in this process are business, profit, in percentage, bubble chart, marketing.

Stacked Line Ppt PowerPoint Presentation Pictures Example Topics
This is a stacked line ppt powerpoint presentation pictures example topics. This is a three stage process. The stages in this process are product, in percentage, stacked line, business, marketing.

Area Chart Ppt PowerPoint Presentation Infographics Graphics Pictures
This is a area chart ppt powerpoint presentation infographics graphics pictures. This is a two stage process. The stages in this process are business, sales in percentage, area chart, marketing, graph.

Line Chart Ppt PowerPoint Presentation Portfolio Background Image
This is a line chart ppt powerpoint presentation portfolio background image. This is a two stage process. The stages in this process are sales in percentage, financial years, chart, business, marketing, finance.
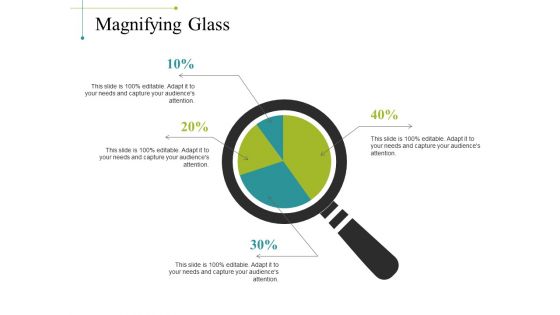
Magnifying Glass Template 1 Ppt PowerPoint Presentation Layouts Inspiration
This is a magnifying glass template 1 ppt powerpoint presentation layouts inspiration. This is a four stage process. The stages in this process are business, magnifying glass, percentage, marketing, technology.

Bar Graph Ppt PowerPoint Presentation Summary Format
This is a bar graph ppt powerpoint presentation summary format. This is a three stage process. The stages in this process are bar graph, business, marketing, years, percentage, finance.
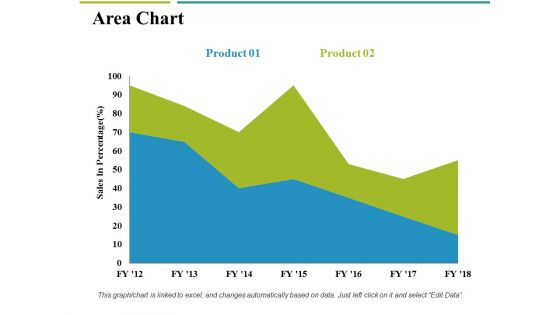
Area Chart Ppt PowerPoint Presentation Ideas Professional
This is a area chart ppt powerpoint presentation ideas professional. This is a two stage process. The stages in this process are business, sales in percentage, area chart, marketing, finance.
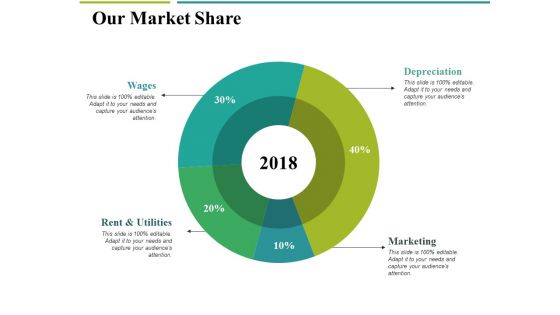
Our Market Share Ppt PowerPoint Presentation Gallery Graphics Example
This is a our market share ppt powerpoint presentation gallery graphics example. This is a four stage process. The stages in this process are business, wages, rent and utilities, marketing, depreciation, percentage, years.

Stacked Line Ppt PowerPoint Presentation Infographics Vector
This is a stacked line ppt powerpoint presentation infographics vector. This is a three stage process. The stages in this process are product, stacked line, business, marketing, in percentage.

Donut Pie Chart Ppt PowerPoint Presentation Professional Graphic Images
This is a donut pie chart ppt powerpoint presentation professional graphic images. This is a three stage process. The stages in this process are percentage, finance, donut, business, marketing.

Clustered Column Ppt PowerPoint Presentation Inspiration Introduction
This is a clustered column ppt powerpoint presentation inspiration introduction. This is a two stage process. The stages in this process are business, marketing, in percentage, finance, graph, strategy.
Area Chart Ppt PowerPoint Presentation Icon Aids
This is a area chart ppt powerpoint presentation icon aids. This is a three stage process. The stages in this process are financial years, sales in percentage, business, marketing, graph.
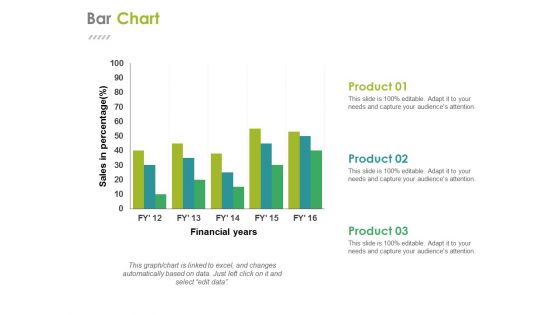
Bar Chart Ppt PowerPoint Presentation Summary Themes
This is a bar chart ppt powerpoint presentation summary themes. This is a three stage process. The stages in this process are financial years, sales in percentage, business, marketing, graph.

Combo Chart Ppt PowerPoint Presentation Gallery Design Ideas
This is a combo chart ppt powerpoint presentation gallery design ideas. This is a three stage process. The stages in this process are business, financial years, sales in percentage, finance, graph.
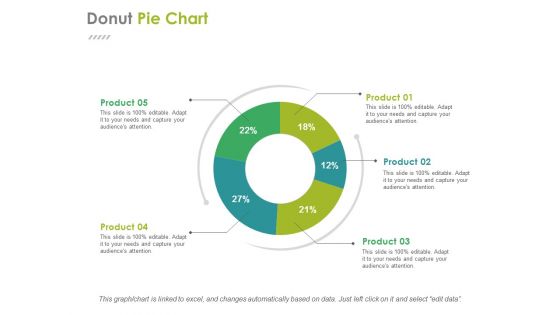
Donut Pie Chart Ppt PowerPoint Presentation File Infographic Template
This is a donut pie chart ppt powerpoint presentation file infographic template. This is a five stage process. The stages in this process are business, management, process, percentage, chart.
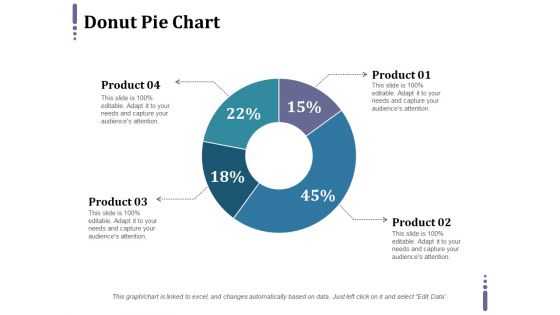
Donut Pie Chart Ppt PowerPoint Presentation Pictures Layout Ideas
This is a donut pie chart ppt powerpoint presentation pictures layout ideas. This is a four stage process. The stages in this process are percentage, finance, donut, business, product.

Area Chart Ppt PowerPoint Presentation Outline Graphics Pictures
This is a area chart ppt powerpoint presentation outline graphics pictures. This is a two stage process. The stages in this process are financial year, in percentage, business, marketing, finance.
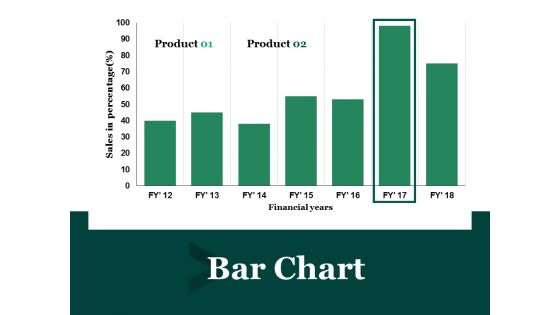
Bar Chart Ppt PowerPoint Presentation Layouts Template
This is a bar chart ppt powerpoint presentation layouts template. This is a two stage process. The stages in this process are financial year, sales in percentage, business, marketing, finance.
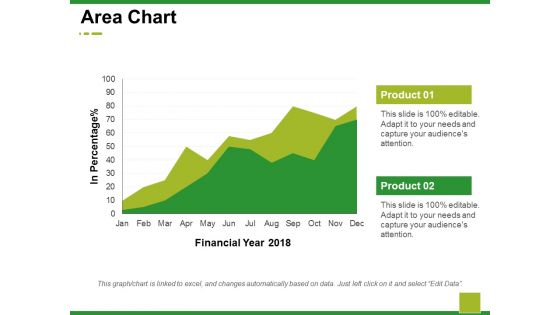
Area Chart Ppt PowerPoint Presentation Model Demonstration
This is a area chart ppt powerpoint presentation model demonstration. This is a two stage process. The stages in this process are business, marketing, financial year, in percentage, graph.
Bar Graph Ppt PowerPoint Presentation Infographics Icon
This is a bar graph ppt powerpoint presentation infographics icon. This is a two stage process. The stages in this process are business, marketing, financial year, in percentage, graph.

Combo Chart Ppt PowerPoint Presentation Summary Background Images
This is a combo chart ppt powerpoint presentation summary background images. This is a two stage process. The stages in this process are business, marketing, financial year, in percentage, graph.
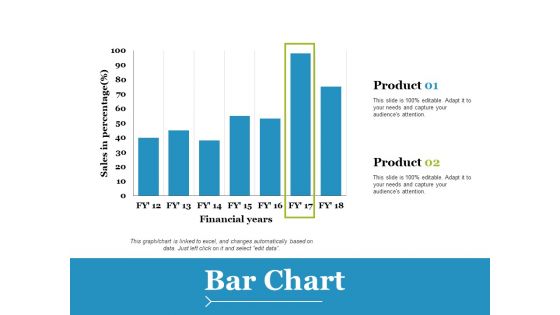
Bar Chart Ppt PowerPoint Presentation Slides Example File
This is a bar chart ppt powerpoint presentation slides example file. This is a two stage process. The stages in this process are product, financial years, sales in percentage.
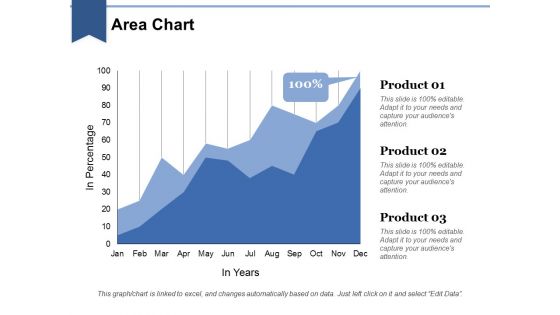
Area Chart Ppt PowerPoint Presentation Layouts Graphic Images
This is a area chart ppt powerpoint presentation layouts graphic images. This is a three stage process. The stages in this process are business, in years, marketing, in percentage, finance, graph.
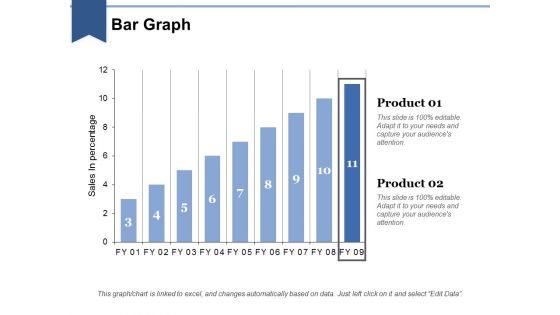
Bar Graph Ppt PowerPoint Presentation Layouts Influencers
This is a bar graph ppt powerpoint presentation layouts influencers. This is a two stage process. The stages in this process are business, marketing, in bar graph, sales in percentage, finance.
Comparison Ppt PowerPoint Presentation Icon Show
This is a comparison ppt powerpoint presentation icon show. This is a three stage process. The stages in this process are business, pc user in, laptop user in, mobile user in, comparison, percentage.
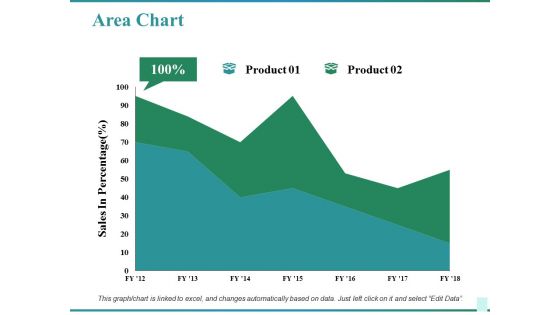
Area Chart Ppt PowerPoint Presentation Inspiration Background Designs
This is a area chart ppt powerpoint presentation inspiration background designs. This is a two stage process. The stages in this process are business, sales in percentage, area chart, marketing, finance.

Clustered Column Line Ppt PowerPoint Presentation Model Graphics Tutorials
This is a clustered column line ppt powerpoint presentation model graphics tutorials. This is a three stage process. The stages in this process are business, marketing, in percentage, finance, graph.

Area Chart Ppt PowerPoint Presentation Layouts Background Designs
This is a area chart ppt powerpoint presentation layouts background designs. This is a two stage process. The stages in this process are business, marketing, in percentage, area chart, finance.
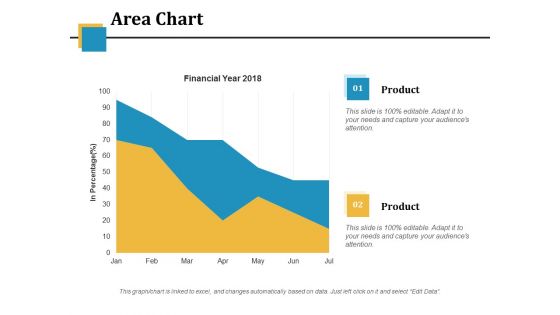
Area Chart Ppt PowerPoint Presentation Model Inspiration
This is a area chart ppt powerpoint presentation model inspiration. This is a two stage process. The stages in this process are financial year, in percentage, area chart, business, marketing.
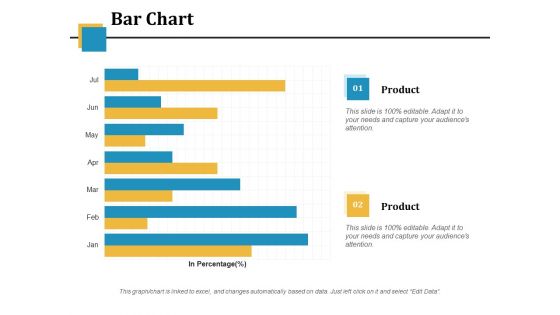
Bar Chart Ppt PowerPoint Presentation Infographic Template Picture
This is a bar chart ppt powerpoint presentation infographic template picture. This is a two stage process. The stages in this process are financial, in percentage, business, marketing, bar chart.
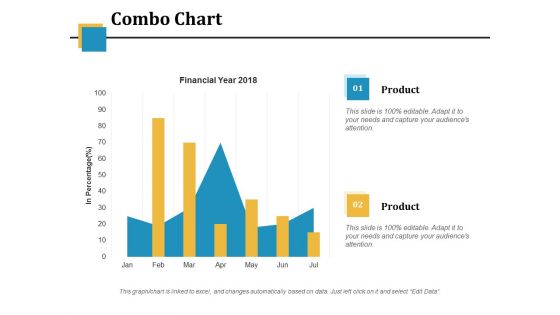
Combo Chart Ppt PowerPoint Presentation Model Vector
This is a combo chart ppt powerpoint presentation model vector. This is a two stage process. The stages in this process are financial year, in percentage, business, marketing, combo chart.

Line Chart Ppt PowerPoint Presentation Summary Clipart Images
This is a line chart ppt powerpoint presentation summary clipart images. This is a two stage process. The stages in this process are business, marketing, sales in percentage, financial years, strategy.

Area Stacked Ppt PowerPoint Presentation Infographics Shapes
This is a area stacked ppt powerpoint presentation infographics shapes. This is a two stage process. The stages in this process are product, area stacked, sales in percentage, financial year.
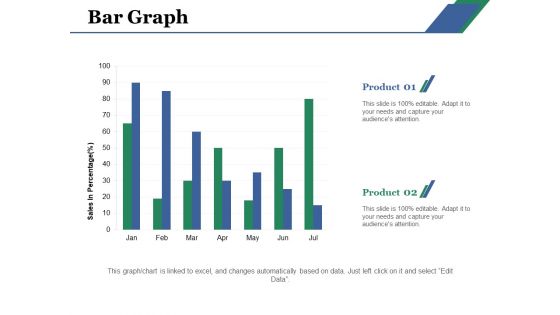
Bar Graph Ppt PowerPoint Presentation Infographic Template Demonstration
This is a bar graph ppt powerpoint presentation infographic template demonstration. This is a two stage process. The stages in this process are bar graph, product, sales, percentage, financial.

Pie Of Pie Ppt PowerPoint Presentation Visual Aids Backgrounds
This is a pie of pie ppt powerpoint presentation visual aids backgrounds. This is a two stage process. The stages in this process are pie, process, percentage, finance, business.

Youtube Analytics Ppt PowerPoint Presentation Layouts Graphic Images
This is a youtube analytics ppt powerpoint presentation layouts graphic images. This is a three stage process. The stages in this process are youtube analytics, finance, percentage, bar graph.
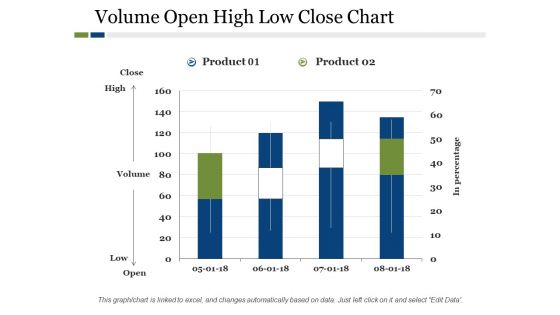
Volume Open High Low Close Chart Ppt PowerPoint Presentation Outline Mockup
This is a volume open high low close chart ppt powerpoint presentation outline mockup. This is a two stage process. The stages in this process are product, high, low, in percentage, volume.

Donut Pie Chart Ppt PowerPoint Presentation Pictures File Formats
This is a donut pie chart ppt powerpoint presentation pictures file formats. This is a three stage process. The stages in this process are product, donut pie chart, percentage, business, marketing.
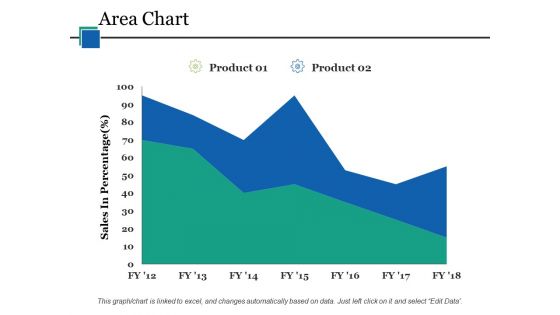
Area Chart Ppt PowerPoint Presentation Infographics Guide
This is a area chart ppt powerpoint presentation infographics guide. This is a two stage process. The stages in this process are area chart, product, sales in percentage, finance, business.

Scatter Diagram Ppt PowerPoint Presentation Infographic Template Design Ideas
This is a scatter diagram ppt powerpoint presentation infographic template design ideas. This is a one stage process. The stages in this process are scatter diagram, finance, in percentage, business, bar graph.

Stacked Bar Ppt PowerPoint Presentation Slides Layout Ideas
This is a stacked bar ppt powerpoint presentation slides layout ideas. This is a two stage process. The stages in this process are stacked bar, product, percentage, finance, business.
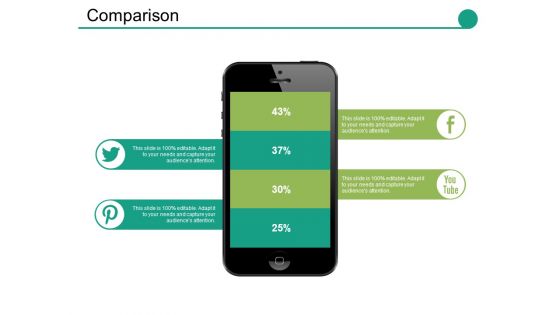
Comparison Ppt PowerPoint Presentation Show Slide Download Ppt PowerPoint Presentation Professional Smartart
This is a comparison ppt powerpoint presentation show slide download ppt powerpoint presentation professional smartart. This is a four stage process. The stages in this process are compare, percentage, finance, business, marketing.

Financial Ppt PowerPoint Presentation Inspiration Slide Download Ppt PowerPoint Presentation Slides Background Images
This is a financial ppt powerpoint presentation inspiration slide download ppt powerpoint presentation slides background images. This is a three stage process. The stages in this process are business, finance, marketing, percentage, management.

Pie Chart Ppt PowerPoint Presentation Inspiration Example File
This is a pie chart ppt powerpoint presentation inspiration example file. This is a four stage process. The stages in this process are pie chart, finance, percentage, business, marketing.
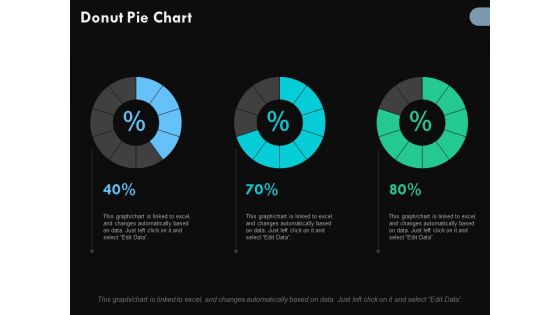
Donut Pie Chart Finance Ppt PowerPoint Presentation Outline Portrait
This is a donut pie chart finance ppt powerpoint presentation outline portrait. This is a three stage process. The stages in this process are donut pie chart, percentage, marketing, business, analysis.
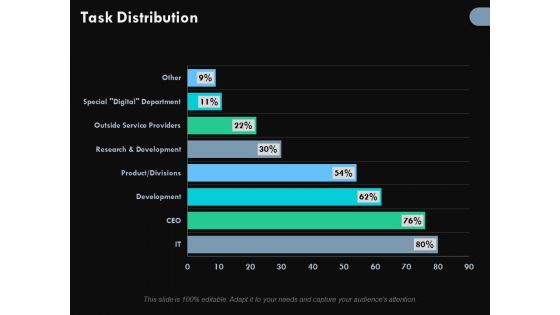
Task Distribution Ppt PowerPoint Presentation Design Ideas
This is a task distribution ppt powerpoint presentation design ideas. This is a eight stage process. The stages in this process are outside service providers, research and development, product, divisions, percentage.
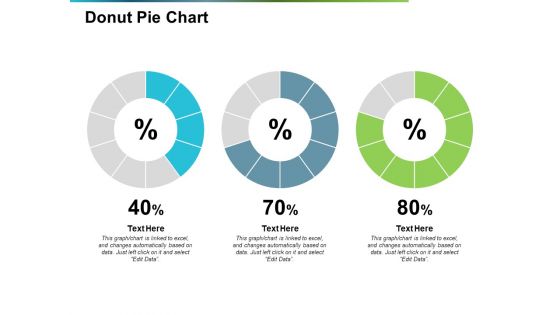
Donut Pie Chart Ppt PowerPoint Presentation Show Graphics Download
This is a donut pie chart ppt powerpoint presentation show graphics download. This is a three stage process. The stages in this process are percentage, finance, donut, business, marketing.

Area Chart Ppt PowerPoint Presentation Show Graphics Tutorials
This is a area chart ppt powerpoint presentation show graphics tutorials. This is a two stage process. The stages in this process are area chart, percentage, product, marketing, management.

Stacked Bar Chart Ppt PowerPoint Presentation Influencers
This is a stacked bar chart ppt powerpoint presentation influencers. This is a three stage process. The stages in this process are stacked bar chart, product, percentage, finance, business.
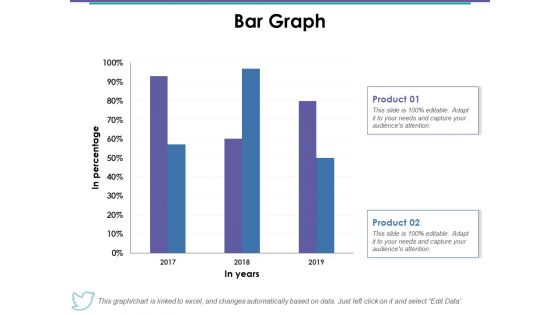
Bar Graph Ppt PowerPoint Presentation Styles Skills
This is a bar graph ppt powerpoint presentation styles skills. This is a two stage process. The stages in this process are bar graph, product, in year, in percentage, business.
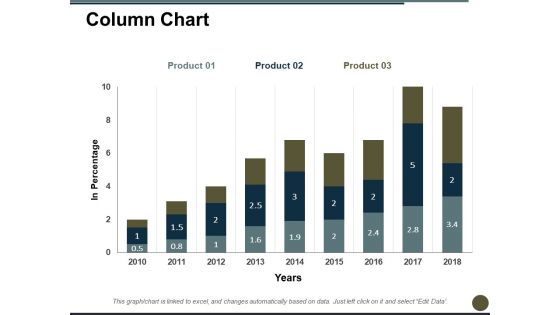
Column Chart Ppt PowerPoint Presentation Layouts File Formats
This is a column chart ppt powerpoint presentation layouts file formats. This is a three stage process. The stages in this process are column chart, product, in percentage, year, finance.
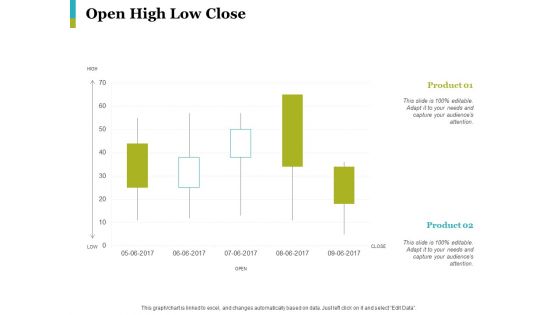
Open High Low Close Ppt PowerPoint Presentation Styles Graphics Example
This is a open high low close ppt powerpoint presentation styles graphics example.This is a two stage process. The stages in this process are product, percentage, chart, management, marketing.
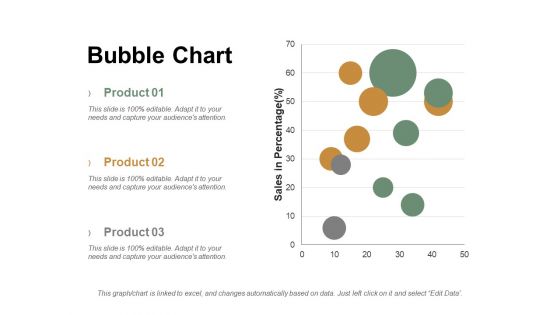
Bubble Chart Ppt PowerPoint Presentation Summary Graphics Tutorials
This is a bubble chart ppt powerpoint presentation summary graphics tutorials. This is a three stage process. The stages in this process are product, sales in percentage, bubble chart.

Clustered Column Chart Ppt PowerPoint Presentation Professional Ideas
This is a clustered column chart ppt powerpoint presentation professional ideas. This is a three stage process. The stages in this process are product, sales in percentage, column, years.

Work Breakdown Structure Ppt PowerPoint Presentation Gallery Portrait
This is a work breakdown structure ppt powerpoint presentation gallery portrait. This is a seven stage process. The stages in this process are task name, resources, days, percentage, table.
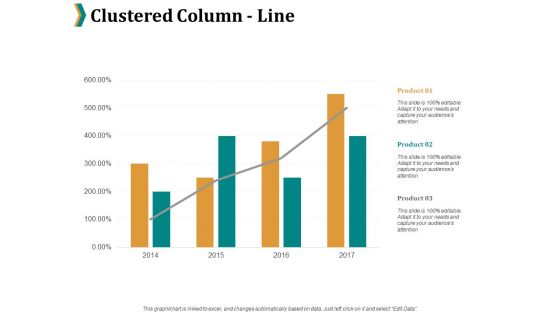
Clustered Column Line Ppt PowerPoint Presentation Visual Aids Ideas
This is a clustered column line ppt powerpoint presentation visual aids ideas. This is a three stage process. The stages in this process are product, percentage, marketing, business, management.
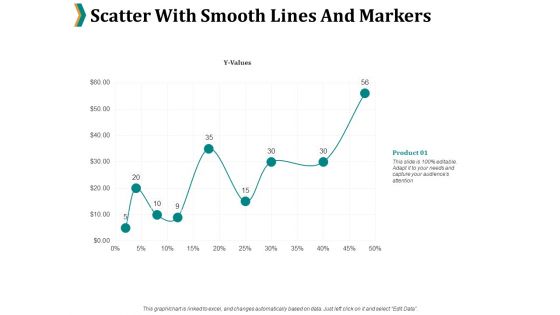
Scatter With Smooth Lines And Markers Ppt PowerPoint Presentation Styles Backgrounds
This is a scatter with smooth lines and markers ppt powerpoint presentation styles backgrounds. This is a one stage process. The stages in this process are product, percentage, marketing, business.

Volume Open High Low Close Chart Ppt PowerPoint Presentation Professional Maker
This is a volume open high low close chart ppt powerpoint presentation professional maker. This is a two stage process. The stages in this process are percentage, product, marketing.

 Home
Home