Percentage
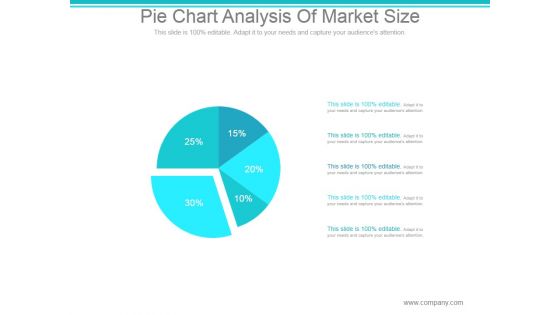
Pie Chart Analysis Of Market Size Ppt PowerPoint Presentation Show
This is a pie chart analysis of market size ppt powerpoint presentation show. This is a five stage process. The stages in this process are chart, graph, pie, percentage, business.
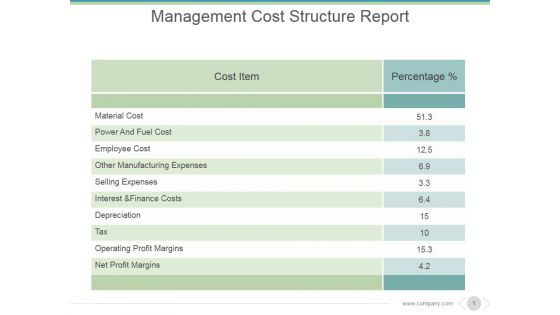
Management Cost Structure Report Ppt PowerPoint Presentation Graphics
This is a management cost structure report ppt powerpoint presentation graphics. This is a two stage process. The stages in this process are cost item, percentage, material cost, power and fuel cost, employee cost, other manufacturing expenses.

Magnifying Glass For Sales Performance Review Ppt PowerPoint Presentation Model
This is a magnifying glass for sales performance review ppt powerpoint presentation model. This is a four stage process. The stage in this process are magnifier glass, pie, finance, percentage, research.

Male Vs Female Work Productivity Comparison Ppt PowerPoint Presentation Slides
This is a male vs female work productivity comparison ppt powerpoint presentation slides. This is a two stage process. The stages in this process are finance, business, percentage, compare, marketing.

Three Dashboards For Measuring Digital Marketing Ppt PowerPoint Presentation Slide
This is a three dashboards for measuring digital marketing ppt powerpoint presentation slide. This is a three stage process. The stages in this process are dashboard, measuring, business, marketing, percentage.
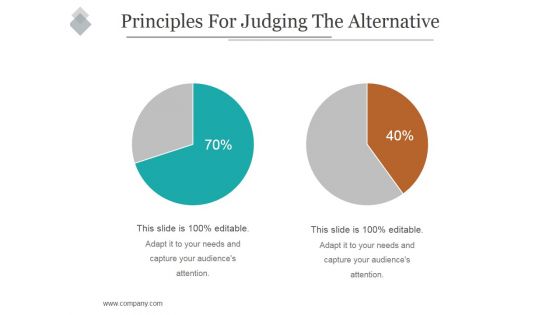
Principles For Judging The Alternative Ppt PowerPoint Presentation Slide
This is a principles for judging the alternative ppt powerpoint presentation slide. This is a two stage process. The stages in this process are business, pie, division, percentage, finance.
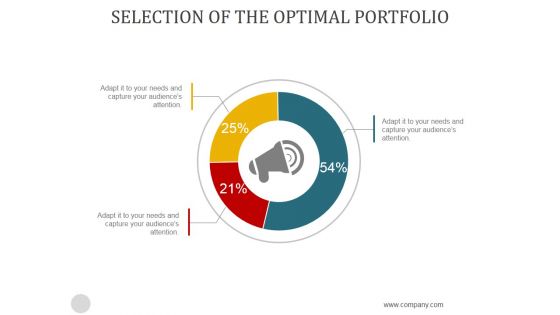
Selection Of The Optimal Portfolio Ppt PowerPoint Presentation Files
This is a selection of the optimal portfolio ppt powerpoint presentation files. This is a three stage process. The stages in this process are process, percentage, strategy, marketing, circle.

Market Share Of Competitors Ppt PowerPoint Presentation Slides
This is a market share of competitors ppt powerpoint presentation slides. This is a six stage process. The stages in this process are market share in, competitor, pie, finance, percentage.

Open High Low Close Chart Ppt PowerPoint Presentation Information
This is a open high low close chart ppt powerpoint presentation information. This is a five stage process. The stages in this process are product, in percentage, close, low, high.

Financial Analysis Module PPT PowerPoint Presentation Complete Deck With Slides
This is a financial analysis module ppt powerpoint presentation complete deck with slides. This is a one stage process. The stages in this process are table, business, finance, analysis, percentage.

Funding Updates Equity Ppt PowerPoint Presentation Outline Gridlines
This is a funding updates equity ppt powerpoint presentation outline gridlines. This is a one stage process. The stages in this process are shareholding pattern, percentage, business, marketing, success.
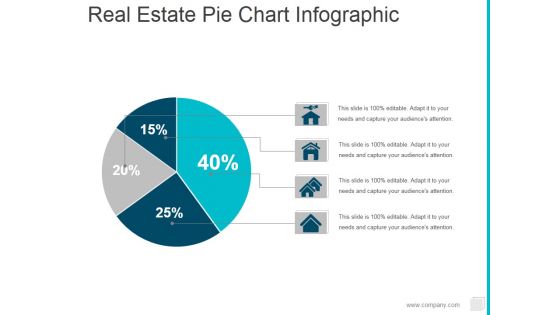
Real Estate Pie Chart Infographic Ppt PowerPoint Presentation Ideas Shapes
This is a real estate pie chart infographic ppt powerpoint presentation ideas shapes. This is a four stage process. The stages in this process are pie, finance, marketing, percentage.

Bar Graph Ppt PowerPoint Presentation Gallery Skills
This is a bar graph ppt powerpoint presentation gallery skills. This is a four stage process. The stages in this process are in percentage, bar graph, business, marketing, product.
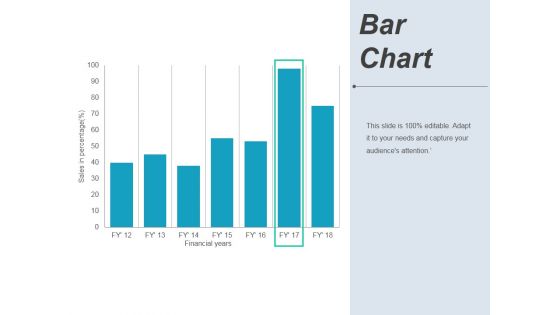
Bar Chart Ppt PowerPoint Presentation Pictures Background Image
This is a bar chart ppt powerpoint presentation pictures background image. This is a seven stage process. The stages in this process are financial years, sales in percentage, graph, business.

Funding Updates Equity Ppt PowerPoint Presentation Portfolio Inspiration
This is a funding updates equity ppt powerpoint presentation portfolio inspiration. This is a two stage process. The stages in this process are shareholding pattern, total shares, percentage, shareholder.

Area Chart Ppt Powerpoint Presentation File Show
This is a area chart ppt powerpoint presentation file show. This is a two stage process. The stages in this process are sales in percentage, financial year, product, financial, business.

Resource Capacity Planning Template 1 Ppt PowerPoint Presentation Gallery Vector
This is a resource capacity planning template 1 ppt powerpoint presentation gallery vector. This is a four stage process. The stages in this process are percentage, finance, business, marketing.
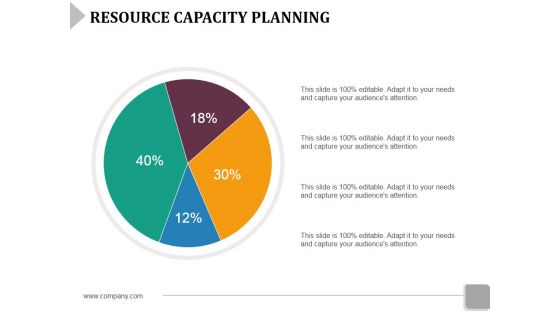
Resource Capacity Planning Template 2 Ppt PowerPoint Presentation Show Maker
This is a resource capacity planning template 2 ppt powerpoint presentation show maker. This is a four stage process. The stages in this process are pie, percentage, finance, business, marketing.

Area Chart Ppt PowerPoint Presentation Layouts Graphics Example
This is a area chart ppt powerpoint presentation layouts graphics example. This is a two stage process. The stages in this process are sales in percentage, financial year, business, marketing, presentation.

Bubble Chart Ppt PowerPoint Presentation Layouts Design Ideas
This is a bubble chart ppt powerpoint presentation layouts design ideas. This is a eight stage process. The stages in this process are in percentage, profit, bubble chart, business, marketing.
Clustered Column Ppt PowerPoint Presentation Icon Design Inspiration
This is a clustered column ppt powerpoint presentation icon design inspiration. This is a two stage process. The stages in this process are product, financial year, sales in percentage, clustered column.
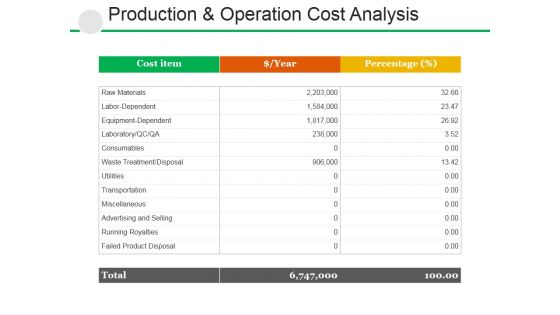
Production And Operation Cost Analysis Ppt PowerPoint Presentation Slide
This is a production and operation cost analysis ppt powerpoint presentation slide. This is a three stage process. The stages in this process are cost item, percentage, raw materials, consumables, transportation.
Resource Capacity Planning Template 2 Ppt PowerPoint Presentation Icon Rules
This is a resource capacity planning template 2 ppt powerpoint presentation icon rules. This is a four stage process. The stages in this process are icons, strategy, finance, percentage, business.

Selection Of The Optimal Portfolio Template 1 Ppt PowerPoint Presentation Model Themes
This is a selection of the optimal portfolio template 1 ppt powerpoint presentation model themes. This is a six stage process. The stages in this process are share in percentage, stock, bonds, real estate, types of investment.
Selection Of The Optimal Portfolio Template 2 Ppt PowerPoint Presentation Icon Introduction
This is a selection of the optimal portfolio template 2 ppt powerpoint presentation icon introduction. This is a three stage process. The stages in this process are real estate, stocks, bonds, percentage, finance.
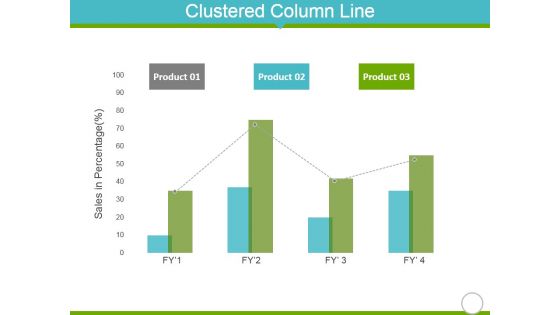
Clustered Column Line Ppt Powerpoint Presentation Slides Demonstration
This is a clustered column line ppt powerpoint presentation slides demonstration. This is a four stage process. The stages in this process are product, sales in percentage, finance, marketing.
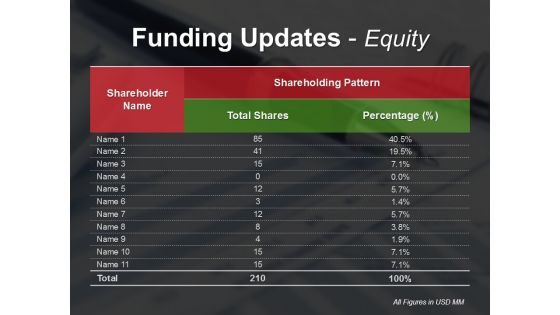
Funding Updates Equity Ppt PowerPoint Presentation Ideas Slide Download
This is a funding updates equity ppt powerpoint presentation ideas slide download. This is a two stage process. The stages in this process are shareholder name, shareholding pattern, total shares, percentage.

Stacked Bar Ppt PowerPoint Presentation Infographics Graphics
This is a stacked bar ppt powerpoint presentation infographics graphics. This is a four stage process. The stages in this process are business, strategy, marketing, success, unit count, in percentage.
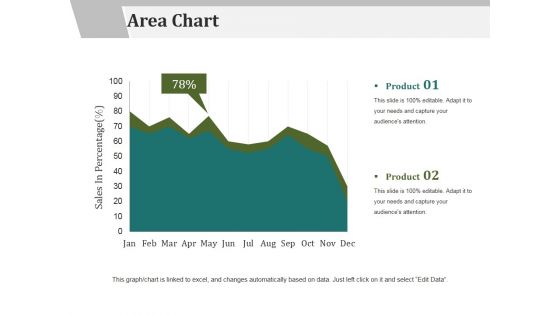
Area Chart Ppt PowerPoint Presentation Infographics Graphics Tutorials
This is a area chart ppt powerpoint presentation infographics graphics tutorials. This is a two stage process. The stages in this process are product, area chart, sales in percentage.

Bar Chart Ppt PowerPoint Presentation Slides Design Ideas
This is a bar chart ppt powerpoint presentation slides design ideas. This is a six stage process. The stages in this process are product, bar chart, sales in percentage.
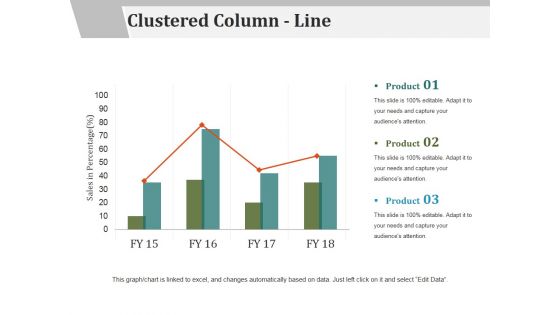
Clustered Column Line Ppt PowerPoint Presentation File Examples
This is a clustered column line ppt powerpoint presentation file examples. This is a three stage process. The stages in this process are sales in percentage, product, business, marketing, success.
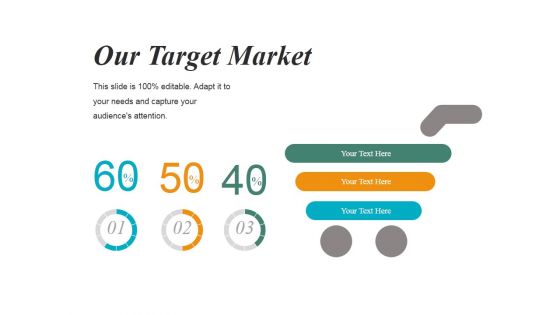
Our Target Market Template 1 Ppt PowerPoint Presentation Slides Introduction
This is a our target market template 1 ppt powerpoint presentation slides introduction. This is a three stage process. The stages in this process are finance, percentage, business, marketing.
Donut Pie Chart Ppt PowerPoint Presentation Icon Background Images
This is a donut pie chart ppt powerpoint presentation icon background images. This is a four stage process. The stages in this process are donut, process, planning, percentage, finance.
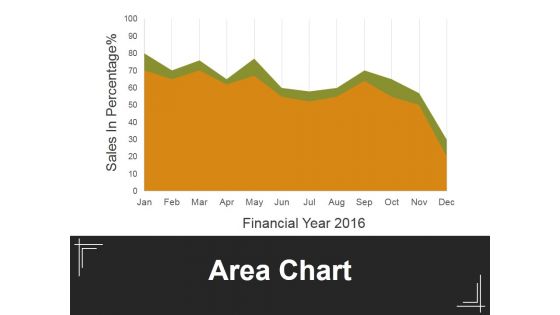
Area Chart Ppt PowerPoint Presentation Slides Deck
This is a area chart ppt powerpoint presentation slides deck. This is a two stage process. The stages in this process are financial, sales in percentage, business, marketing, management.
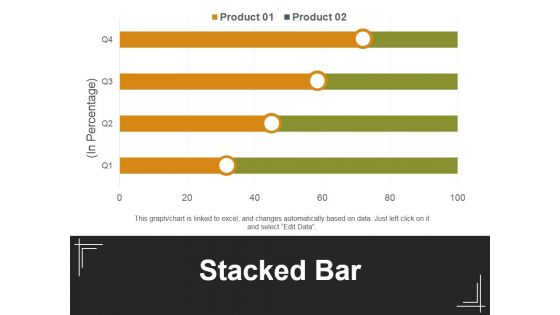
Stacked Bar Template 1 Ppt PowerPoint Presentation Inspiration Background Designs
This is a stacked bar template 1 ppt powerpoint presentation inspiration background designs. This is a four stage process. The stages in this process are in percentage, stacked bar, product, business, marketing.
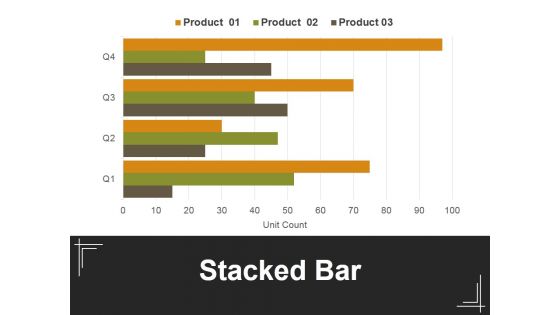
Stacked Bar Template 2 Ppt PowerPoint Presentation Professional Example
This is a stacked bar template 2 ppt powerpoint presentation professional example. This is a four stage process. The stages in this process are in percentage, stacked bar, product, business, marketing.

Current Staff Composition Ppt PowerPoint Presentation Outline Example File
This is a current staff composition ppt powerpoint presentation outline example file. This is a five stage process. The stages in this process are business, staff composition, category, percentage.
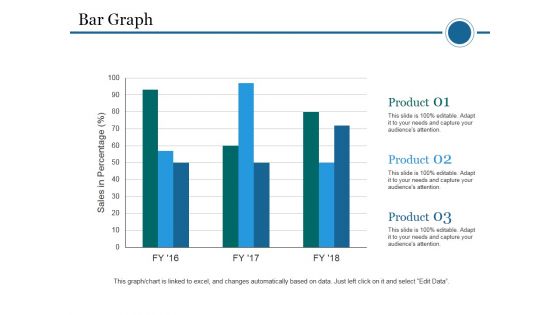
Bar Graph Ppt PowerPoint Presentation Infographic Template Template
This is a bar graph ppt powerpoint presentation infographic template template. This is a three stage process. The stages in this process are bar graph, sales in percentage, product, planning, business.

Clustered Column Line Chart Ppt PowerPoint Presentation File Pictures
This is a clustered column line chart ppt powerpoint presentation file pictures. This is a four stage process. The stages in this process are clustered bar, product, planning, business, sales in percentage.
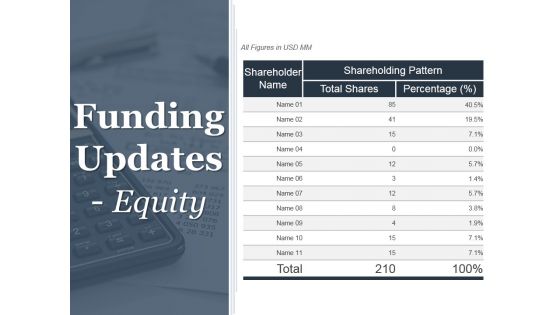
Funding Updates Equity Ppt PowerPoint Presentation Portfolio Tips
This is a funding updates equity ppt powerpoint presentation portfolio tips. This is a three stage process. The stages in this process are shareholder name, total shares, shareholding pattern, percentage.
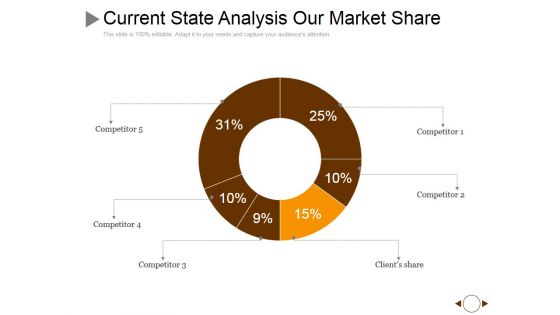
Current State Analysis Our Market Share Ppt PowerPoint Presentation File Designs Download
This is a current state analysis our market share ppt powerpoint presentation file designs download. This is a six stage process. The stages in this process are percentage, finance, donut, business.
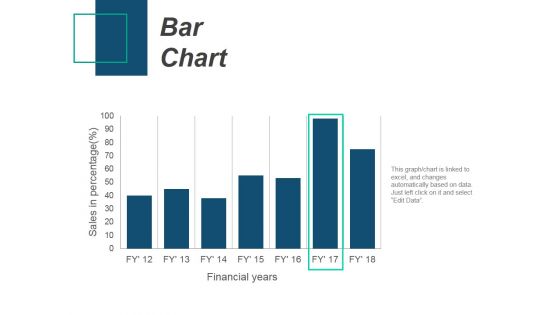
Bar Chart Ppt PowerPoint Presentation Professional Files
This is a bar chart ppt powerpoint presentation professional files. This is a seven stage process. The stages in this process are bar chart, product, sales in percentage, financial years.
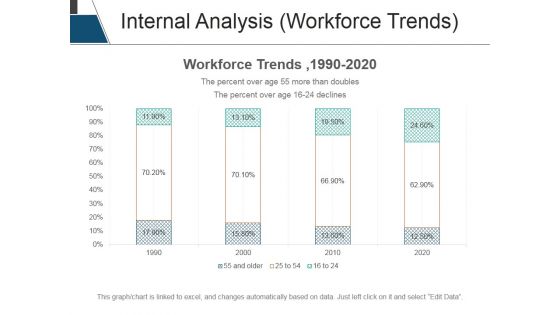
Internal Analysis Workforce Trends Ppt PowerPoint Presentation Summary Example Topics
This is a internal analysis workforce trends ppt powerpoint presentation summary example topics. This is a four stage process. The stages in this process are workforce trends, percentage, business, marketing, management.

Line Chart Ppt PowerPoint Presentation Infographic Template Introduction
This is a line chart ppt powerpoint presentation infographic template introduction. This is a two stage process. The stages in this process are product, sales in percentage, financial years, line chart.
Bar Chart Ppt PowerPoint Presentation Portfolio Icons
This is a bar chart ppt powerpoint presentation portfolio icons. This is a seven stage process. The stages in this process are in years, in percentage, finance, business marketing.

Meet Our Awesome Team Ppt PowerPoint Presentation Styles Graphics Design
This is a meet our awesome team ppt powerpoint presentation styles graphics design. This is a one stage process. The stages in this process are strategy, management, finance, business, percentage.

Scatter Bubble Chart Ppt PowerPoint Presentation Diagram Ppt
This is a scatter bubble chart ppt powerpoint presentation diagram ppt. This is a two stage process. The stages in this process are product, in price, highest sale, percentage, business, marketing.

Clustered Column Line Ppt PowerPoint Presentation Model Images
This is a clustered column line ppt powerpoint presentation model images. This is a four stage process. The stages in this process are sales in percentage, product, business, marketing, bar graph.

Line Chart Ppt PowerPoint Presentation Outline Samples
This is a line chart ppt powerpoint presentation outline samples. This is a two stage process. The stages in this process are sales in percentage, product, business, marketing, success.
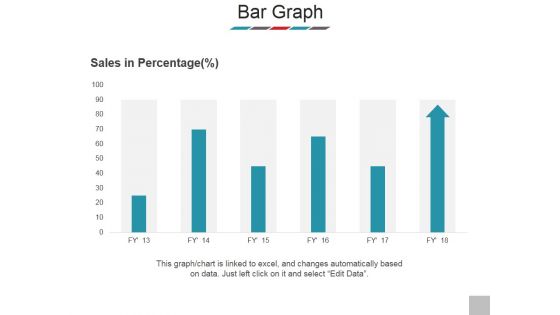
Bar Graph Ppt PowerPoint Presentation Model Clipart
This is a bar graph ppt powerpoint presentation model clipart. This is a six stage process. The stages in this process are sales in percentage, product, bar graph, business, marketing.
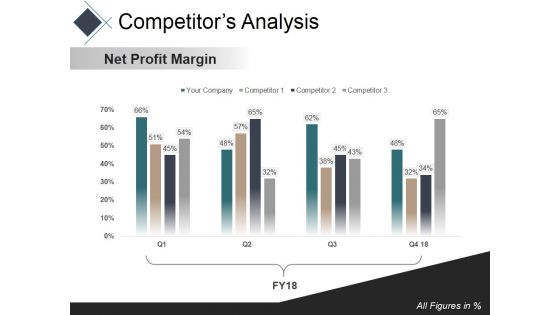
Competitors Analysis Template 1 Ppt PowerPoint Presentation Pictures Styles
This is a competitors analysis template 1 ppt powerpoint presentation pictures styles. This is a four stage process. The stages in this process are market share, pie, percentage, finance, process.
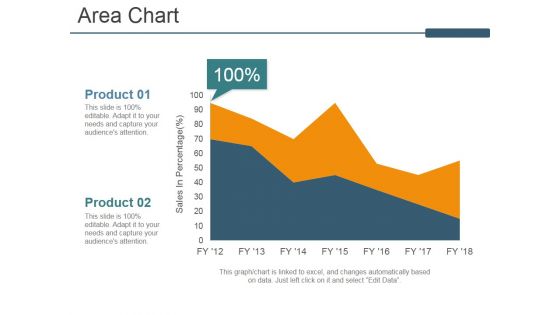
Area Chart Ppt PowerPoint Presentation Inspiration Rules
This is a area chart ppt powerpoint presentation inspiration rules. This is a two stage process. The stages in this process are area chart, business, marketing, sales in percentage, product.
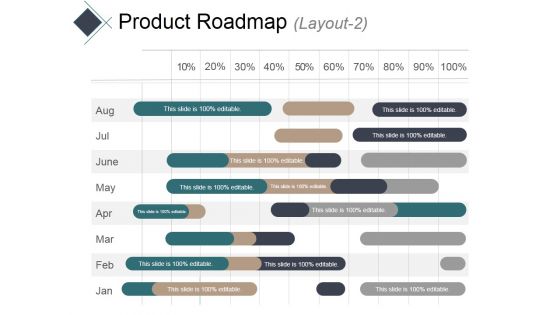
Product Roadmap Layout 2 Ppt PowerPoint Presentation Portfolio File Formats
This is a product roadmap layout 2 ppt powerpoint presentation portfolio file formats. This is a eight stage process. The stages in this process are bar, finance, analysis, planning, percentage.
Line Chart Ppt PowerPoint Presentation Infographic Template Icons
This is a line chart ppt powerpoint presentation infographic template icons. This is a two stage process. The stages in this process are sales in percentage, financial years, product, line chart.
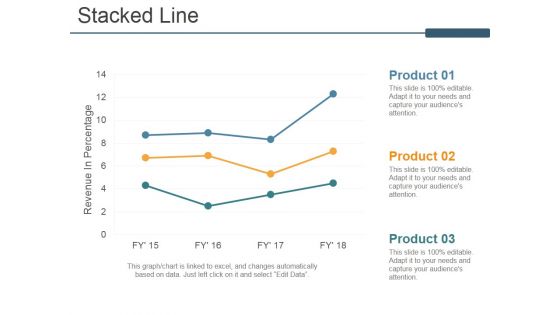
Stacked Line Ppt PowerPoint Presentation Ideas Model
This is a stacked line ppt powerpoint presentation ideas model. This is a three stage process. The stages in this process are revenue in percentage, stacked line, product, business, marketing.
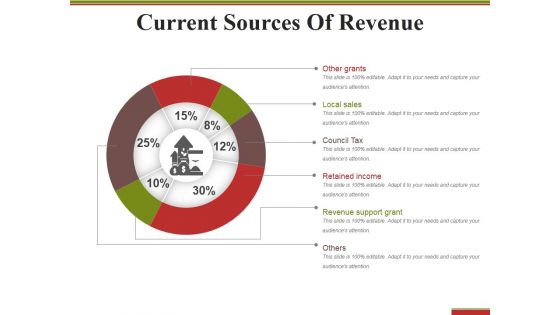
Current Sources Of Revenue Ppt PowerPoint Presentation Layouts Portrait
This is a current sources of revenue ppt powerpoint presentation layouts portrait. This is a six stage process. The stages in this process are percentage, finance, business, process, marketing.
Donut Pie Chart Ppt PowerPoint Presentation Icon Slide Portrait
This is a donut pie chart ppt powerpoint presentation icon slide portrait. This is a five stage process. The stages in this process are product, percentage, finance, donut, business.
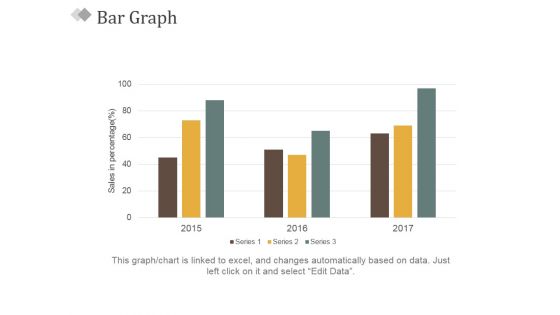
Bar Graph Ppt PowerPoint Presentation Slides Visual Aids
This is a bar graph ppt powerpoint presentation slides visual aids. This is a three stage process. The stages in this process are sales in percentage, bar graph, business, marketing, success.

Line Chart Ppt PowerPoint Presentation Professional Smartart
This is a line chart ppt powerpoint presentation professional smartart. This is a two stage process. The stages in this process are in percentage, in years, product, finance, business.
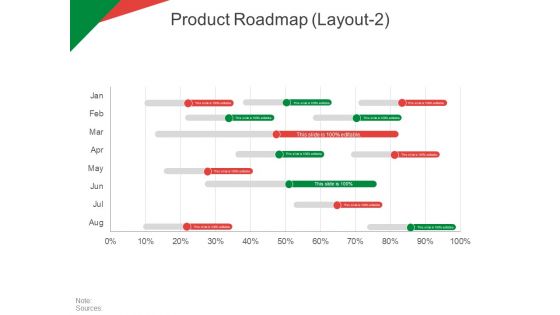
Product Roadmap Template 2 Ppt PowerPoint Presentation File Elements
This is a product roadmap template 2 ppt powerpoint presentation file elements. This is a eight stage process. The stages in this process are percentage, business, marketing, management, strategy.

 Home
Home