Percentage Growth
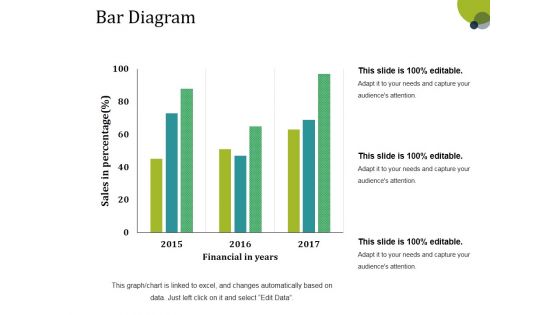
Bar Diagram Ppt PowerPoint Presentation Gallery Structure
This is a bar diagram ppt powerpoint presentation gallery structure. This is a three stage process. The stages in this process are financial in years, sales in percentage, bar graph, growth, success.

Bar Diagram Ppt PowerPoint Presentation Pictures Background Image
This is a bar diagram ppt powerpoint presentation pictures background image. This is a three stage process. The stages in this process are financial in years, sales in percentage, bar graph, growth, success.

Column Chart Ppt PowerPoint Presentation Slides Show
This is a column chart ppt powerpoint presentation slides show. This is a two stage process. The stages in this process are column chart, product, sales in percentage, financial year, growth.
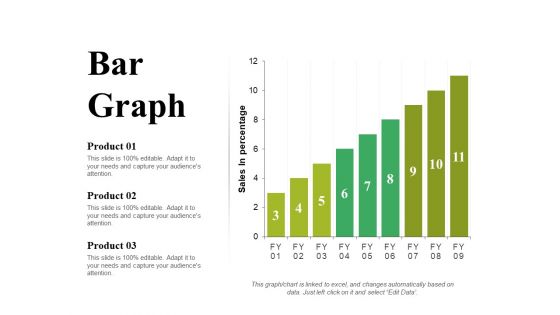
Bar Graph Ppt PowerPoint Presentation Portfolio Slide Portrait
This is a bar graph ppt powerpoint presentation portfolio slide portrait. This is a three stage process. The stages in this process are product, sales in percentage, bar graph, growth, success.

Clustered Column Line Ppt PowerPoint Presentation Pictures Example
This is a clustered column line ppt powerpoint presentation pictures example. This is a three stage process. The stages in this process are product, in percentage, bar graph, growth, success.

Area Chart Ppt PowerPoint Presentation Infographic Template Model
This is a area chart ppt powerpoint presentation infographic template model. This is a two stage process. The stages in this process are product, area chart, growth, percentage, success.

Area Chart Ppt PowerPoint Presentation Show Layout Ideas
This is a area chart ppt powerpoint presentation show layout ideas. This is a two stage process. The stages in this process are product, in percentage, financial year, growth.

Line Chart Ppt PowerPoint Presentation Layouts Show
This is a line chart ppt powerpoint presentation layouts show. This is a two stage process. The stages in this process are product, in years, in percentage, line chart, growth.

Stacked Column Chart Ppt PowerPoint Presentation Summary Gallery
This is a stacked column chart ppt powerpoint presentation summary gallery. This is a two stage process. The stages in this process are stacked column chart, product, in years, growth, percentage.
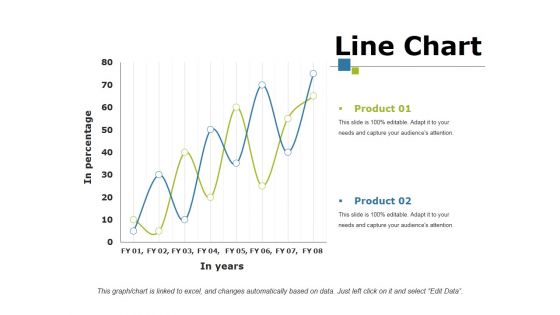
Line Chart Ppt PowerPoint Presentation Portfolio Mockup
This is a line chart ppt powerpoint presentation portfolio mockup. This is a two stage process. The stages in this process are product, in percentage, in year, growth, success.

Clustered Column Line Ppt PowerPoint Presentation Infographic Template Pictures
This is a clustered column line ppt powerpoint presentation infographic template pictures. This is a three stage process. The stages in this process are product, in percentage, bar graph, growth, success.
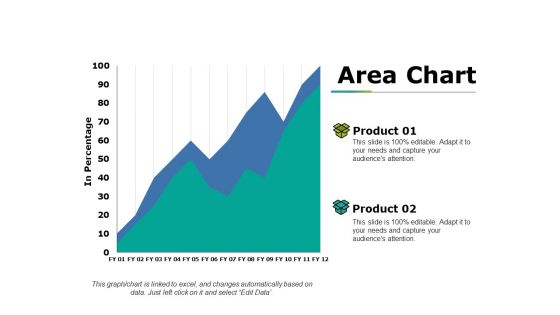
Area Chart Ppt PowerPoint Presentation Show Professional
This is a area chart ppt powerpoint presentation show professional. This is a two stage process. The stages in this process are product, in percentage, area chart, growth, success.

Planning For Future Workforce Needs Ppt PowerPoint Presentation Outline Smartart
This is a planning for future workforce needs ppt powerpoint presentation outline smartart. This is a three stage process. The stages in this process are growth, percentage, number of headcount, year, finance.

Stacked Area Clustered Column Ppt PowerPoint Presentation Model Guidelines
This is a stacked area clustered column ppt powerpoint presentation model guidelines. This is a three stage process. The stages in this process are product, in percentage, bar graph, growth, success.

Clustered Column Template 2 Ppt PowerPoint Presentation Summary Smartart
This is a clustered column template 2 ppt powerpoint presentation summary smartart. This is a two stage process. The stages in this process are product, bar graph, in percentage, clustered column, growth.

Clustered Column Line Ppt PowerPoint Presentation Summary Background Image
This is a clustered column line ppt powerpoint presentation summary background image. This is a four stage process. The stages in this process are in percentage, product, graph, growth, success.

Line Chart Ppt PowerPoint Presentation File Example File
This is a line chart ppt powerpoint presentation file example file. This is a two stage process. The stages in this process are product, in percentage, in years, growth, success.
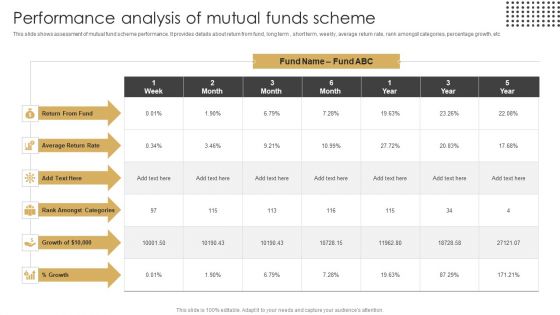
Performance Analysis Of Mutual Funds Scheme Ppt Professional Grid PDF
This slide shows assessment of mutual fund scheme performance. It provides details about return from fund, long term , short term, weekly, average return rate, rank amongst categories, percentage growth, etc. Pitch your topic with ease and precision using this Performance Analysis Of Mutual Funds Scheme Ppt Professional Grid PDF. This layout presents information on Return From Fund, Average Return Rate, Rank Amongst Categories. It is also available for immediate download and adjustment. So, changes can be made in the color, design, graphics or any other component to create a unique layout.

Careers In Supply Chain SCM Planning Ppt Inspiration Smartart PDF
This slide shows different career roles in planning of supply chain marketing with placement percentage and job growth. It include various career roles like supply chain analyst, purchasing specialist, operations analyst etc. Persuade your audience using this Careers In Supply Chain SCM Planning Ppt Inspiration Smartart PDF. This PPT design covers one stages, thus making it a great tool to use. It also caters to a variety of topics including Job Description, Placement Percentage, Job Growth, Median Salary. Download this PPT design now to present a convincing pitch that not only emphasizes the topic but also showcases your presentation skills.

Line Chart Ppt PowerPoint Presentation Summary File Formats
This is a line chart ppt powerpoint presentation summary file formats. This is a two stage process. The stages in this process are in percentage, graph, business, marketing, growth.

Scatter Chart Ppt PowerPoint Presentation Gallery Show
This is a scatter chart ppt powerpoint presentation gallery show. This is a one stage process. The stages in this process are in percentage, dollars, business, marketing, growth, graph.
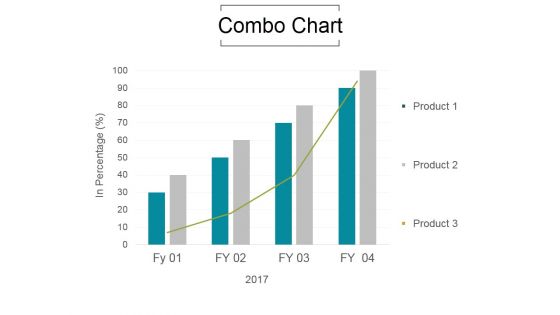
Combo Chart Ppt PowerPoint Presentation Information
This is a combo chart ppt powerpoint presentation information. This is a four stage process. The stages in this process are growth, product, in percentage.
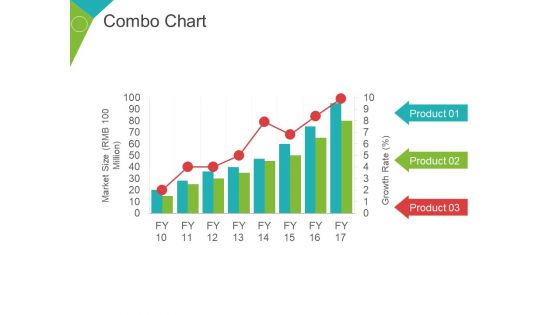
Combo Chart Ppt PowerPoint Presentation Infographic Template Graphic Images
This is a combo chart ppt powerpoint presentation infographic template graphic images. This is a three stage process. The stages in this process are market size, growth rate, percentage, business, marketing.
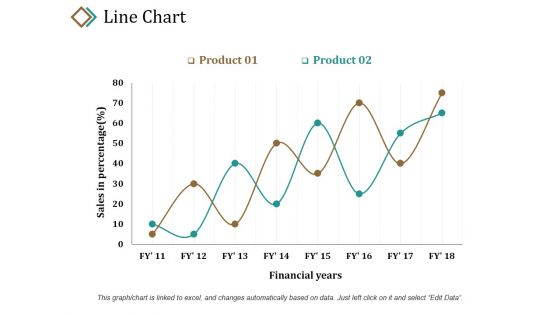
Line Chart Ppt PowerPoint Presentation Layouts Example
This is a line chart ppt powerpoint presentation layouts example. This is a two stage process. The stages in this process are sales in percentage, product, financial years, growth, success.
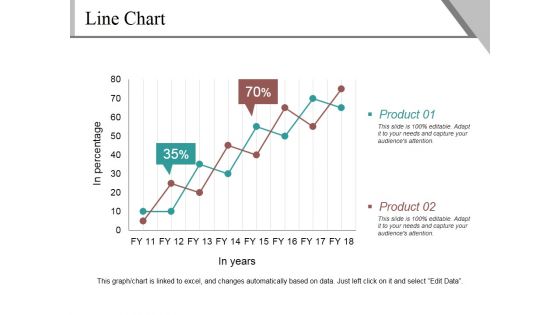
Line Chart Ppt PowerPoint Presentation Infographics Example
This is a line chart ppt powerpoint presentation infographics example. This is a two stage process. The stages in this process are product, in percentage, in years, finance, growth.

Line Chart Ppt PowerPoint Presentation Slides Mockup
This is a line chart ppt powerpoint presentation slides mockup. This is a two stage process. The stages in this process are in percentage, in years, product, growth, success.

Scatter Chart Template 3 Ppt PowerPoint Presentation Styles Demonstration
This is a scatter chart template 3 ppt powerpoint presentation styles demonstration. This is a one stage process. The stages in this process are sales in percentage, finance, business, marketing, growth.
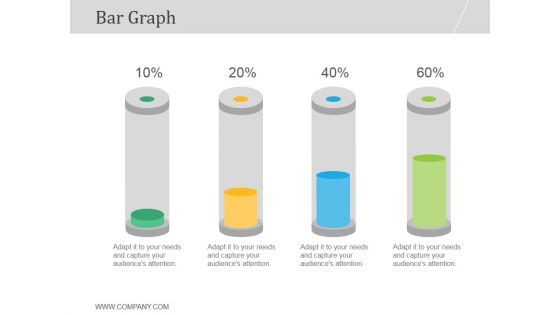
Bar Graph Ppt PowerPoint Presentation Good
This is a bar graph ppt powerpoint presentation good. This is a four stage process. The stages in this process are bar graph, growth, business, marketing, management, percentage.
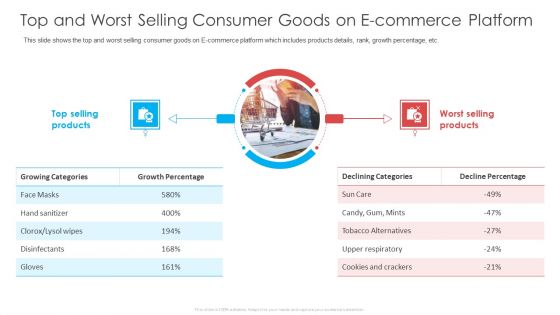
Top And Worst Selling Consumer Goods On E Commerce Platform Ppt File Outline PDF
This slide shows the top and worst selling consumer goods on E-commerce platform which includes products details, rank, growth percentage, etc. Deliver an awe-inspiring pitch with this creative top and worst selling consumer goods on e commerce platform ppt file outline pdf bundle. Topics like growth percentage, decline percentage, selling products can be discussed with this completely editable template. It is available for immediate download depending on the needs and requirements of the user.
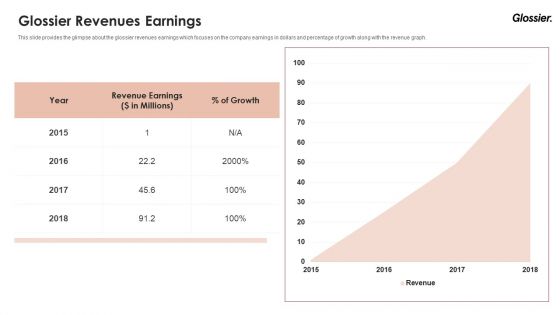
Glossier Financing Elevator Pitch Deck Glossier Revenues Earnings Ppt Slides Graphics Example PDF
This slide provides the glimpse about the glossier revenues earnings which focuses on the company earnings in dollars and percentage of growth along with the revenue graph. Deliver an awe-inspiring pitch with this creative glossier financing elevator pitch deck glossier revenues earnings ppt slides graphics example pdf bundle. Topics like glossier revenues earnings can be discussed with this completely editable template. It is available for immediate download depending on the needs and requirements of the user.

Comparison Ppt PowerPoint Presentation Layouts Gridlines
This is a comparison ppt powerpoint presentation layouts gridlines. This is a three stage process. The stages in this process are year, growth, success, percentage, finance.

Combo Chart Ppt PowerPoint Presentation Model Grid
This is a combo chart ppt powerpoint presentation model grid. This is a three stage process. The stages in this process are growth, product, percentage, marketing.

Financial Ppt PowerPoint Presentation Ideas Show
This is a financial ppt powerpoint presentation ideas show. This is a four stage process. The stages in this process are percentage, finance, business, marketing, growth.

Competitor Positioning Ppt PowerPoint Presentation Styles Aids
This is a competitor positioning ppt powerpoint presentation styles aids. This is a two stage process. The stages in this process are company growth, business, percentage, finance, graph.
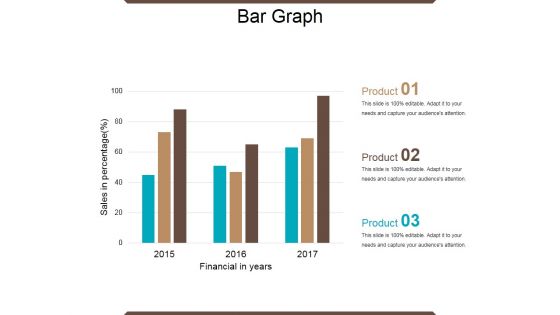
Bar Graph Ppt PowerPoint Presentation Ideas Graphic Tips
This is a bar graph ppt powerpoint presentation ideas graphic tips. This is a three stage process. The stages in this process are financial year, sales in percentage, product, bar graph, growth.

Line Chart Ppt PowerPoint Presentation Outline Infographic Template
This is a line chart ppt powerpoint presentation outline infographic template. This is a two stage process. The stages in this process are in percentage, product, in year, growth, success.

Stacked Area Clustered Column Ppt PowerPoint Presentation Show Guidelines
This is a stacked area clustered column ppt powerpoint presentation show guidelines. This is a four stage process. The stages in this process are in percentage, product, bar graph, growth, success.
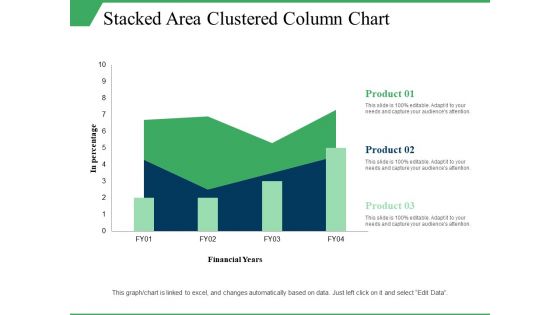
Stacked Area Clustered Column Chart Ppt PowerPoint Presentation Visual Aids Model
This is a stacked area clustered column chart ppt powerpoint presentation visual aids model. This is a three stage process. The stages in this process are in percentage, product, financial years, growth, column chart.
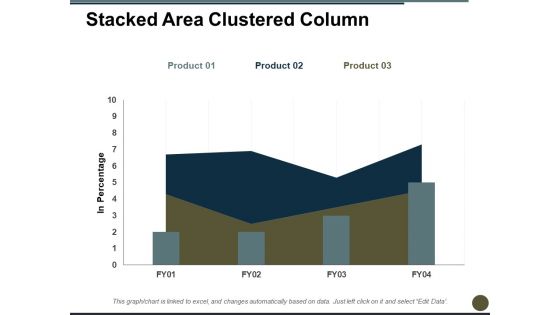
Stacked Area Clustered Column Ppt PowerPoint Presentation Professional Graphics
This is a stacked area clustered column ppt powerpoint presentation professional graphics. This is a three stage process. The stages in this process are in percentage, bar chart, product, growth, year.
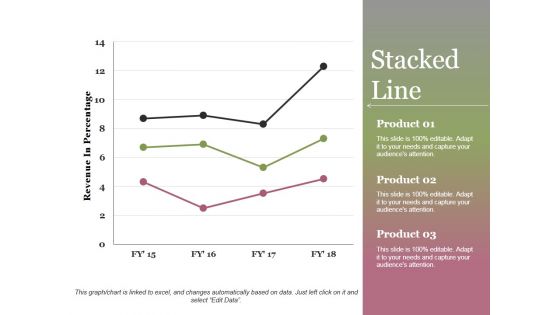
Stacked Line Ppt PowerPoint Presentation Show
This is a stacked line ppt powerpoint presentation show. This is a three stage process. The stages in this process are revenue in percentage, product, stacked line, growth, success.
Clustered Column Line Ppt PowerPoint Presentation Icon Ideas
This is a clustered column line ppt powerpoint presentation icon ideas. This is a three stage process. The stages in this process are product, in percentage, bar graph, success, growth.
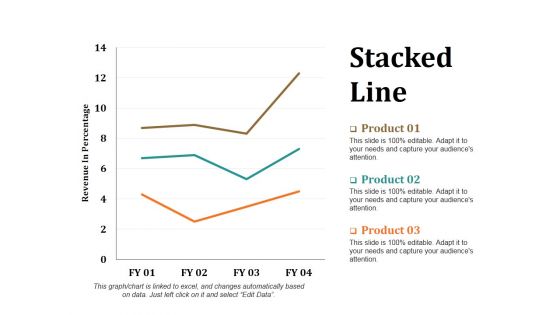
Stacked Line Ppt PowerPoint Presentation Layouts Portrait
This is a stacked line ppt powerpoint presentation layouts portrait. This is a three stage process. The stages in this process are revenue in percentage, stacked line, product, growth, success.

Insurance Sales Procedure Evaluation Metrics Graphics PDF
The following slide highlights evaluation metrics for insurance sales cycle to recognize areas of operational success and failure. It includes KPIs such as quote rate, quota rate, contract rate, number of referrals, percentage pending and sales growth rate. Presenting Insurance Sales Procedure Evaluation Metrics Graphics PDF to dispense important information. This template comprises six stages. It also presents valuable insights into the topics including Contract Rate, Percentage Pending, Sales Growth Rate . This is a completely customizable PowerPoint theme that can be put to use immediately. So, download it and address the topic impactfully.

Column Chart Ppt PowerPoint Presentation Slides Smartart
This is a column chart ppt powerpoint presentation slides smartart. This is a two stage process. The stages in this process are sales in percentage, financial year in, business, growth, strategy.
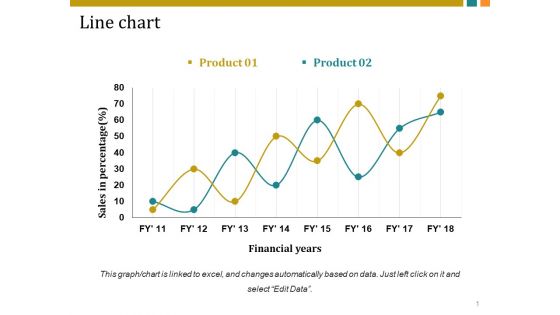
Line Chart Ppt PowerPoint Presentation Inspiration Vector
This is a line chart ppt powerpoint presentation inspiration vector. This is a two stage process. The stages in this process are sales in percentage, financial years, business, marketing, growth.
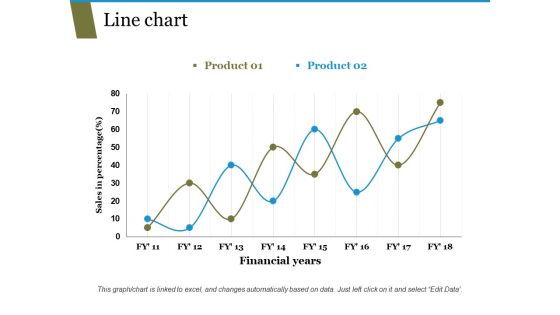
Line Chart Ppt PowerPoint Presentation Pictures Templates
This is a line chart ppt powerpoint presentation pictures templates. This is a two stage process. The stages in this process are sales in percentage, financial years, business, marketing, growth.
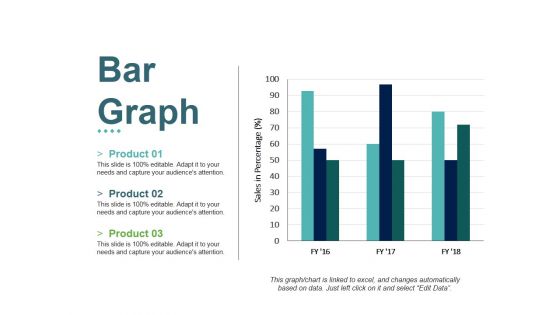
Bar Graph Ppt PowerPoint Presentation File Slides
This is a bar graph ppt powerpoint presentation file slides. This is a three stage process. The stages in this process are product, sales in percentage, bar graph, growth, success.
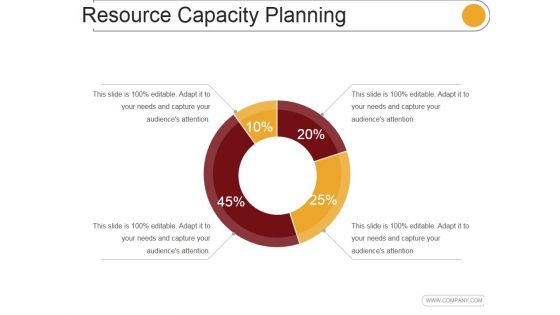
Resource Capacity Planning Template 2 Ppt PowerPoint Presentation Show
This is a resource capacity planning template 2 ppt powerpoint presentation show. This is a four stage process. The stages in this process are percentage, finance, donut, growth, success.

Big Data Opportunities And Challenges In Construction Ppt PowerPoint Presentation Outline
This is a big data opportunities and challenges in construction ppt powerpoint presentation outline. This is a three stage process. The stages in this process are finance, management, growth, percentage, business.
Stacked Column Ppt PowerPoint Presentation Icon Inspiration
This is a stacked column ppt powerpoint presentation icon inspiration. This is a two stage process. The stages in this process are stacked column, product, sales, growth, sales in percentage.
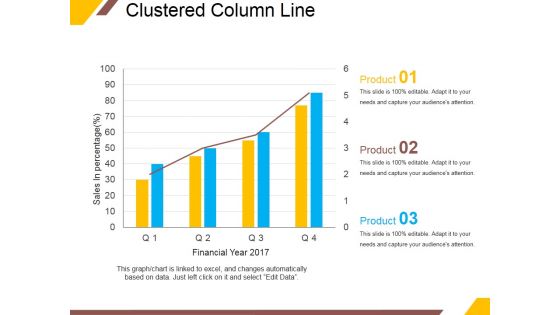
Clustered Column Line Ppt PowerPoint Presentation Portfolio Outline
This is a clustered column line ppt powerpoint presentation portfolio outline. This is a four stage process. The stages in this process are sales in percentage, financial year, product, graph, growth.
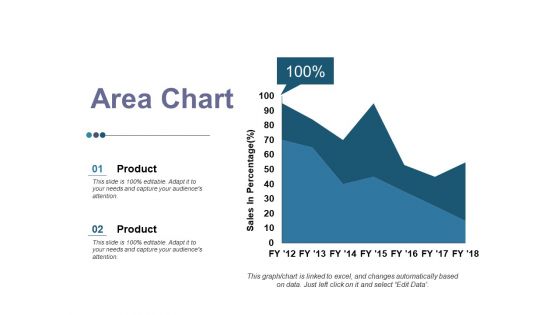
Area Chart Ppt PowerPoint Presentation Inspiration Graphics
This is a area chart ppt powerpoint presentation inspiration graphics. This is a two stage process. The stages in this process are product, area chart, business, growth, sales in percentage.

Stacked Area Clustered Column Ppt PowerPoint Presentation Summary Professional
This is a stacked area clustered column ppt powerpoint presentation summary professional. This is a three stage process. The stages in this process are product, bar graph, growth, success, in percentage.
Bar Chart Ppt PowerPoint Presentation Icon Design Templates
This is a bar chart ppt powerpoint presentation icon design templates. This is a nine stage process. The stages in this process are sales in percentage, bar graph, business, marketing, growth.
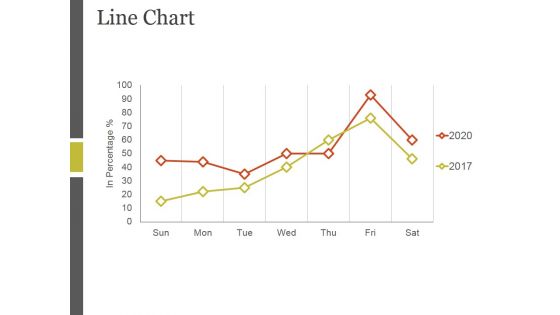
Line Chart Ppt PowerPoint Presentation Ideas Example
This is a line chart ppt powerpoint presentation ideas example. This is a two stage process. The stages in this process are sales in percentage, bar graph, business, marketing, growth.
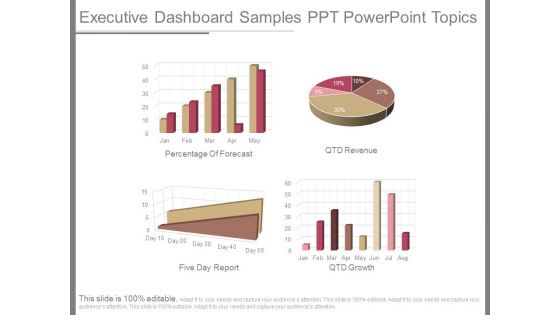
Executive Dashboard Samples Ppt Powerpoint Topics
This is a executive dashboard samples ppt powerpoint topics. This is a four stage process. The stages in this process are percentage of forecast, qtd revenue, five day report, qtd growth

Line Chart Ppt PowerPoint Presentation Gallery Objects
This is a line chart ppt powerpoint presentation gallery objects. This is a two stage process. The stages in this process are product, business, marketing, growth, in years, in percentage.
Bar Chart Ppt PowerPoint Presentation Icon Information
This is a bar chart ppt powerpoint presentation icon information. This is a one stage process. The stages in this process are product, sales in percentage, financial years, bar graph, growth.

Column Chart Ppt PowerPoint Presentation Layouts Tips
This is a column chart ppt powerpoint presentation layouts tips. This is a six stage process. The stages in this process are sales in percentage, financial year, bar graph, growth, success.

Stacked Area Clustered Column Ppt PowerPoint Presentation Ideas Themes
This is a stacked area clustered column ppt powerpoint presentation ideas themes. This is a three stage process. The stages in this process are product, in percentage, bar graph, area chart, growth.

 Home
Home