Percentage Growth
Area Chart Ppt PowerPoint Presentation Icon Graphics Tutorials
This is a area chart ppt powerpoint presentation icon graphics tutorials. This is a two stage process. The stages in this process are chart, percentage, business, growth, strategy.

Scatter Chart Ppt PowerPoint Presentation Styles Show
This is a scatter chart ppt powerpoint presentation styles show. This is a nine stage process. The stages in this process are dollars, in percentage, finance, growth strategy.
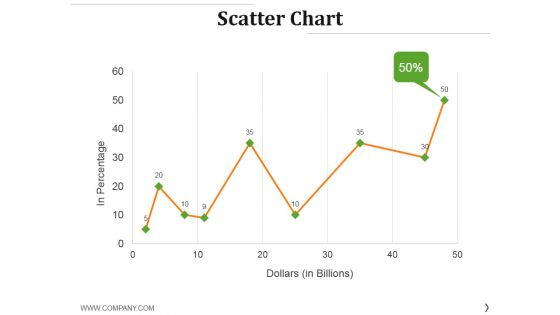
Scatter Chart Ppt PowerPoint Presentation Layouts Gridlines
This is a scatter chart ppt powerpoint presentation layouts gridlines. This is a nine stage process. The stages in this process are in percentage, dollars, growth, success, finance.

Business Diagram Timeline Two Steps In Graphic Presentation Template
This slide contains timeline two steps in graphic presentation template. This business diagram has been designed with sign board with percentages. Use this slide to depict percentage growth in business profits. Download this diagram profit growth representation in your business presentations.
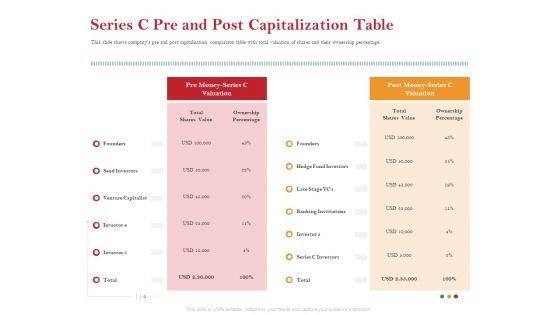
Pitch Deck For Raising Capital For Inorganic Growth Series C Pre And Post Capitalization Table Summary PDF
This slide shows companys pre and post capitalization comparison table with total valuation of shares and their ownership percentage. Deliver and pitch your topic in the best possible manner with this pitch deck for raising capital for inorganic growth series c pre and post capitalization table summary pdf. Use them to share invaluable insights on investors, valuation, venture capitalist, banking institutions and impress your audience. This template can be altered and modified as per your expectations. So, grab it now.

Strategic Brand Promotion For Enhanced Recognition And Revenue Growth Major Tasks For Successful Product Marketing Graphics PDF
This slide provides information about the major tasks that must be performed for successful product marketing strategy implementation along with task, starting date, expected task completion date, task completion status etc. This modern and well arranged Strategic Brand Promotion For Enhanced Recognition And Revenue Growth Major Tasks For Successful Product Marketing Graphics PDF provides lots of creative possibilities. It is very simple to customize and edit with the Powerpoint Software. Just drag and drop your pictures into the shapes. All facets of this template can be edited with Powerpoint no extra software is necessary. Add your own material, put your images in the places assigned for them, adjust the colors, and then you can show your slides to the world, with an animated slide included.

Stacked Column Template 2 Ppt PowerPoint Presentation Visuals
This is a stacked column template 2 ppt powerpoint presentation visuals. This is a twelve stage process. The stages in this process are business, marketing, analysis, sales in percentage, finance, growth strategy.
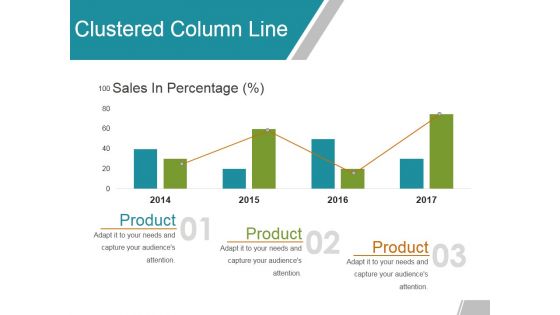
Clustered Column Line Ppt Powerpoint Presentation Gallery Mockup
This is a clustered column line ppt powerpoint presentation gallery mockup. This is a four stage process. The stages in this process are product, sales in percentage, product, growth.
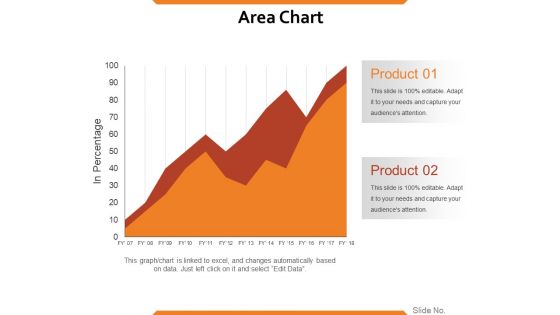
Area Chart Ppt PowerPoint Presentation Inspiration Slide Download
This is a area chart ppt powerpoint presentation inspiration slide download. This is a two stage process. The stages in this process are product, in percentage, business, growth, strategy, finance.
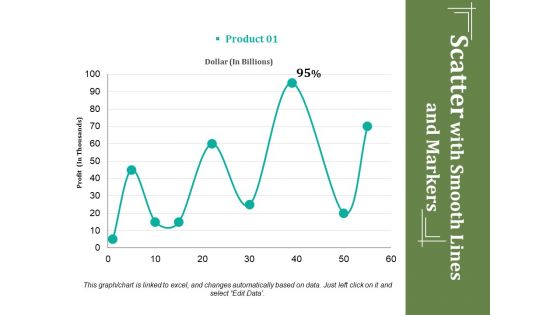
Scatter With Smooth Lines And Markers Ppt PowerPoint Presentation Ideas Deck
This is a scatter with smooth lines and markers ppt powerpoint presentation ideas deck. This is a one stage process. The stages in this process are profit, dollar, percentage, business, growth.

Clustered Column Line Ppt PowerPoint Presentation File Picture
This is a clustered column line ppt powerpoint presentation file picture. This is a three stage process. The stages in this process are business, in percentage, marketing, growth, strategy, graph.
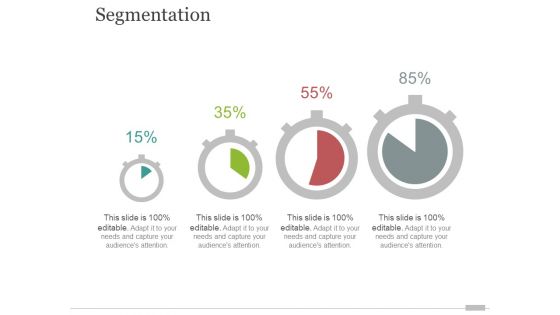
segmentation ppt powerpoint presentation ideas layout ideas
This is a segmentation ppt powerpoint presentation ideas layout ideas. This is a four stage process. The stages in this process are percentage, business, marketing, growth, strategy.
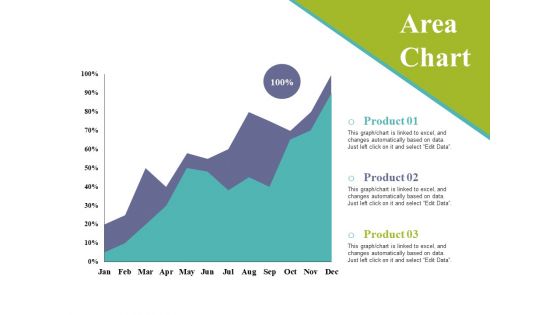
Area Chart Ppt PowerPoint Presentation Inspiration Elements
This is a area chart ppt powerpoint presentation inspiration elements. This is a two stage process. The stages in this process are chart, growth, percentage, strategy, business, marketing.
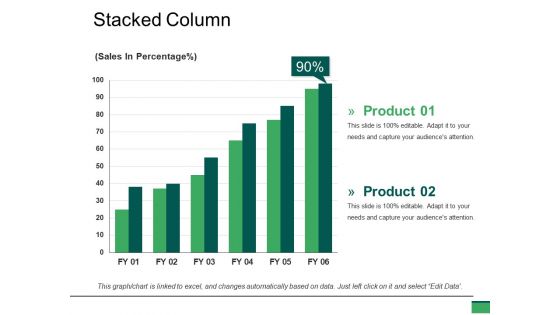
Stacked Column Ppt PowerPoint Presentation Summary Visuals
This is a stacked column ppt powerpoint presentation summary visuals. This is a two stage process. The stages in this process are growth, percentage, business, marketing, graph.
Business Diagram Human Icons With Bubbles And Different Icons Inside PowerPoint Slide
This diagram displays graph with percentage value growth. This business slide is suitable to present and compare business data. Use this diagram to build professional presentations for your viewers.
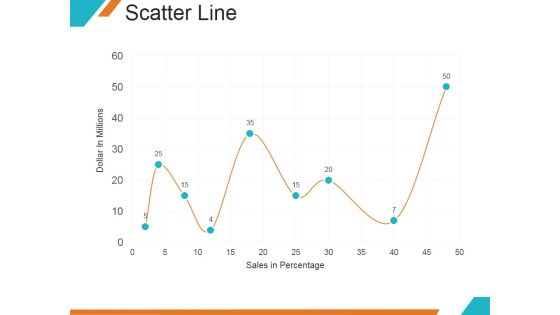
Scatter Line Ppt PowerPoint Presentation Backgrounds
This is a scatter line ppt powerpoint presentation backgrounds. This is a nine stage process. The stages in this process are dollar in millions, sales in percentage, graph, growth.

Stacked Line Ppt PowerPoint Presentation Outline Inspiration
This is a stacked line ppt powerpoint presentation outline inspiration. This is a three stage process. The stages in this process are revenue in percentage, product, growth, business, success.

Stacked Area Clustered Column Ppt PowerPoint Presentation Inspiration Shapes
This is a stacked area clustered column ppt powerpoint presentation inspiration shapes. This is a four stage process. The stages in this process are in percentage, product, growth, success, graph.
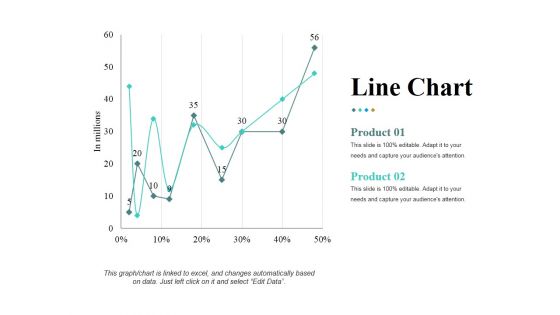
Line Chart Ppt PowerPoint Presentation Pictures Ideas
This is a line chart ppt powerpoint presentation pictures ideas. This is a two stage process. The stages in this process are in millions, percentage, finance, product, growth.
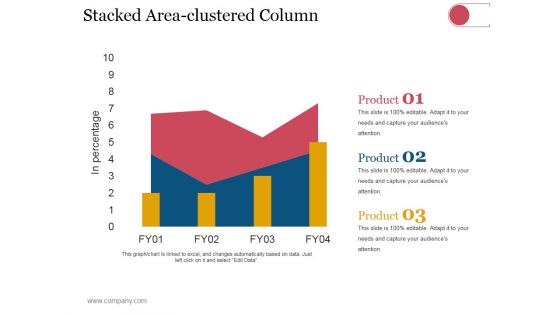
Stacked Area Clustered Column Ppt PowerPoint Presentation Styles Gridlines
This is a stacked area clustered column ppt powerpoint presentation styles gridlines. This is a three stage process. The stages in this process are dollars, in percentage, finance, growth strategy, business, strategy.
Stacked Column Ppt PowerPoint Presentation Icon Deck Ppt PowerPoint Presentation Pictures Infographic Template
This is a stacked column ppt powerpoint presentation icon deck ppt powerpoint presentation pictures infographic template. This is a two stage process. The stages in this process are stacked column, sales, percentage, product, growth.

Clustered Column Line Ppt PowerPoint Presentation Show Influencers
This is a clustered column line ppt powerpoint presentation show influencers. This is a four stage process. The stages in this process are financial year, sales in percentage, product, growth, success.
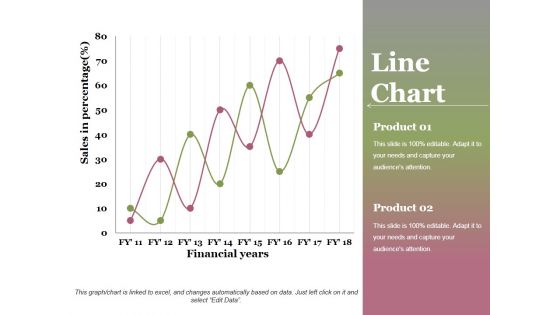
Line Chart Ppt PowerPoint Presentation Professional Graphics Design
This is a line chart ppt powerpoint presentation professional graphics design. This is a two stage process. The stages in this process are financial years, sales in percentage, product, growth, success.

Clustered Column Ppt PowerPoint Presentation File Graphics
This is a clustered column ppt powerpoint presentation file graphics. This is a two stage process. The stages in this process are product, financial year, sales in percentage, graph, growth.
Area Chart Ppt PowerPoint Presentation Inspiration Icons Ppt PowerPoint Presentation Professional File Formats
This is a area chart ppt powerpoint presentation inspiration icons ppt powerpoint presentation professional file formats. This is a two stage process. The stages in this process are area chart, product, percentage, business, growth.
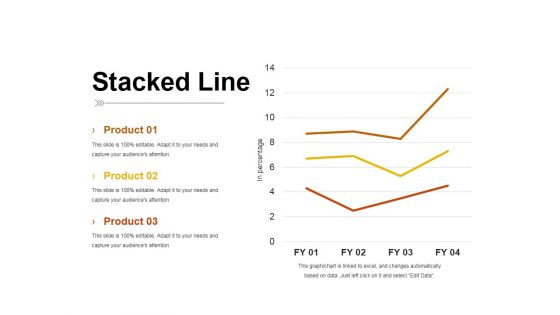
Stacked Line Ppt PowerPoint Presentation Inspiration Pictures
This is a stacked line ppt powerpoint presentation inspiration pictures. This is a three stage process. The stages in this process are product, stacked line, in percentage, business, growth.

Performance Comparison Across Quarters Ppt Ideas
This is a performance comparison across quarters ppt ideas. This is a four stage process. The stages in this process are pie, growth, percentage, finance, business, marketing.

Marketing Roadmap Planner Ppt Ideas
This is a marketing roadmap planner ppt ideas. This is a eight stage process. The stages in this process are finance, percentage, planning, year, growth.

Scatter With Smooth Lines And Markers Ppt PowerPoint Presentation Outline Inspiration
This is a scatter with smooth lines and markers ppt powerpoint presentation outline inspiration. This is a two stage process. The stages in this process are product, percentage, finance, growth, line graph.

Automobile OEM Export Trade Statistics Download PDF
This slide showcases statistical data on automobile original equipment manufacturer export sales. It shows exports by different manufacturers in fiscal years and their percentage growth. Showcasing this set of slides titled Automobile OEM Export Trade Statistics Download PDF. The topics addressed in these templates are The Swing, Hyundai India, Ford India. All the content presented in this PPT design is completely editable. Download it and make adjustments in color, background, font etc. as per your unique business setting.

Big Latest Facts About Data Global Market Microsoft PDF
This slide covers global big data market trends. It involves details such as percentage of market growth, incremental growth and percentage of growth contributed by countries. Pitch your topic with ease and precision using this Big Latest Facts About Data Global Market Microsoft PDF. This layout presents information on Big Latest Facts, About Data Global Market. It is also available for immediate download and adjustment. So, changes can be made in the color, design, graphics or any other component to create a unique layout.
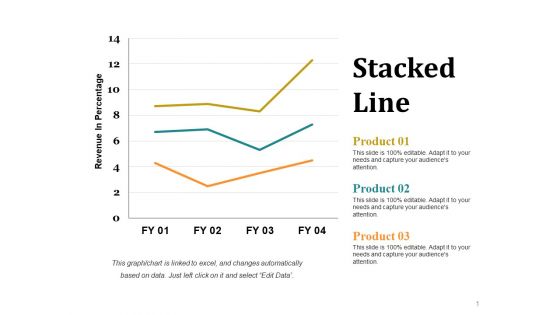
Stacked Line Ppt PowerPoint Presentation Portfolio Vector
This is a stacked line ppt powerpoint presentation portfolio vector. This is a three stage process. The stages in this process are revenue in percentage, business, marketing, growth, strategy.

Stacked Line Ppt PowerPoint Presentation Ideas Design Inspiration
This is a stacked line ppt powerpoint presentation ideas design inspiration. This is a three stage process. The stages in this process are revenue in percentage, business, marketing, growth, strategy.

Line Chart Ppt PowerPoint Presentation Inspiration Graphics
This is a line chart ppt powerpoint presentation inspiration graphics. This is a two stage process. The stages in this process are line chart, growth, percentage, marketing, analysis, business.

Area Chart Ppt PowerPoint Presentation Infographic Template Samples
This is a area chart ppt powerpoint presentation infographic template samples. This is a two stage process. The stages in this process are in percentage product, business, marketing, growth.

Column Chart Ppt PowerPoint Presentation Infographics Model
This is a column chart ppt powerpoint presentation infographics model. This is a two stage process. The stages in this process are bar graph, growth, product, percentage, year.

Line Chart Ppt PowerPoint Presentation Infographics Graphic Images
This is a line chart ppt powerpoint presentation infographics graphic images. This is a two stage process. The stages in this process are sales in percentage, financial years, growth, business, marketing.

Area Chart Ppt PowerPoint Presentation Infographic Template Guidelines
This is a area chart ppt powerpoint presentation infographic template guidelines. This is a two stage process. The stages in this process are in percentage, chart, business, growth, strategy.
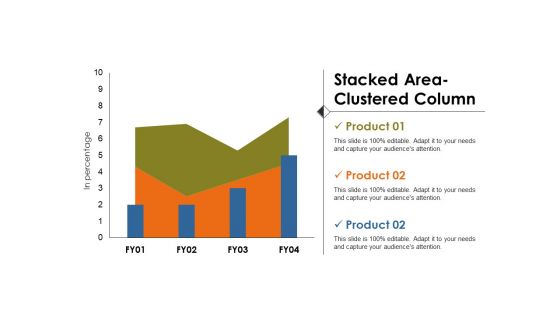
Stacked Area Clustered Column Ppt PowerPoint Presentation Summary Gallery
This is a stacked area clustered column ppt powerpoint presentation summary gallery. This is a three stage process. The stages in this process are in percentage, business, marketing, growth, strategy.

Area Chart Ppt PowerPoint Presentation Gallery Brochure
This is a area chart ppt powerpoint presentation gallery brochure. This is a two stage process. The stages in this process are product, growth in percentage, success, business.

Portfolio Evaluation Template 2 Ppt PowerPoint Presentation Inspiration Information
This is a portfolio evaluation template 2 ppt powerpoint presentation inspiration information. This is a five stage process. The stages in this process are pie, finance, percentage, business, growth.
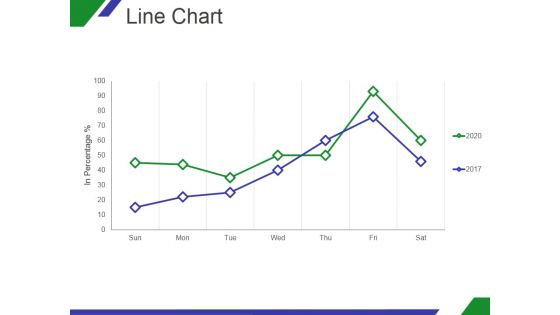
Line Chart Ppt PowerPoint Presentation Shapes
This is a line chart ppt powerpoint presentation shapes. This is a two stage process. The stages in this process are growth, in percentage, sun, mon, tue, wed.
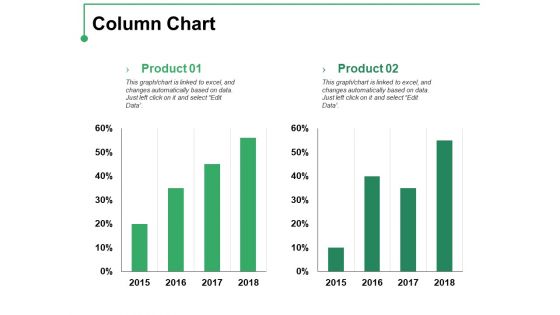
Column Chart Ppt PowerPoint Presentation Professional Template
This is a column chart ppt powerpoint presentation professional template. This is a two stage process. The stages in this process are product, percentage, finance, bar graph, growth.

Line Chart Ppt PowerPoint Presentation Show Guide
This is a line chart ppt powerpoint presentation show guide. This is a two stage process. The stages in this process are product, sales in percentage, financial years, growth, success.

Line Chart Ppt PowerPoint Presentation Gallery Rules
This is a line chart ppt powerpoint presentation gallery rules. This is a two stage process. The stages in this process are financial years, product, sales in percentage, line chart, growth.
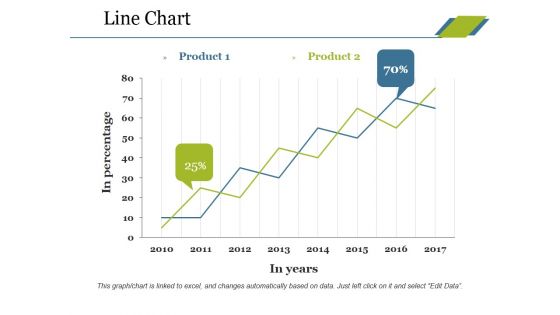
Line Chart Ppt PowerPoint Presentation Professional Tips
This is a line chart ppt powerpoint presentation professional tips. This is a two stage process. The stages in this process are product, in percentage, in years, growth, success.

Line Chart Ppt PowerPoint Presentation Slides Ideas
This is a line chart ppt powerpoint presentation slides ideas. This is a two stage process. The stages in this process are product, in percentage, in years, growth, success.
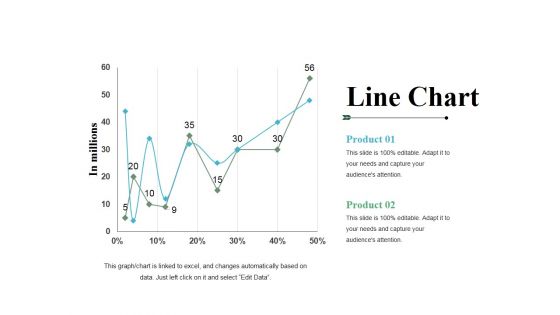
Line Chart Ppt PowerPoint Presentation File Templates
This is a line chart ppt powerpoint presentation file templates. This is a two stage process. The stages in this process are product, line chart, growth, percentage, in millions.
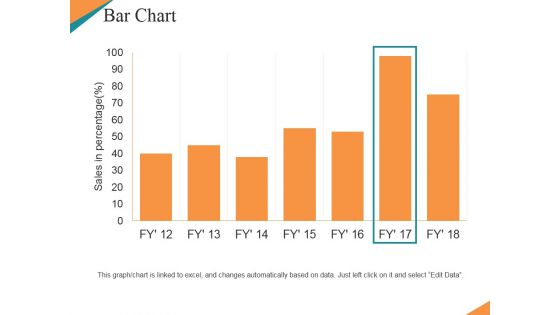
Bar Chart Ppt PowerPoint Presentation Ideas Graphic Tips
This is a bar chart ppt powerpoint presentation ideas graphic tips. This is a seven stage process. The stages in this process are sales in percentage, bar chart, growth, business, marketing.

Scatter Chart Template 1 Ppt PowerPoint Presentation Outline Gridlines
This is a scatter chart template 1 ppt powerpoint presentation outline gridlines. This is a one stage process. The stages in this process are scatter chart, sales in percentage, business, marketing, growth.
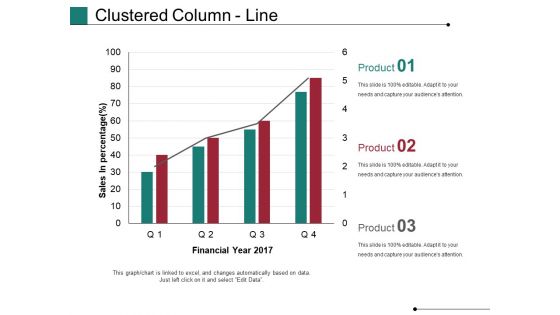
Clustered Column Line Ppt PowerPoint Presentation Model Rules
This is a clustered column line ppt powerpoint presentation model rules. This is a four stage process. The stages in this process are financial year, sales in percentage, business, marketing, growth, graph.
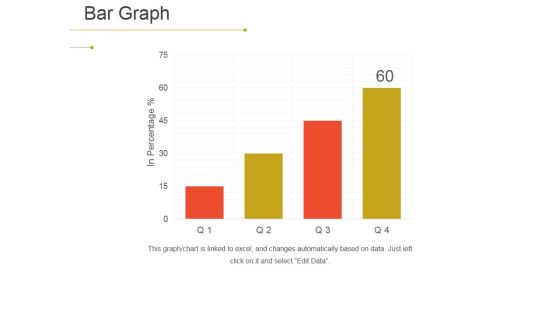
Bar Graph Ppt PowerPoint Presentation File Vector
This is a bar graph ppt powerpoint presentation file vector. This is a four stage process. The stages in this process are in percentage, bar graph, growth, business, process.

Area Chart Ppt PowerPoint Presentation Summary Templates
This is a area chart ppt powerpoint presentation summary templates. This is a two stage process. The stages in this process are product, in percentage, bar graph, growth, business.
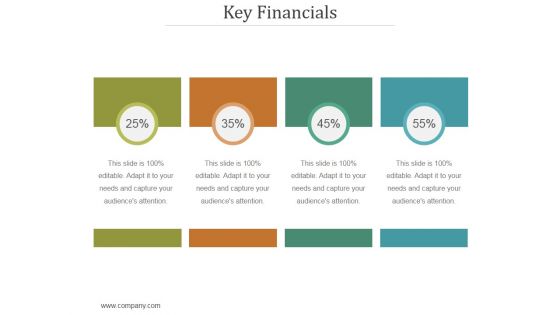
Key Financials Ppt PowerPoint Presentation Clipart
This is a key financials ppt powerpoint presentation clipart. This is a four stage process. The stages in this process are percentage, finance, success, growth, analysis.

Financial Data Analysis Ppt Samples Download
This is a financial data analysis ppt samples download. This is a three stage process. The stages in this process are arrow, growth, percentage, finance, success.

Resource Utilization And Forecasting Powerpoint Guide
This is a resource utilization and forecasting powerpoint guide. This is a five stage process. The stages in this process are donut, business, marketing, growth, percentage.
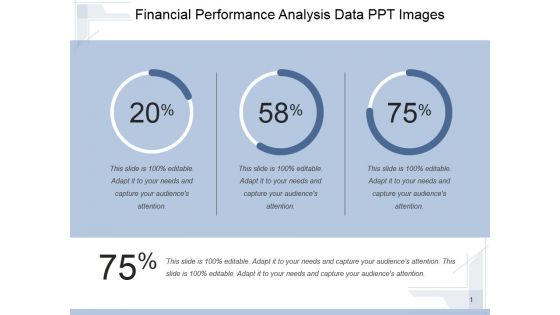
Financial Performance Analysis Data Ppt PowerPoint Presentation Topics
This is a financial performance analysis data ppt powerpoint presentation topics. This is a three stage process. The stages in this process are finance, percentage, marketing, business, growth.
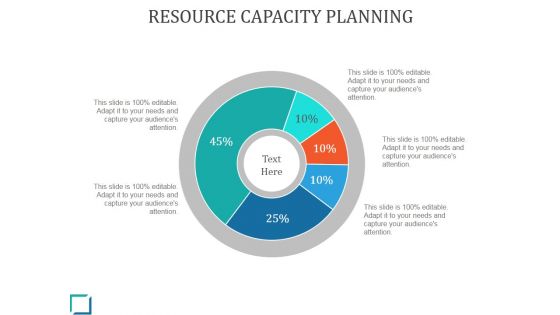
Resource Capacity Planning Ppt PowerPoint Presentation Example
This is a resource capacity planning ppt powerpoint presentation example. This is a five stage process. The stages in this process are pie, percentage, finance, management, growth.

Comparative Analysis Of Human Resource Consulting Software Implementation Rules PDF
The following slide highlights the comparative analysis of human resource consulting software implementation. It showcases region, software implementation percentage, growth, development type and software type. Pitch your topic with ease and precision using this Comparative Analysis Of Human Resource Consulting Software Implementation Rules PDF. This layout presents information on Development Type, Growth, Software Implementation. It is also available for immediate download and adjustment. So, changes can be made in the color, design, graphics or any other component to create a unique layout.
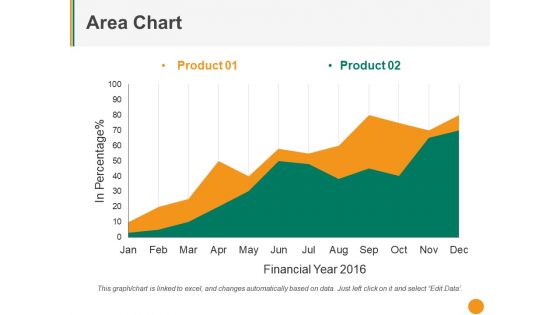
Area Chart Ppt PowerPoint Presentation File Graphic Tips
This is a area chart ppt powerpoint presentation file graphic tips. This is a two stage process. The stages in this process are product, in percentage, financial year, business, growth.

 Home
Home