Percentage Growth

Pie Business Analysis Ppt Powerpoint Presentation Model Graphics
This is a pie business analysis ppt powerpoint presentation model graphics. This is a four stage process. The stages in this process are pie chart, percentage, marketing, business, analysis.
Stacked Area Clustered Column Ppt PowerPoint Presentation Icon Examples
This is a stacked area clustered column ppt powerpoint presentation icon examples. This is a three stage process. The stages in this process are percentage, product, management, marketing, business.

Donut Pie Chart Ppt PowerPoint Presentation Infographic Template Slides
This is a donut pie chart ppt powerpoint presentation infographic template slides. This is a three stage process. The stages in this process are percentage, product, business, management, marketing.

Stacked Area Clustered Column Ppt PowerPoint Presentation Infographics Portrait
This is a stacked area clustered column ppt powerpoint presentation infographics portrait. This is a three stage process. The stages in this process are percentage, product, business, management, marketing.

5 Step Sales Process Ppt PowerPoint Presentation Inspiration Styles Cpb
This is a 5 step sales process ppt powerpoint presentation inspiration styles cpb. This is a three stage process. The stages in this process are percentage, product, business, management, marketing.

Clustered Bar Financial Ppt PowerPoint Presentation Gallery Designs Download
This is a clustered bar financial ppt powerpoint presentation gallery designs download. This is a three stage process. The stages in this process are percentage, product, business, management, marketing.
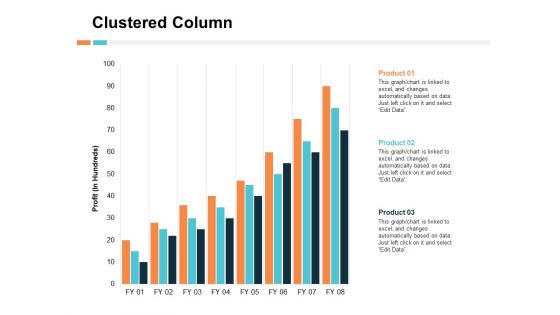
Clustered Column Product Ppt PowerPoint Presentation Outline Infographic Template
This is a clustered column product ppt powerpoint presentation outline infographic template. This is a three stage process. The stages in this process are product, percentage, business, management, marketing.
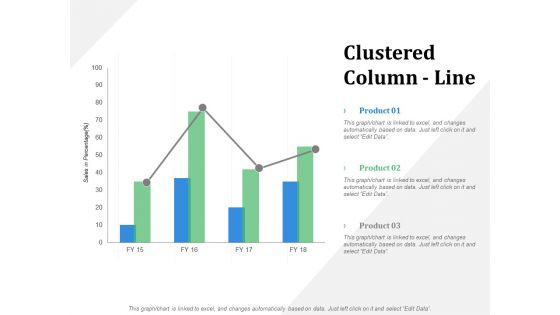
Clustered Column Line Financial Ppt PowerPoint Presentation Summary Slide
This is a clustered column line financial ppt powerpoint presentation summary slide. This is a three stage process. The stages in this process are business, management, marketing, product, percentage.

Stacked Area Clustered Column Marketing Ppt PowerPoint Presentation Infographic Template Vector
This is a stacked area clustered column marketing ppt powerpoint presentation infographic template vector. This is a three stage process. The stages in this process are business, management, marketing, product, percentage.

Stacked Chart Business Marketing Ppt PowerPoint Presentation File Design Ideas
This is a stacked chart business marketing ppt powerpoint presentation file design ideas. This is a three stage process. The stages in this process are business, management, marketing, product, percentage.

Employee Weekly Efficiency Dashboard Ppt PowerPoint Presentation Infographic Template Graphic Images
This is a employee weekly efficiency dashboard ppt powerpoint presentation infographic template graphic images. This is a six stage process. The stages in this process are percentage, product, business, management, marketing.
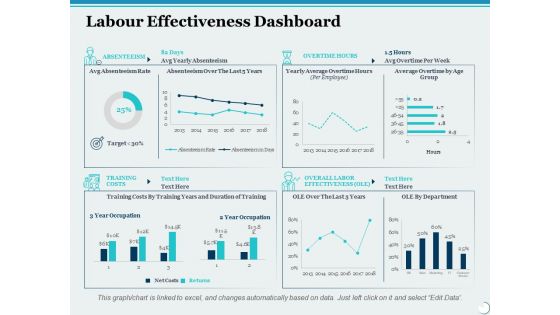
Labour Effectiveness Dashboard Ppt PowerPoint Presentation Slides File Formats
This is a labour effectiveness dashboard ppt powerpoint presentation slides file formats. This is a four stage process. The stages in this process are percentage, product, management, marketing, business.

Negative Impacts Of Workplace Stress Ppt PowerPoint Presentation Outline Slide Download
This is a negative impacts of workplace stress ppt powerpoint presentation outline slide download. This is a five stage process. The stages in this process are percentage, product, management, marketing, business.
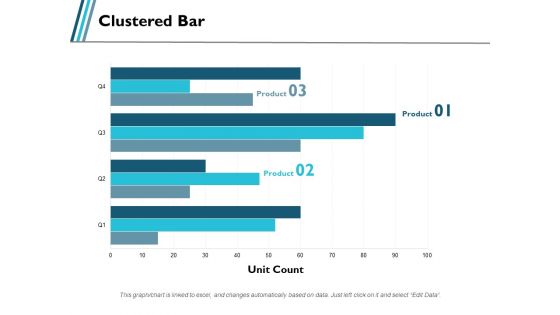
Clustered Bar Business Product Ppt PowerPoint Presentation Gallery Background
This is a clustered bar business product ppt powerpoint presentation gallery background. This is a three stage process. The stages in this process are business, management, marketing, percentage, product.
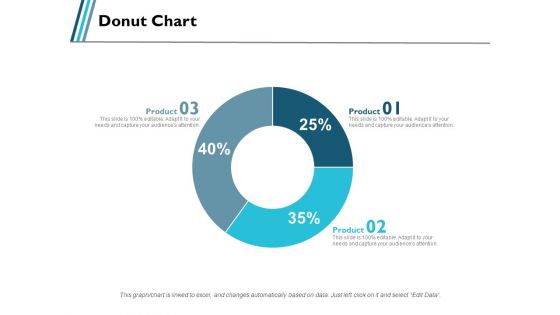
Donut Chart Marketing Product Ppt PowerPoint Presentation Slides Background Designs
This is a donut chart marketing product ppt powerpoint presentation slides background designs. This is a three stage process. The stages in this process are business, management, marketing, percentage, product.
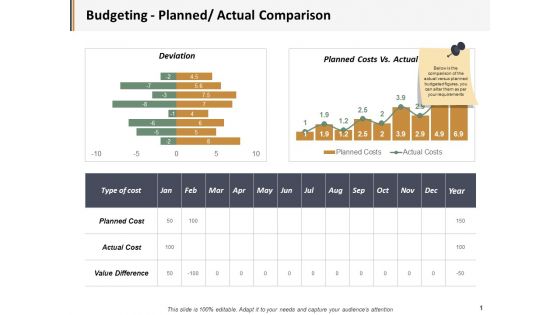
Budgeting Planned Actual Comparison Ppt PowerPoint Presentation Visual Aids Gallery
This is a budgeting planned actual comparison ppt powerpoint presentation visual aids gallery. This is a three stage process. The stages in this process are business, management, marketing, percentage, product.

Cost Performance Index Ppt PowerPoint Presentation Inspiration Graphics Example
This is a cost performance index ppt powerpoint presentation inspiration graphics example. This is a three stage process. The stages in this process are business, management, marketing, percentage, product.

Project Health Card Resourcing Ppt PowerPoint Presentation Summary Graphics Download
This is a project health card resourcing ppt powerpoint presentation summary graphics download. This is a six stage process. The stages in this process are business, management, marketing, percentage, product.
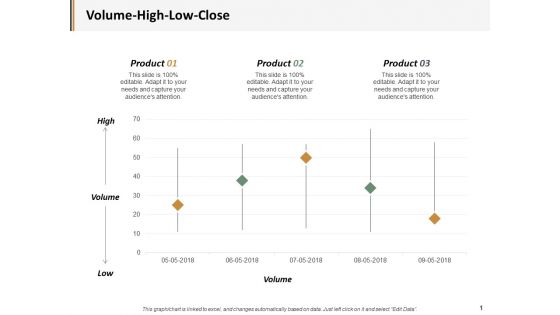
Volume High Low Close Ppt PowerPoint Presentation Ideas Example Introduction
This is a volume high low close ppt powerpoint presentation ideas example introduction. This is a three stage process. The stages in this process are business, management, marketing, percentage, product.
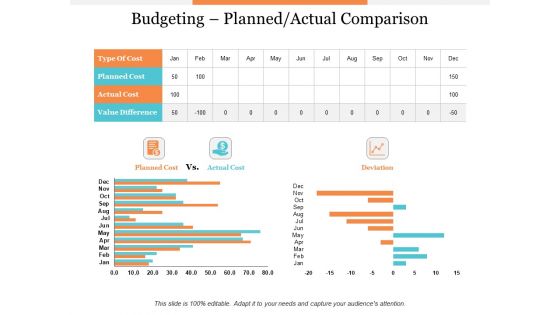
Budgeting Planned Actual Comparison Ppt PowerPoint Presentation Styles File Formats
This is a budgeting planned actual comparison ppt powerpoint presentation styles file formats. This is a three stage process. The stages in this process are product, percentage, business, management, marketing.
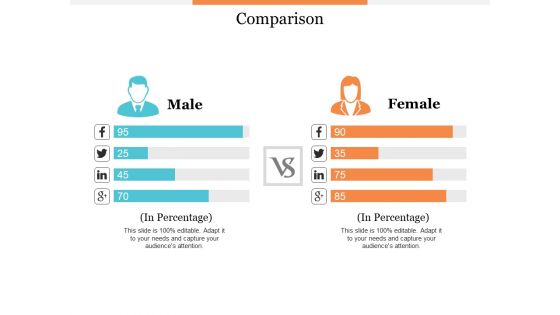
Comparison Male And Female Ppt PowerPoint Presentation Professional Skills
This is a comparison male and female ppt powerpoint presentation professional skills. This is a two stage process. The stages in this process are product, percentage, business, management, marketing.
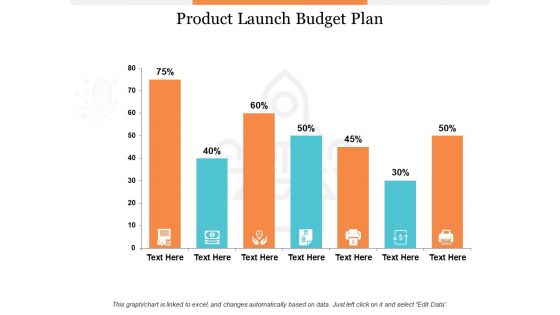
Product Launch Budget Plan Ppt PowerPoint Presentation Outline Samples
This is a product launch budget plan ppt powerpoint presentation outline samples. This is a seven stage process. The stages in this process are business, management, marketing, percentage, product.

Stacked Area Clustered Column Ppt PowerPoint Presentation Infographic Template Summary
This is a stacked area clustered column ppt powerpoint presentation infographic template summary. This is a three stage process. The stages in this process are business, management, marketing, percentage, product.

Bubble Chart Product Ppt PowerPoint Presentation Inspiration Design Ideas
This is a bubble chart product ppt powerpoint presentation inspiration design ideas. This is a one stage process. The stages in this process are business, management, marketing, product, percentage.
Open High Low Close Chart Ppt PowerPoint Presentation Icon Portrait
This is a open high low close chart ppt powerpoint presentation icon portrait. This is a two stage process. The stages in this process are business, management, marketing, percentage, product.

Social Media Key Statistics Ppt PowerPoint Presentation Show Example File
This is a social media key statistics ppt powerpoint presentation show example file. This is a five stage process. The stages in this process are business, management, marketing, percentage, product.
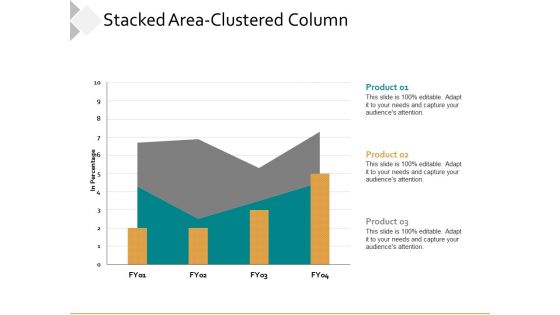
Stacked Area Clustered Column Ppt PowerPoint Presentation Model Slides
This is a stacked area clustered column ppt powerpoint presentation model slides. This is a three stage process. The stages in this process are business, management, percentage, product, marketing.
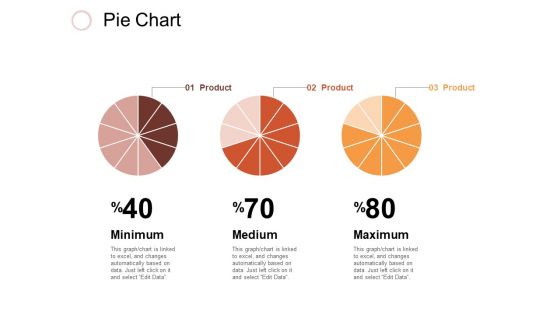
Pie Chart Investment Ppt PowerPoint Presentation Inspiration Design Inspiration
This is a pie chart investment ppt powerpoint presentation inspiration design inspiration. This is a three stage process. The stages in this process are business, management, marketing, percentage, product.
Budgeting Planned Actual Comparison Ppt PowerPoint Presentation Icon Shapes
This is a budgeting planned actual comparison ppt powerpoint presentation icon shapes. This is a two stage process. The stages in this process are finance, marketing, management, investment, product, percentage.

Cost Performance Index Ppt PowerPoint Presentation Infographics Mockup
This is a cost performance index ppt powerpoint presentation infographics mockup. This is a three stage process. The stages in this process are finance, marketing, management, investment, product, percentage.
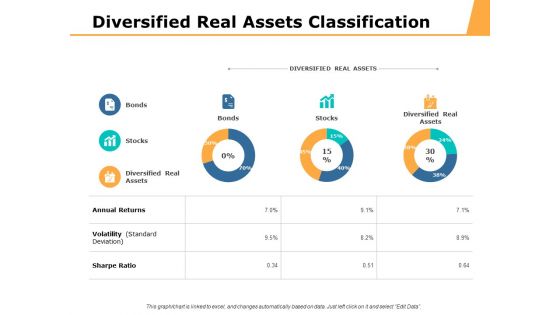
Diversified Real Assets Classification Ppt PowerPoint Presentation Ideas Tips
This is a diversified real assets classification ppt powerpoint presentation ideas tips. This is a three stage process. The stages in this process are percentage, product, business, management, marketing.
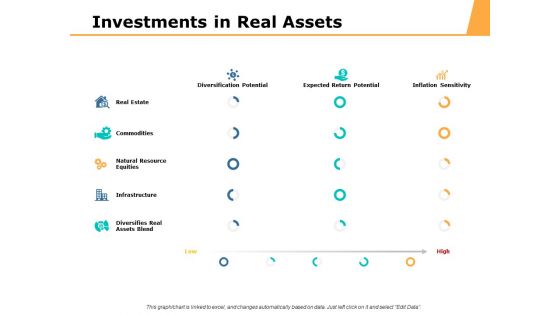
Investments In Real Assets Ppt PowerPoint Presentation Styles Pictures
This is a investments in real assets ppt powerpoint presentation styles pictures. This is a three stage process. The stages in this process are percentage, product, business, management, marketing.

Clustered Column Line Analysis Ppt PowerPoint Presentation Layouts Visual Aids
This is a clustered column line analysis ppt powerpoint presentation layouts visual aids. This is a three stage process. The stages in this process are percentage, product, business, management.
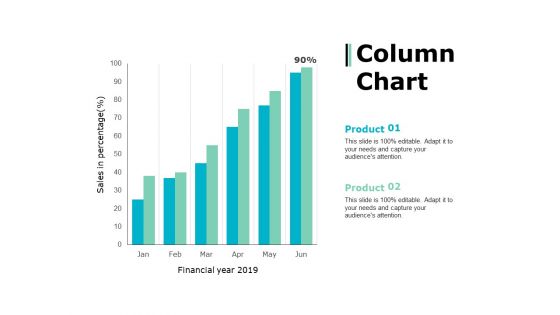
Column Chart Marketing Strategy Ppt PowerPoint Presentation Layouts Slide Portrait
This is a column chart marketing strategy ppt powerpoint presentation layouts slide portrait. This is a two stage process. The stages in this process are percentage, product, business, management, marketing.

Determine The First Platform You Want To Build The App On Ios Or Android Ppt PowerPoint Presentation Pictures Master Slide
This is a determine the first platform you want to build the app on ios or android ppt powerpoint presentation pictures master slide. This is a two stage process. The stages in this process are business, management, marketing, percentage, product.
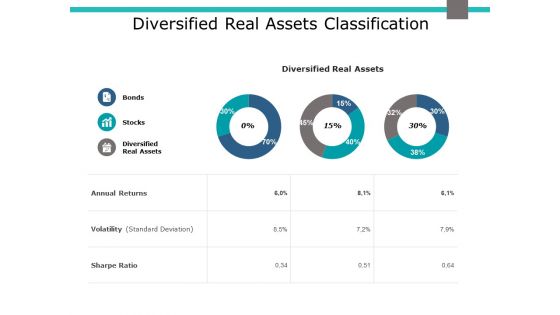
Diversified Real Assets Classification Ppt PowerPoint Presentation Slides Grid
This is a diversified real assets classification ppt powerpoint presentation slides grid. This is a three stage process. The stages in this process are business, management, marketing, percentage, product.
Investments In Real Assets Ppt PowerPoint Presentation Icon Portrait
This is a investments in real assets ppt powerpoint presentation icon portrait. This is a five stage process. The stages in this process are percentage, product, business management, marketing.

Clustered Bar Finance Ppt Powerpoint Presentation Ideas Themes
This is a clustered bar finance ppt powerpoint presentation ideas themes. This is a three stage process. The stages in this process are clustered bar, product, in percentage, years, profit.

Pie Of Pie Marketing Ppt Powerpoint Presentation Inspiration Designs
This is a pie of pie marketing ppt powerpoint presentation inspiration designs. This is a three stage process. The stages in this process are finance, pie chart, product, marketing, percentage.
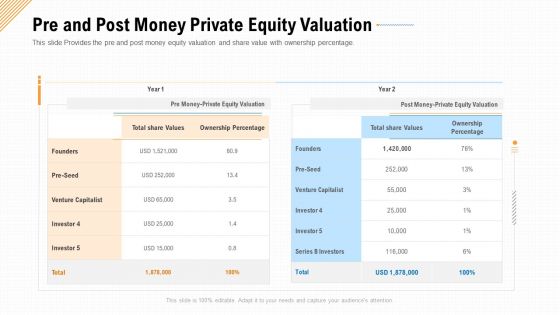
Pre And Post Money Private Equity Valuation Ppt Layouts Background Designs PDF
This slide Provides the pre and post money equity valuation and share value with ownership percentage. Deliver an awe inspiring pitch with this creative pre and post money private equity valuation ppt layouts background designs pdf bundle. Topics like share values, ownership percentage, founders can be discussed with this completely editable template. It is available for immediate download depending on the needs and requirements of the user.

Capitalization Table After Series A Ppt Portfolio Inspiration PDF
The slide provides the information about the shareholders Pre seed, founders, venture capitalists series A etc with their total share value and ownership percentage. Deliver an awe inspiring pitch with this creative capitalization table after series a ppt portfolio inspiration pdf bundle. Topics like ownership percentage, total share values, valuation can be discussed with this completely editable template. It is available for immediate download depending on the needs and requirements of the user.
Pitch Deck For Fundraising From Angel Investors Seed Funding Pre And Post Capitalization Table Ppt Icon Clipart PDF
This slide shows companys pre and post capitalization comparison table with total valuation of shares and their ownership percentage. Deliver and pitch your topic in the best possible manner with this pitch deck for fundraising from angel investors seed funding pre and post capitalization table ppt icon clipart pdf. Use them to share invaluable insights on ownership percentage, shares value, pre money seed valuation and impress your audience. This template can be altered and modified as per your expectations. So, grab it now.
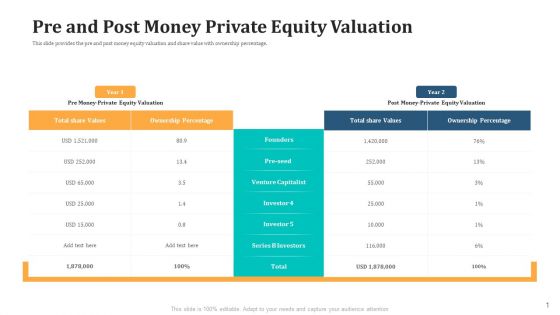
Pre And Post Money Private Equity Valuation Guidelines PDF
This slide provides the pre and post money equity valuation and share value with ownership percentage. Deliver an awe inspiring pitch with this creative pre and post money private equity valuation guidelines pdf bundle. Topics like pre money private equity valuation, post money private equity valuation, ownership percentage, total share values, venture capitalist can be discussed with this completely editable template. It is available for immediate download depending on the needs and requirements of the user.
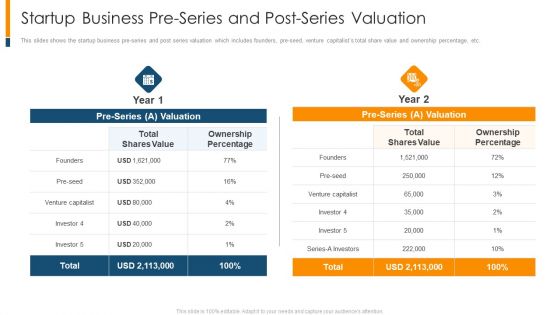
Startup Business Pre Series And Post Series Valuation Ppt Summary Format Ideas PDF
This slides shows the startup business pre-series and post series valuation which includes founders, pre-seed, venture capitalists total share value and ownership percentage, etc. Deliver an awe inspiring pitch with this creative startup business pre series and post series valuation ppt summary format ideas pdf bundle. Topics like valuation, percentage, shares value can be discussed with this completely editable template. It is available for immediate download depending on the needs and requirements of the user.
Determine IT Project Portfolio Management Tracking Dashboard Ppt Slides Pictures PDF
This slide provides information regarding IT project portfolio management tracking dashboard including details about allocated budget across portfolios, used budget percentage, estimated vs. actual cost, etc. Deliver an awe inspiring pitch with this creative determine it project portfolio management tracking dashboard ppt slides pictures pdf bundle. Topics like budget across portfolios, budget percentage, financials can be discussed with this completely editable template. It is available for immediate download depending on the needs and requirements of the user.

Startup Company Valuation Methodologies Startup Business Pre Series And Post Series Valuation Information PDF
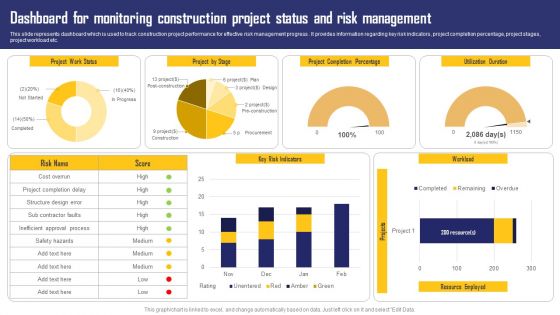
Dashboard For Monitoring Construction Project Status And Risk Management Ideas PDF
This slide represents dashboard which is used to track construction project performance for effective risk management progress . It provides information regarding key risk indicators, project completion percentage, project stages, project workload etc. Pitch your topic with ease and precision using this Dashboard For Monitoring Construction Project Status And Risk Management Ideas PDF. This layout presents information on Project Completion Percentage, Key Risk Indicators, Project By Stage. It is also available for immediate download and adjustment. So, changes can be made in the color, design, graphics or any other component to create a unique layout.
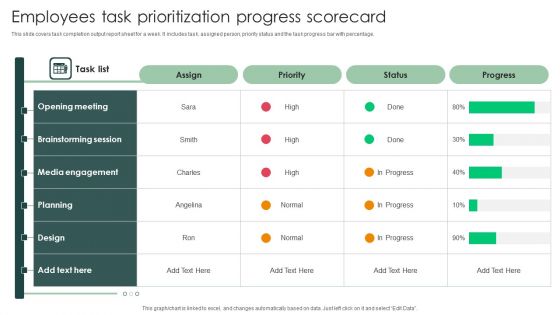
Employees Task Prioritization Progress Scorecard Download PDF
This slide covers task completion output report sheet for a week. It includes task, assigned person, priority status and the task progress bar with percentage.Pitch your topic with ease and precision using this Employees Task Prioritization Progress Scorecard Download PDF. This layout presents information on Communication Skills Development, Manager Training, Area Sales . It is also available for immediate download and adjustment. So, changes can be made in the color, design, graphics or any other component to create a unique layout.
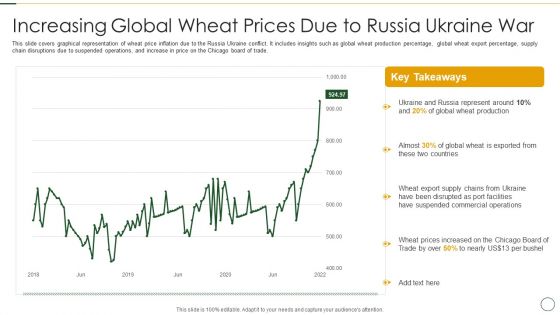
Analyzing The Impact Of Russia Ukraine Conflict On Agriculture Sector Increasing Global Wheat Professional PDF
This slide covers graphical representation of wheat price inflation due to the Russia Ukraine conflict. It includes insights such as global wheat production percentage, global wheat export percentage, supply chain disruptions due to suspended operations, and increase in price on the Chicago board of trade. Deliver an awe inspiring pitch with this creative analyzing the impact of russia ukraine conflict on agriculture sector increasing global wheat professional pdf bundle. Topics like russia represent around, global wheat production, suspended commercial operations can be discussed with this completely editable template. It is available for immediate download depending on the needs and requirements of the user.
Territory Based Sales Incentive Program Icons PDF
This slide showcases region based sales commission plan. The purpose of this template is to establish commission rates on the basis of sales performance in a particular region. It includes key components such as city, sales, executive, total sales, commission percentage, etc.Showcasing this set of slides titled Territory Based Sales Incentive Program Icons PDF. The topics addressed in these templates are Sales Executive, Commission Percentage. All the content presented in this PPT design is completely editable. Download it and make adjustments in color, background, font etc. as per your unique business setting.

Lead Metrics To Track And Measure Product Success Ppt Visual Aids Ideas Pdf
This slide highlights various key performance indicators to track and calculate product success in market. It includes key metrics such as net promoter score, client retention rate, active user percentage, customer lifetime value and churn rate. Showcasing this set of slides titled Lead Metrics To Track And Measure Product Success Ppt Visual Aids Ideas Pdf. The topics addressed in these templates are Client Retention Rate, Active User Percentage, Customer Lifetime. All the content presented in this PPT design is completely editable. Download it and make adjustments in color, background, font etc. as per your unique business setting.
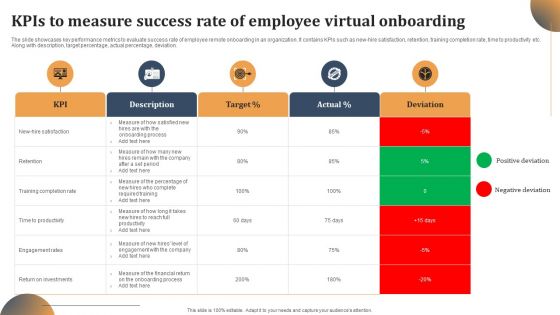
Kpis To Measure Success Rate Of Employee Virtual Onboarding Brochure PDF
The slide showcases key performance metrics to evaluate success rate of employee remote onboarding in an organization. It contains KPIs such as new-hire satisfaction, retention, training completion rate, time to productivity etc. Along with description, target percentage, actual percentage, deviation. Showcasing this set of slides titled Kpis To Measure Success Rate Of Employee Virtual Onboarding Brochure PDF. The topics addressed in these templates are Retention, Training Completion Rate, Engagement Rates. All the content presented in this PPT design is completely editable. Download it and make adjustments in color, background, font etc. as per your unique business setting.

Project Time Management To Enhance Productivity Parameters To Measure Timeliness Of Project Activities Diagrams PDF
This slide shows the parameters to measure timeliness of project activities which includes cycle time, time spent, on-time completion percentage, number of adjustments, planned hours vs. actual time spent, etc.Deliver an awe inspiring pitch with this creative Project Time Management To Enhance Productivity Parameters To Measure Timeliness Of Project Activities Diagrams PDF bundle. Topics like Development Process, Completion Percentage, Completion Allocated can be discussed with this completely editable template. It is available for immediate download depending on the needs and requirements of the user.

Attain Production Goals And Objectives Graph And Table Ppt Infographic Template Visuals PDF
This slide displays graphical representation of targeted and achieved production variance. It also includes critical insights such as target units, achieved production, achieved percentage, overachieved percentage, etc. Pitch your topic with ease and precision using this Attain Production Goals And Objectives Graph And Table Ppt Infographic Template Visuals PDF. This layout presents information on Target Vs Achieved, Key insight Table, Quarterly. It is also available for immediate download and adjustment. So, changes can be made in the color, design, graphics or any other component to create a unique layout.
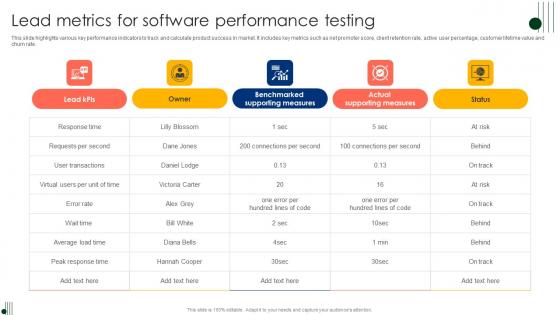
Lead Metrics For Software Performance Testing Ppt Show Visual Aids Pdf
This slide highlights various key performance indicators to track and calculate product success in market. It includes key metrics such as net promoter score, client retention rate, active user percentage, customer lifetime value and churn rate. Showcasing this set of slides titled Lead Metrics For Software Performance Testing Ppt Show Visual Aids Pdf. The topics addressed in these templates are Client Retention Rate, Active User Percentage, Customer Lifetime. All the content presented in this PPT design is completely editable. Download it and make adjustments in color, background, font etc. as per your unique business setting.
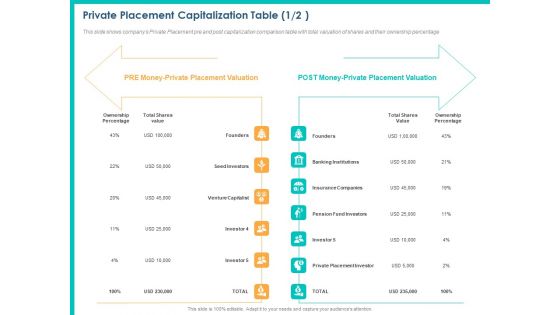
PPM Private Equity Private Placement Capitalization Table Ppt PowerPoint Presentation Infographic Template Model PDF
This slide shows companys Private Placement pre and post capitalization comparison table with total valuation of shares and their ownership percentage. This is a ppm private equity private placement capitalization table ppt powerpoint presentation infographic template model pdf template with various stages. Focus and dispense information on two stages using this creative set, that comes with editable features. It contains large content boxes to add your information on topics like ownership percentage, total shares value, founders, seed investors, venture capitalist. You can also showcase facts, figures, and other relevant content using this PPT layout. Grab it now.
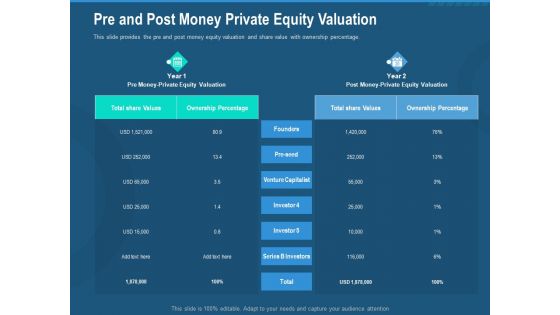
Investment Pitch To Generate Capital From Series B Venture Round Pre And Post Money Private Equity Valuation Diagrams PDF
This slide provides the pre and post money equity valuation and share value with ownership percentage. Deliver an awe-inspiring pitch with this creative investment pitch to generate capital from series b venture round pre and post money private equity valuation diagrams pdf bundle. Topics like total share values, ownership percentage, post money private equity valuation, founders, venture capitalist, series b investors, investor can be discussed with this completely editable template. It is available for immediate download depending on the needs and requirements of the user.
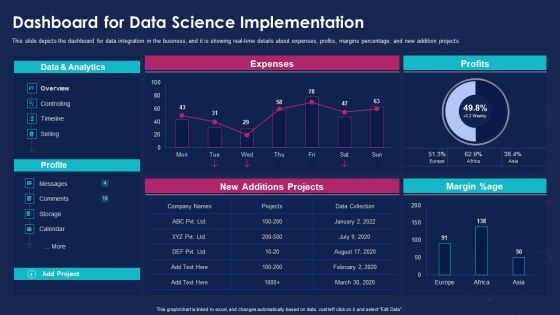
Data Analytics IT Dashboard For Data Science Implementation Ppt Portfolio Pictures PDF
This slide depicts the dashboard for data integration in the business, and it is showing real-time details about expenses, profits, margins percentage, and new addition projects. Deliver and pitch your topic in the best possible manner with this data analytics it dashboard for data science implementation ppt portfolio pictures pdf. Use them to share invaluable insights on data and analytics, margin percentage, profits, expenses, new additions projects and impress your audience. This template can be altered and modified as per your expectations. So, grab it now.
Financial Procedure Dashboard Indicating Yearly Revenue Analysis Icons PDF
This slide illustrates finance process dashboard indicating yearly revenue analysis which contains gross profit margin, operating profit ratio, net profit, revenue and cost of goods sold cogs operating expenses, etc. It can be referred by company owners who can compare it with previous years performance and make related decisions for future. Showcasing this set of slides titled Financial Procedure Dashboard Indicating Yearly Revenue Analysis Icons PDF. The topics addressed in these templates are Operating Profit Percentage, Net Profit Percentage, Operating Profit Ratio. All the content presented in this PPT design is completely editable. Download it and make adjustments in color, background, font etc. as per your unique business setting.
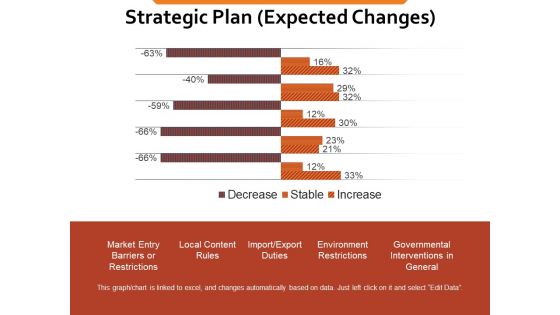
Strategic Plan Expected Changes Ppt PowerPoint Presentation Infographics Template
This is a strategic plan expected changes ppt powerpoint presentation infographics template. This is a two stage process. The stages in this process are market entry barriers or restrictions, local content rules, import export duties, environment restrictions, governmental interventions in general, percentage.

 Home
Home