Percentage Growth
Area Chart Ppt PowerPoint Presentation Icon Smartart
This is a area chart ppt powerpoint presentation icon smartart. This is a two stage process. The stages in this process are percentage, product, business, marketing.
Financial Ppt PowerPoint Presentation Summary Icon
This is a financial ppt powerpoint presentation summary icon. This is a three stage process. The stages in this process are financial, percentage, product, business, marketing.
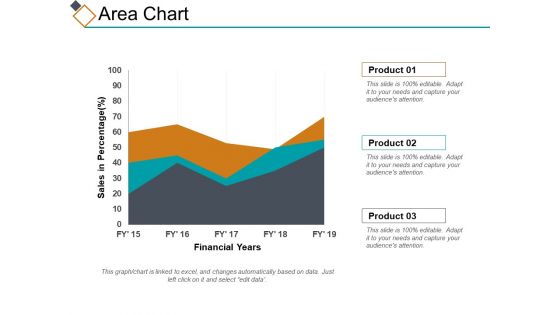
Area Chart Ppt PowerPoint Presentation File Design Inspiration
This is a area chart ppt powerpoint presentation file design inspiration. This is a three stage process. The stages in this process are percentage, product, business, management, marketing.
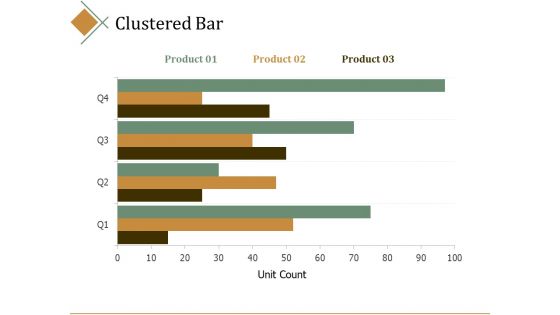
Clustered Bar Ppt PowerPoint Presentation Professional Guide
This is a clustered bar ppt powerpoint presentation professional guide. This is a three stage process. The stages in this process are percentage, product, business, management, marketing.
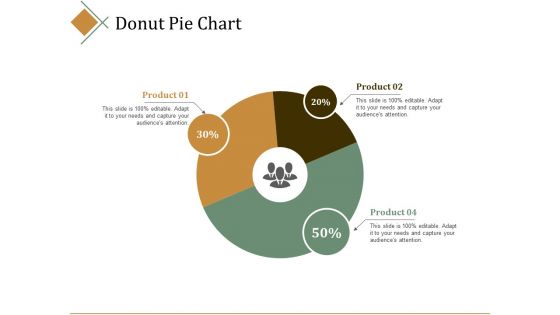
Donut Pie Chart Ppt PowerPoint Presentation Inspiration Elements
This is a donut pie chart ppt powerpoint presentation inspiration elements. This is a three stage process. The stages in this process are percentage, product, business, management, marketing.
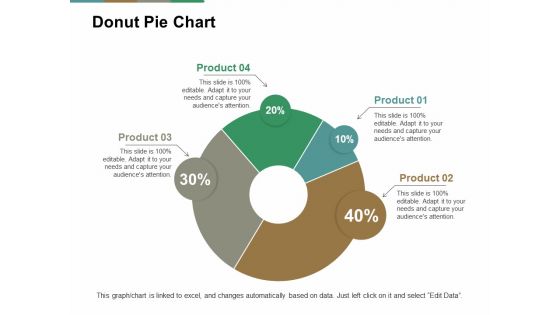
Donut Pie Chart Ppt PowerPoint Presentation Pictures Summary
This is a donut pie chart ppt powerpoint presentation pictures summary. This is a four stage process. The stages in this process are percentage, product, business, management, marketing.

Revenue Based Funding Ppt PowerPoint Presentation Guide Cpb
This is a revenue based funding ppt powerpoint presentation guide cpb. This is a two stage process. The stages in this process are percentage, product, business, marketing, management.

Area Chart Financial Ppt PowerPoint Presentation Outline Information
This is a area chart financial ppt powerpoint presentation outline information. This is a three stage process. The stages in this process are percentage, product, business, management, marketing.
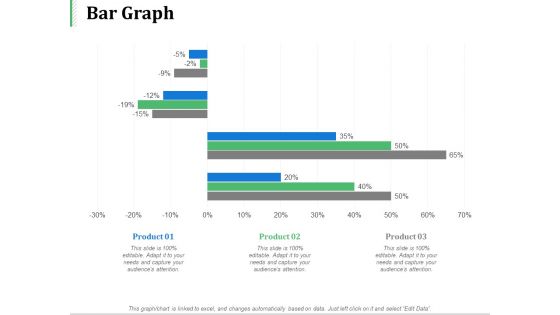
Bar Graph Product Ppt PowerPoint Presentation Layouts Ideas
This is a bar graph product ppt powerpoint presentation layouts ideas. This is a three stage process. The stages in this process are business, management, marketing, product, percentage.
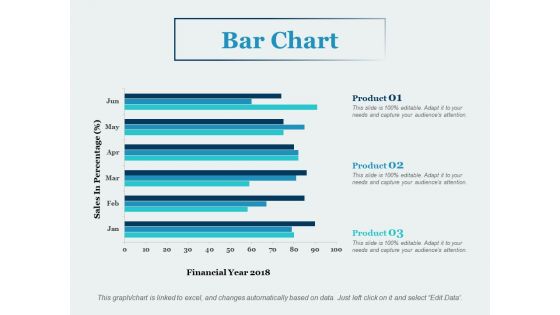
Bar Chart Product Ppt PowerPoint Presentation Summary Diagrams
This is a bar chart product ppt powerpoint presentation summary diagrams. This is a three stage process. The stages in this process are business, management, marketing, percentage, product.
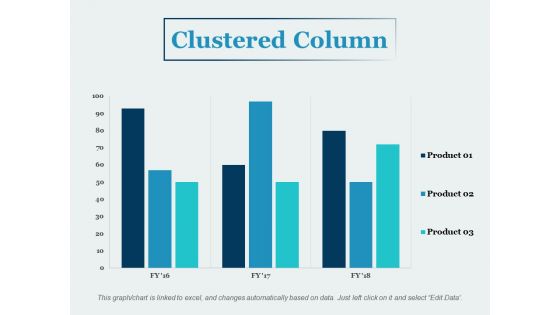
Clustered Column Financial Ppt PowerPoint Presentation Summary Information
This is a clustered column financial ppt powerpoint presentation summary information. This is a three stage process. The stages in this process are business, management, marketing, percentage, product.
Pie Chart Product Ppt PowerPoint Presentation Gallery Icon
This is a pie chart product ppt powerpoint presentation gallery icon. This is a five stage process. The stages in this process are percentage, product, management, marketing, business.
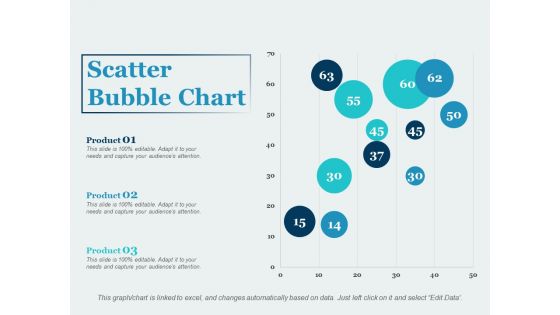
Scatter Bubble Chart Ppt PowerPoint Presentation Outline Demonstration
This is a scatter bubble chart ppt powerpoint presentation outline demonstration. This is a three stage process. The stages in this process are percentage, product, management, marketing, business.
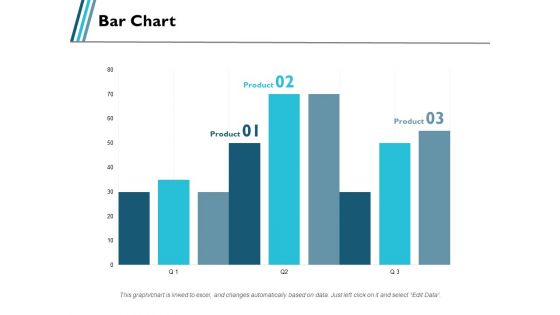
Bar Chart Product Ppt PowerPoint Presentation Portfolio Visuals
This is a bar chart product ppt powerpoint presentation portfolio visuals. This is a three stage process. The stages in this process are business, management, marketing, percentage, product.
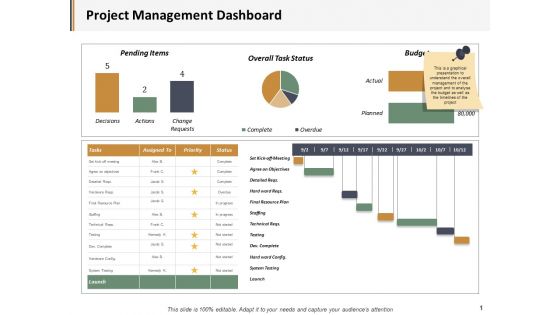
Project Management Dashboard Ppt PowerPoint Presentation Deck
This is a project management dashboard ppt powerpoint presentation deck. This is a five stage process. The stages in this process are business, management, marketing, percentage, product.

Budgeting Template Ppt PowerPoint Presentation Gallery Design Inspiration
This is a budgeting template ppt powerpoint presentation gallery design inspiration. This is a five stage process. The stages in this process are product, percentage, business, management, marketing.
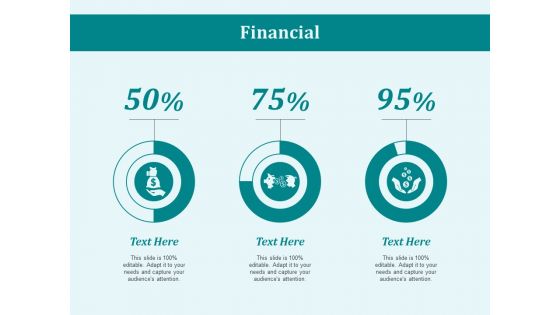
Financial Marketing Ppt PowerPoint Presentation Styles Graphics Tutorials
This is a financial marketing ppt powerpoint presentation styles graphics tutorials. This is a three stage process. The stages in this process are business, management, marketing, product, percentage.

Industry Market Share Ppt PowerPoint Presentation Pictures Format
This is a industry market share ppt powerpoint presentation pictures format. This is a six stage process. The stages in this process are percentage, product, management, marketing, business.
Market Potential Ppt PowerPoint Presentation Icon Influencers
This is a market potential ppt powerpoint presentation icon influencers. This is a six stage process. The stages in this process are percentage, product, management, marketing, business.
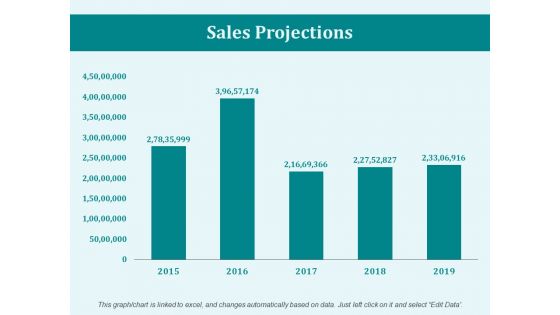
Sales Projections Ppt PowerPoint Presentation Summary Show
This is a sales projections ppt powerpoint presentation summary show. This is a five stage process. The stages in this process are business, marketing, management, percentage, product.

Clustered Column Line Ppt PowerPoint Presentation Summary Guidelines
This is a clustered column line ppt powerpoint presentation summary guidelines. This is a three stage process. The stages in this process are business, management, percentage, product, marketing.
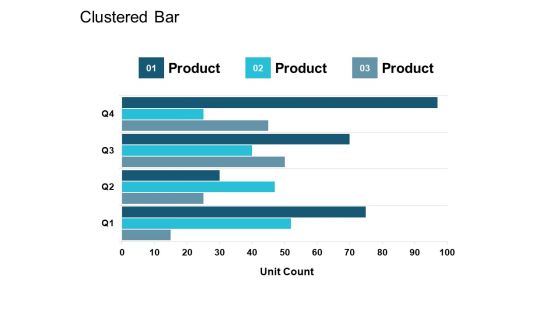
Clustered Bar Product Ppt PowerPoint Presentation Inspiration Elements
This is a clustered bar product ppt powerpoint presentation inspiration elements. This is a three stage process. The stages in this process are percentage, product, business, management, marketing.
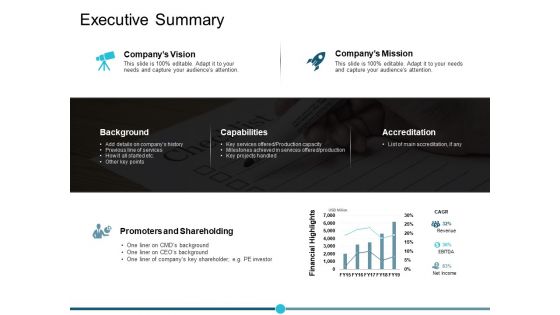
Executive Summary Ppt PowerPoint Presentation Model
This is a executive summary ppt powerpoint presentation model. This is a three stage process. The stages in this process are percentage, product, business, management, marketing.

Scatter Chart Financial Ppt PowerPoint Presentation Model Deck
This is a scatter chart financial ppt powerpoint presentation model deck. This is a one stage process. The stages in this process are business, management, marketing, percentage, product.
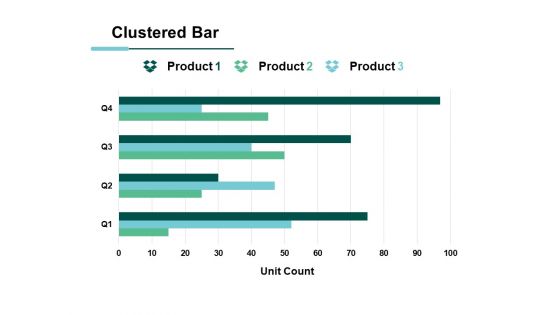
Clustered Bar Financial Ppt PowerPoint Presentation Model Format
This is a clustered bar financial ppt powerpoint presentation model format. This is a three stage process. The stages in this process are business, management, marketing, percentage, product.

Location Information Geography Ppt PowerPoint Presentation Summary Example
This is a location information geography ppt powerpoint presentation summary example. This is a five stage process. The stages in this process are percentage, product, business, management, marketing.

Clock To Represent Time Of Completion Task PowerPoint Templates Ppt Backgrounds For Slides 0413
We present our Clock To Represent Time Of Completion Task PowerPoint Templates PPT Backgrounds For Slides 0413.Download our Clocks PowerPoint Templates because Our PowerPoint Templates and Slides help you meet the demand of the Market. Just browse and pick the slides that appeal to your intuitive senses. Use our Business PowerPoint Templates because You can safely bank on our PowerPoint Templates and Slides. They will provide a growth factor to your valuable thoughts. Download our Time planning PowerPoint Templates because Our PowerPoint Templates and Slides will provide you a launch platform. Give a lift off to your ideas and send them into orbit. Download and present our Success PowerPoint Templates because Our PowerPoint Templates and Slides are a sure bet. Gauranteed to win against all odds. Download and present our Shapes PowerPoint Templates because You have the co-ordinates for your destination of success. Let our PowerPoint Templates and Slides map out your journey.Use these PowerPoint slides for presentations relating to Clock with time to complete, clocks, time planning, success, shapes, business. The prominent colors used in the PowerPoint template are Red, Black, White.

Change Management Sponsors Ppt PowerPoint Presentation Styles Layout Ideas
This is a change management sponsors ppt powerpoint presentation styles layout ideas. This is a two stage process. The stages in this process are stakeholder, leadership, management, business, percentage.

Change Transition Plan Template 1 Ppt PowerPoint Presentation Layouts Summary
This is a change transition plan template 1 ppt powerpoint presentation layouts summary. This is a nine stage process. The stages in this process are tasks, start, complete, duration, percentage.

Project Progress And Reasons For Delay Ppt PowerPoint Presentation Pictures Influencers
This is a project progress and reasons for delay ppt powerpoint presentation pictures influencers. This is a two stage process. The stages in this process are graph, percentage, finance, business, marketing.

Change Management Responsibilities Checklist Ppt PowerPoint Presentation Styles Example Topics
This is a change management responsibilities checklist ppt powerpoint presentation styles example topics. This is a four stage process. The stages in this process are business, marketing, management, percentage.
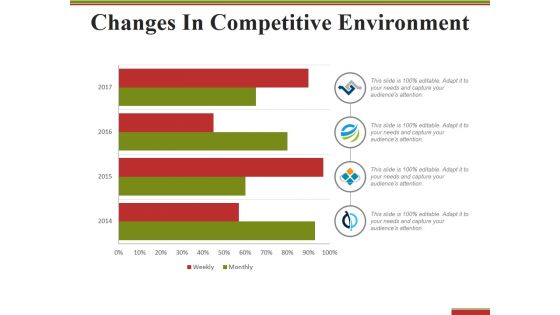
Changes In Competitive Environment Template 2 Ppt PowerPoint Presentation Infographic Template Themes
This is a changes in competitive environment template 2 ppt powerpoint presentation infographic template themes. This is a four stage process. The stages in this process are weekly, monthly, year, finance, percentage.
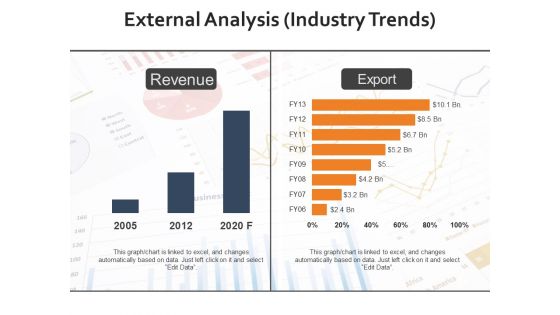
External Analysis Industry Trends Ppt PowerPoint Presentation Infographic Template Visuals
This is a external analysis industry trends ppt powerpoint presentation infographic template visuals. This is a two stage process. The stages in this process are export, revenue, percentage, years, business, analysis.
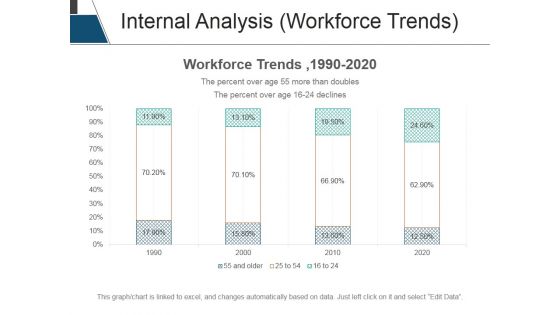
Internal Analysis Workforce Trends Ppt PowerPoint Presentation Summary Example Topics
This is a internal analysis workforce trends ppt powerpoint presentation summary example topics. This is a four stage process. The stages in this process are workforce trends, percentage, business, marketing, management.

PowerPoint Design Slides Circular Process Business Ppt Backgrounds
PowerPoint Design Slides Circular Process Business PPT Backgrounds-This PowerPoint slide has circular process chart divided two parts that can be used for comparison. You can easily edit the size, percentage, text and color.-PowerPoint Design Slides Circular Process Business PPT Backgrounds
Area Chart Ppt PowerPoint Presentation Gallery Icons
This is a area chart ppt powerpoint presentation gallery icons. This is a two stage process. The stages in this process are financial year, sales in percentage, product, finance, graph.
Bar Chart Ppt PowerPoint Presentation Icon Demonstration
This is a bar chart ppt powerpoint presentation icon demonstration. This is a seven stage process. The stages in this process are product, sales in percentage, financial year, graph.
Bar Chart Ppt PowerPoint Presentation Icon Layout
This is a bar chart ppt powerpoint presentation icon layout. This is a one stage process. The stages in this process are sales in percentage, financial years, bar chart, finance, marketing.
Column Chart Ppt PowerPoint Presentation Icon Guide
This is a column chart ppt powerpoint presentation icon guide. This is a two stage process. The stages in this process are business, year, sales in percentage, marketing, graph.
Area Chart Ppt PowerPoint Presentation Icon Aids
This is a area chart ppt powerpoint presentation icon aids. This is a three stage process. The stages in this process are financial years, sales in percentage, business, marketing, graph.
Clustered Column Ppt PowerPoint Presentation Icon Design Inspiration
This is a clustered column ppt powerpoint presentation icon design inspiration. This is a two stage process. The stages in this process are product, financial year, sales in percentage, clustered column.
Line Chart Ppt PowerPoint Presentation Infographic Template Icons
This is a line chart ppt powerpoint presentation infographic template icons. This is a two stage process. The stages in this process are sales in percentage, financial years, product, line chart.
Column Chart Ppt PowerPoint Presentation Infographic Template Icon
This is a column chart ppt powerpoint presentation infographic template icon. This is a two stage process. The stages in this process are business, marketing, sales in percentage, financial year, graph.

Prospective Sources Of Profit Generation Ppt Example 2015
This is a prospective sources of profit generation ppt example 2015. This is a five stage process. The stages in this process are finance, success, business, marketing, percentage, pie.
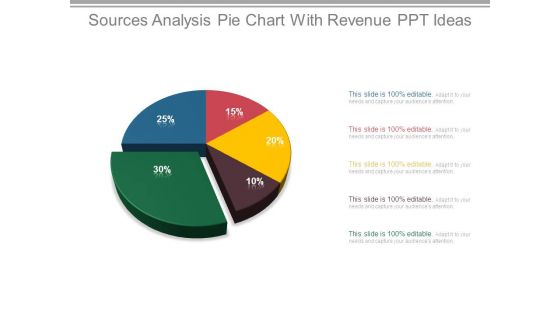
Sources Analysis Pie Chart With Revenue Ppt Ideas
This is a sources analysis pie chart with revenue ppt ideas. This is a five stage process. The stages in this process are finance, success, business, marketing, percentage, pie chart.

Sources Of Revenue Segmentation Powerpoint Slide Presentation Examples
This is a sources of revenue segmentation powerpoint slide presentation examples. This is a five stage process. The stages in this process are finance, success, business, marketing, percentage, pie chart.
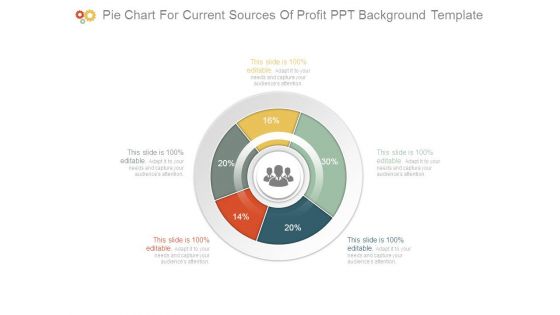
Pie Chart For Current Sources Of Profit Ppt Background Template
This is a pie chart for current sources of profit ppt background template. This is a five stage process. The stages in this process are finance, success, business, marketing, percentage, donut.
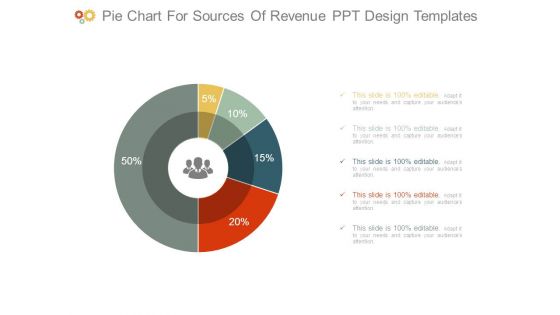
Pie Chart For Sources Of Revenue Ppt Design Templates
This is a pie chart for sources of revenue ppt design templates. This is a five stage process. The stages in this process are finance, success, business, marketing, percentage, donut.
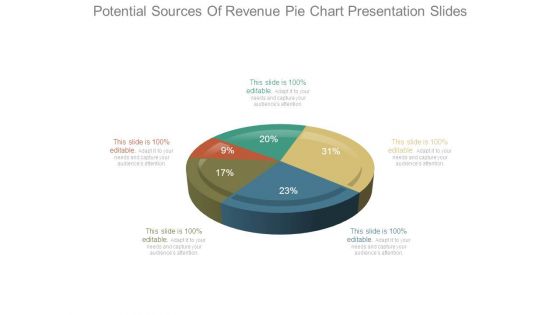
Potential Sources Of Revenue Pie Chart Presentation Slides
This is a potential sources of revenue pie chart presentation slides. This is a five stage process. The stages in this process are finance, success, business, marketing, percentage, pie.

Market Share Of Competitors Ppt PowerPoint Presentation Slides
This is a market share of competitors ppt powerpoint presentation slides. This is a six stage process. The stages in this process are market share in, competitor, pie, finance, percentage.

Timeline Analysis Ppt PowerPoint Presentation Pictures Master Slide
This is a timeline analysis ppt powerpoint presentation pictures master slide. This is a six stage process. The stages in this process are process change, timeline, business, management, percentage.

Meet Our Awesome Team Ppt PowerPoint Presentation Styles Graphics Design
This is a meet our awesome team ppt powerpoint presentation styles graphics design. This is a one stage process. The stages in this process are strategy, management, finance, business, percentage.

Magnifying Glass For Sales Performance Review Ppt PowerPoint Presentation Model
This is a magnifying glass for sales performance review ppt powerpoint presentation model. This is a four stage process. The stage in this process are magnifier glass, pie, finance, percentage, research.

Stacked Bar Ppt PowerPoint Presentation Infographics Graphics
This is a stacked bar ppt powerpoint presentation infographics graphics. This is a four stage process. The stages in this process are business, strategy, marketing, success, unit count, in percentage.
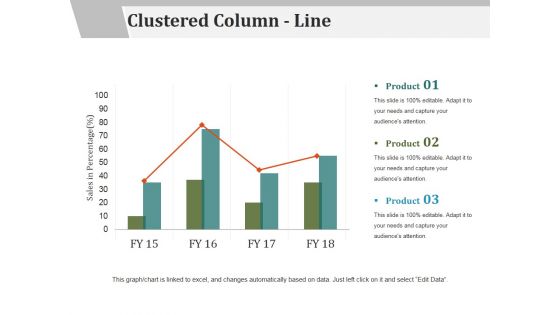
Clustered Column Line Ppt PowerPoint Presentation File Examples
This is a clustered column line ppt powerpoint presentation file examples. This is a three stage process. The stages in this process are sales in percentage, product, business, marketing, success.

Line Chart Ppt PowerPoint Presentation Outline Samples
This is a line chart ppt powerpoint presentation outline samples. This is a two stage process. The stages in this process are sales in percentage, product, business, marketing, success.
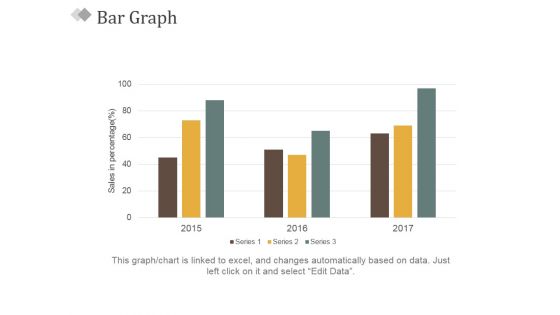
Bar Graph Ppt PowerPoint Presentation Slides Visual Aids
This is a bar graph ppt powerpoint presentation slides visual aids. This is a three stage process. The stages in this process are sales in percentage, bar graph, business, marketing, success.
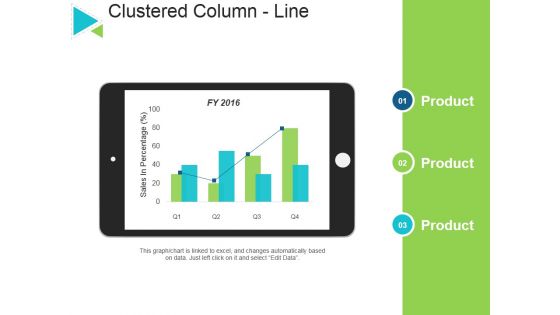
Clustered Column Line Ppt PowerPoint Presentation Outline Infographic Template
This is a clustered column line ppt powerpoint presentation outline infographic template. This is a three stage process. The stages in this process are product, sales in percentage, business, marketing, success.

Funding Updates Equity Ppt PowerPoint Presentation Outline Gridlines
This is a funding updates equity ppt powerpoint presentation outline gridlines. This is a one stage process. The stages in this process are shareholding pattern, percentage, business, marketing, success.
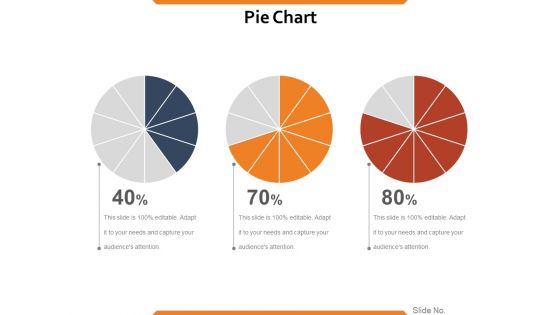
Pie Chart Ppt PowerPoint Presentation Infographics Show
This is a pie chart ppt powerpoint presentation infographics show. This is a three stage process. The stages in this process are process, percentage, business, marketing, success, pie chart.

 Home
Home