Percentage Comparison
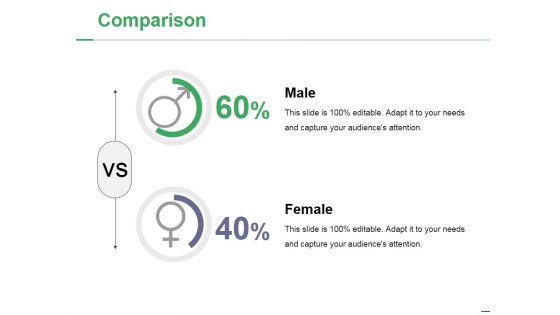
Comparison Ppt PowerPoint Presentation Infographics Elements
This is a comparison ppt powerpoint presentation infographics elements. This is a two stage process. The stages in this process are male, female, business, percentage, finance.

Comparison Ppt PowerPoint Presentation Pictures Shapes
This is a comparison ppt powerpoint presentation pictures shapes. This is a two stage process. The stages in this process are compare, percentage, finance, business, marketing.

Comparison Ppt PowerPoint Presentation Ideas Example Introduction
This is a comparison ppt powerpoint presentation ideas example introduction. This is a two stage process. The stages in this process are male, female, finance, percentage, compare.
Comparison Ppt PowerPoint Presentation Pictures Icon
This is a comparison ppt powerpoint presentation pictures icon. This is a two stage process. The stages in this process are compare, percentage, finance, business, marketing.
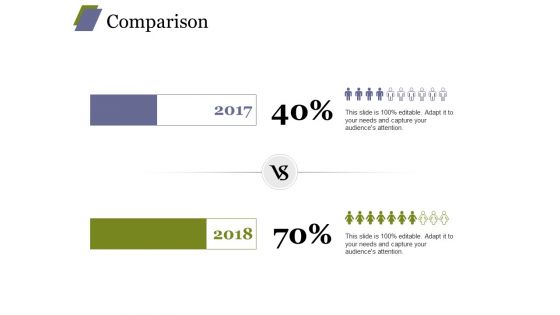
Comparison Ppt PowerPoint Presentation Summary Design Ideas
This is a comparison ppt powerpoint presentation summary design ideas. This is a two stage process. The stages in this process are compare, percentage, finance, business, marketing.
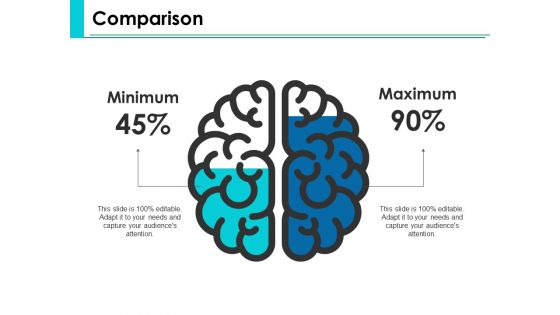
Comparison Ppt PowerPoint Presentation Outline Gallery
This is a comparison ppt powerpoint presentation outline gallery. This is a two stage process. The stages in this process are compare, percentage, finance, business, marketing.
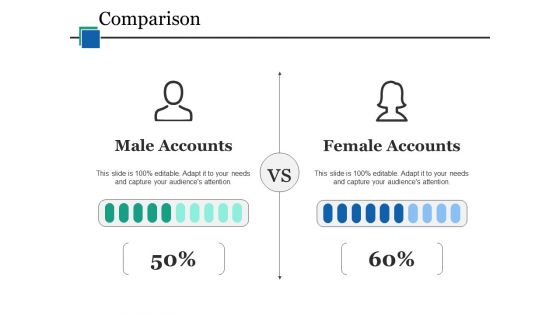
Comparison Ppt PowerPoint Presentation File Graphics Tutorials
This is a comparison ppt powerpoint presentation file graphics tutorials. This is a two stage process. The stages in this process are compare, percentage, finance, business, marketing.

Comparison Ppt PowerPoint Presentation Gallery Backgrounds
This is a comparison ppt powerpoint presentation gallery backgrounds. This is a two stage process. The stages in this process are compare, percentage, finance, business, marketing.

Comparison Ppt PowerPoint Presentation Professional Microsoft
This is a comparison ppt powerpoint presentation professional microsoft. This is a three stage process. The stages in this process are compare, percentage, finance, business, marketing.
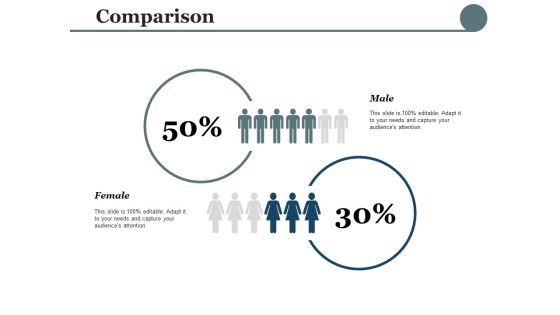
Comparison Ppt PowerPoint Presentation Show Smartart
This is a comparison ppt powerpoint presentation show smartart. This is a two stage process. The stages in this process are compare, percentage, finance, business, marketing.
Comparison Ppt PowerPoint Presentation Icon Layouts
This is a comparison ppt powerpoint presentation icon layouts. This is a two stage process. The stages in this process are compare, percentage, finance, business, marketing.
Comparison Ppt PowerPoint Presentation Icon Visuals
This is a comparison ppt powerpoint presentation icon visuals. This is a two stage process. The stages in this process are percentage, management, marketing, compare.

Comparison Ppt PowerPoint Presentation File Outline
This is a comparison ppt powerpoint presentation file outline. This is a three stage process. The stages in this process are pc users in, laptop users in, mobile users in, years, percentage.
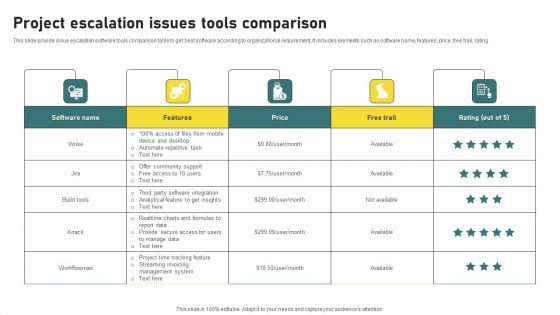
Project Escalation Issues Tools Comparison Portrait PDF
This slide provide issue escalation software tools comparison table to get best software according to organizational requirement. It includes elements such as software name, features, price, free trail, rating. Showcasing this set of slides titled Project Escalation Issues Tools Comparison Portrait PDF. The topics addressed in these templates are Automate Repetitive Task, Offer Community Support. All the content presented in this PPT design is completely editable. Download it and make adjustments in color, background, font etc. as per your unique business setting.
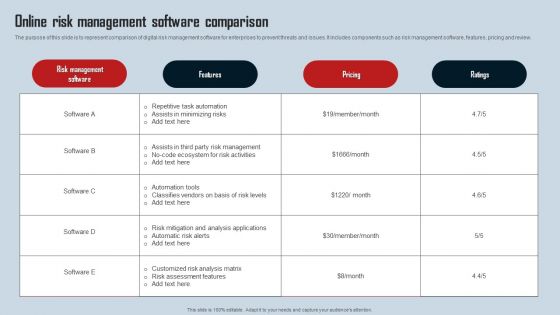
Online Risk Management Software Comparison Brochure PDF
The purpose of this slide is to represent comparison of digital risk management software for enterprises to prevent threats and issues. It includes components such as risk management software, features, pricing and review. Showcasing this set of slides titled Online Risk Management Software Comparison Brochure PDF. The topics addressed in these templates are Repetitive Task Automation, Assists In Minimizing Risks, Automation Tools. All the content presented in this PPT design is completely editable. Download it and make adjustments in color, background, font etc. as per your unique business setting.

Staff Cost Comparison Benefit Comparative Analysis Elements PDF
This slides showcases the examination of international employee cost comparison. It includes elements such as average per employee, benefits, payroll percentage and rank. Showcasing this set of slides titled Staff Cost Comparison Benefit Comparative Analysis Elements PDF. The topics addressed in these templates are Employee Cost Comparison, Employee Benefits, Average Per Employee. All the content presented in this PPT design is completely editable. Download it and make adjustments in color, background, font etc. as per your unique business setting.
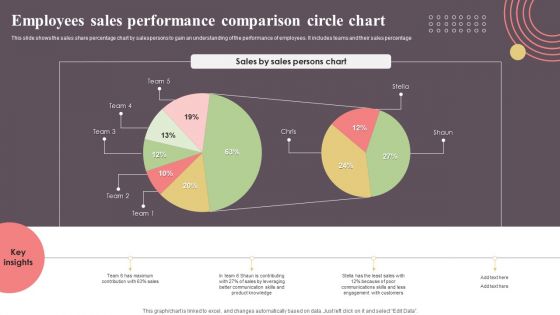
Employees Sales Performance Comparison Circle Chart Topics PDF
This slide shows the sales share percentage chart by salespersons to gain an understanding of the performance of employees. It includes teams and their sales percentage. Pitch your topic with ease and precision using this Employees Sales Performance Comparison Circle Chart Topics PDF. This layout presents information on Employees Sales Performance, Comparison Circle Chart. It is also available for immediate download and adjustment. So, changes can be made in the color, design, graphics or any other component to create a unique layout.

Dividend Payout Financial Ratios Chart Comparison Themes PDF
This slide showcases dividend payout ratio graph that can help organization to determine the percentage of the companys earnings that is paid out to shareholders by way of dividend. It showcases comparison for a period of 8 years Showcasing this set of slides titled dividend payout financial ratios chart comparison themes pdf. The topics addressed in these templates are dividend payout financial ratios chart comparison. All the content presented in this PPT design is completely editable. Download it and make adjustments in color, background, font etc. as per your unique business setting.
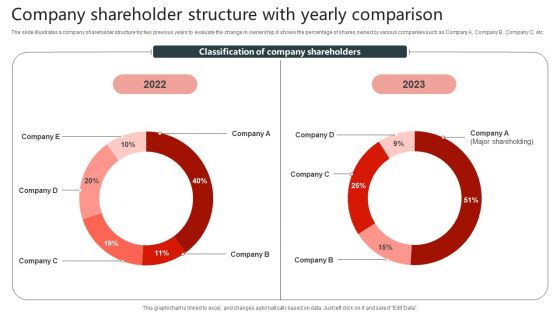
Company Shareholder Structure With Yearly Comparison Infographics PDF
The slide illustrates a company shareholder structure for two previous years to evaluate the change in ownership. It shows the percentage of shares owned by various companies such as Company A, Company B, Company C, etc. Pitch your topic with ease and precision using this Company Shareholder Structure With Yearly Comparison Infographics PDF. This layout presents information on Structure With Yearly Comparison, Company Shareholder. It is also available for immediate download and adjustment. So, changes can be made in the color, design, graphics or any other component to create a unique layout.
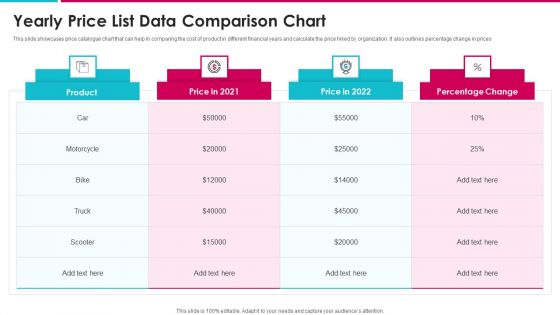
Yearly Price List Data Comparison Chart Structure PDF
This slide showcases price catalogue chart that can help in comparing the cost of product in different financial years and calculate the price hiked by organization. It also outlines percentage change in prices Showcasing this set of slides titled yearly price list data comparison chart structure pdf. The topics addressed in these templates are yearly price list data comparison chart. All the content presented in this PPT design is completely editable. Download it and make adjustments in color, background, font etc. as per your unique business setting.
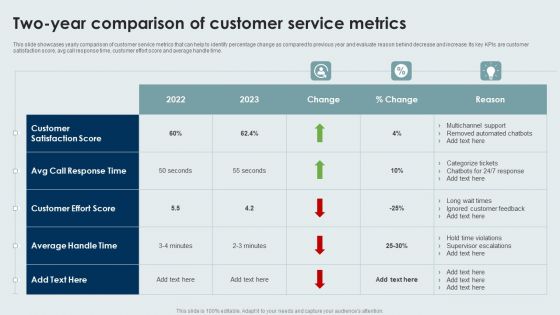
Two Year Comparison Of Customer Service Metrics Information PDF
This slide showcases yearly comparison of customer service metrics that can help to identify percentage change as compared to previous year and evaluate reason behind decrease and increase. Its key KPIs are customer satisfaction score, avg call response time, customer effort score and average handle time. Pitch your topic with ease and precision using this Two Year Comparison Of Customer Service Metrics Information PDF. This layout presents information on Customer Effort Score, Customer Satisfaction Score, Average Handle Time. It is also available for immediate download and adjustment. So, changes can be made in the color, design, graphics or any other component to create a unique layout.
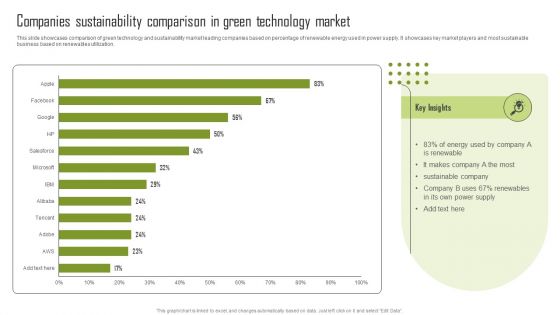
Companies Sustainability Comparison In Green Technology Market Inspiration PDF
This slide showcases comparison of green technology and sustainability market leading companies based on percentage of renewable energy used in power supply. It showcases key market players and most sustainable business based on renewables utilization. Are you in need of a template that can accommodate all of your creative concepts This one is crafted professionally and can be altered to fit any style. Use it with Google Slides or PowerPoint. Include striking photographs, symbols, depictions, and other visuals. Fill, move around, or remove text boxes as desired. Test out color palettes and font mixtures. Edit and save your work, or work with colleagues. Download Companies Sustainability Comparison In Green Technology Market Inspiration PDF and observe how to make your presentation outstanding. Give an impeccable presentation to your group and make your presentation unforgettable.

Big Data Database Comparison Ppt PowerPoint Presentation Outline
This is a big data database comparison ppt powerpoint presentation outline. This is a four stage process. The stages in this process are business, finance, management, percentage, growth.

Comparison Process Analysis Ppt PowerPoint Presentation Outline Sample
This is a comparison process analysis ppt powerpoint presentation outline sample. This is a two stage process. The stages in this process are compare, percentage, finance, business, marketing.
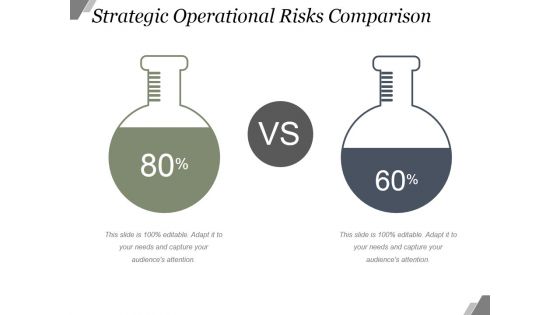
Strategic Operational Risks Comparison Ppt PowerPoint Presentation Designs
This is a strategic operational risks comparison ppt powerpoint presentation designs. This is a two stage process. The stages in this process are compare, percentage, business, marketing.
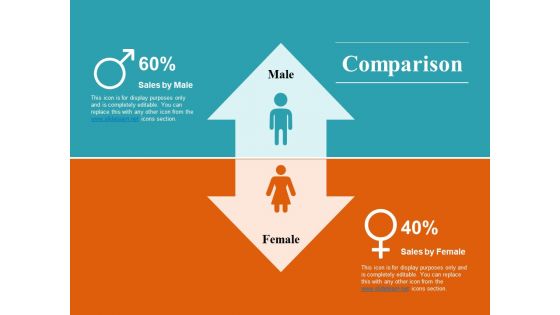
Comparison Human Resource Timeline Ppt PowerPoint Presentation Ideas Template
This is a comparison human resource timeline ppt powerpoint presentation ideas template. This is a two stage process. The stages in this process are compare, percentage, finance, business, marketing.

Male Vs Female Work Productivity Comparison Ppt PowerPoint Presentation Slides
This is a male vs female work productivity comparison ppt powerpoint presentation slides. This is a two stage process. The stages in this process are finance, business, percentage, compare, marketing.
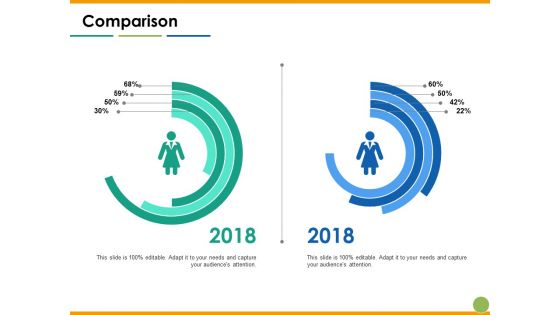
Comparison Capability Maturity Matrix Ppt PowerPoint Presentation Slides Microsoft
This is a comparison capability maturity matrix ppt powerpoint presentation slides microsoft. This is a two stage process. The stages in this process are compare, percentage, finance, business, marketing.
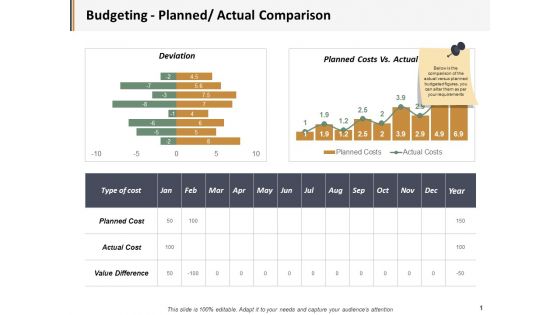
Budgeting Planned Actual Comparison Ppt PowerPoint Presentation Visual Aids Gallery
This is a budgeting planned actual comparison ppt powerpoint presentation visual aids gallery. This is a three stage process. The stages in this process are business, management, marketing, percentage, product.
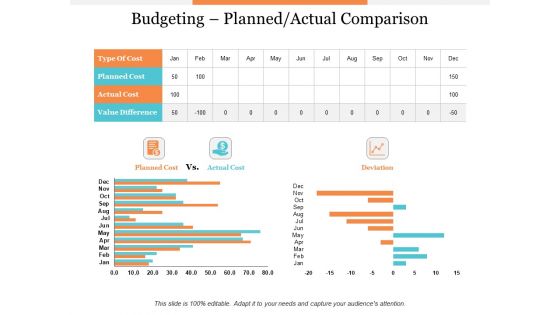
Budgeting Planned Actual Comparison Ppt PowerPoint Presentation Styles File Formats
This is a budgeting planned actual comparison ppt powerpoint presentation styles file formats. This is a three stage process. The stages in this process are product, percentage, business, management, marketing.
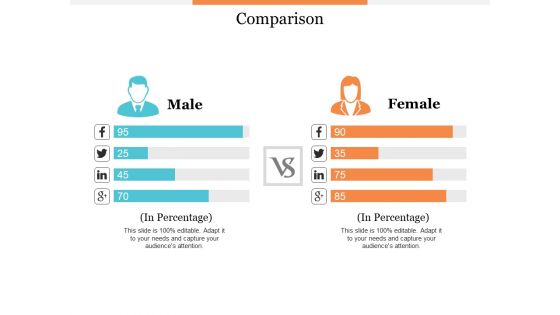
Comparison Male And Female Ppt PowerPoint Presentation Professional Skills
This is a comparison male and female ppt powerpoint presentation professional skills. This is a two stage process. The stages in this process are product, percentage, business, management, marketing.
Budgeting Planned Actual Comparison Ppt PowerPoint Presentation Icon Shapes
This is a budgeting planned actual comparison ppt powerpoint presentation icon shapes. This is a two stage process. The stages in this process are finance, marketing, management, investment, product, percentage.

6 Months Company Revenue Comparison Dashboard Graphics PDF
This slide showcases the half yearly profit comparison dashboard. It also includes comparison kp is such as monthly profit, profit margin growth, branch profit percentage, top 3 profitable products, etc. Showcasing this set of slides titled 6 Months Company Revenue Comparison Dashboard Graphics PDF. The topics addressed in these templates are Growth Rate, Overall Profit Margin, Branch Profit. All the content presented in this PPT design is completely editable. Download it and make adjustments in color, background, font etc. as per your unique business setting.
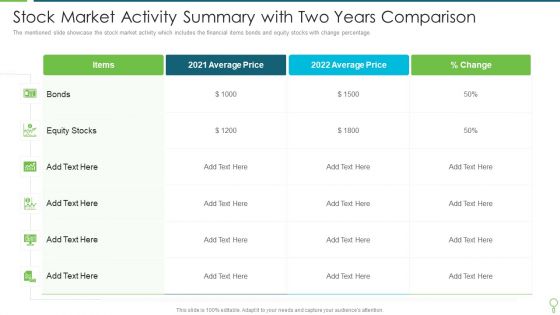
Stock Market Activity Summary With Two Years Comparison Infographics PDF
The mentioned slide showcase the stock market activity which includes the financial items bonds and equity stocks with change percentage. Pitch your topic with ease and precision using this Stock Market Activity Summary With Two Years Comparison Infographics PDF. This layout presents information on Average, Price, Equity Stocks. It is also available for immediate download and adjustment. So, changes can be made in the color, design, graphics or any other component to create a unique layout.

Cloud Computing Business Cost Comparison Table Microsoft PDF
This slide covers comparison table for different cost based cloud services. It includes elements such as cloud services, on demand rates, discount percentages, compute saving plan rates based on hourly rates and cost per day. Showcasing this set of slides titled Cloud Computing Business Cost Comparison Table Microsoft PDF. The topics addressed in these templates are On Demand Rates, Cloud Services, Cost. All the content presented in this PPT design is completely editable. Download it and make adjustments in color, background, font etc. as per your unique business setting.
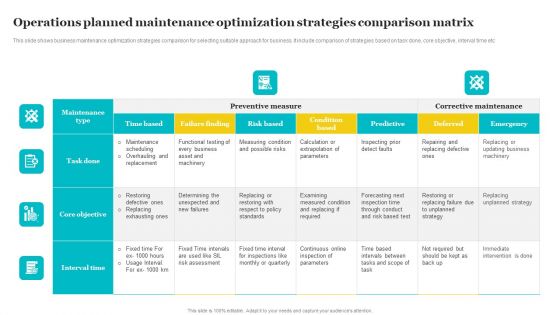
Operations Planned Maintenance Optimization Strategies Comparison Matrix Introduction PDF
This slide shows business maintenance optimization strategies comparison for selecting suitable approach for business. It include comparison of strategies based on task done, core objective, interval time etc. Showcasing this set of slides titled Operations Planned Maintenance Optimization Strategies Comparison Matrix Introduction PDF. The topics addressed in these templates are Preventive Measure, Corrective Maintenance, Interval Time. All the content presented in this PPT design is completely editable. Download it and make adjustments in color, background, font etc. as per your unique business setting.

Comparison Of Task Management And Time Monitoring Software Professional PDF
This slide shows a comparison table of task management and time tracking software which includes features such as time tracker, number of users, number of task or projects, upgrade cost, task dependencies, task level security, etc. Showcasing this set of slides titled comparison of task management and time monitoring software professional pdf. The topics addressed in these templates are upgrade cost, projects, security. All the content presented in this PPT design is completely editable. Download it and make adjustments in color, background, font etc. as per your unique business setting.

CRM Different Software Product Comparison Chart Portrait PDF
This slide indicates product comparison of two different software. It includes variables like free trial, contact management, deal management, task management, social integration, email integration, analytics and dashboards, etc. Presenting CRM Different Software Product Comparison Chart Portrait PDF to dispense important information. This template comprises three stages. It also presents valuable insights into the topics including Deal Management, Task Management, Advertising Management. This is a completely customizable PowerPoint theme that can be put to use immediately. So, download it and address the topic impactfully.

Company Annual Report Table With Percentages Ppt PowerPoint Presentation Slides
This is a company annual report table with percentages ppt powerpoint presentation slides. This is ten stage process. The stages in this process are send date time, email name, recipients, delivered, spam, opt out, open, transactions, revenue.

Company Budget Figures With Margin Percentages Ppt PowerPoint Presentation Templates
This is a company budget figures with margin percentages ppt powerpoint presentation templates. This is six stage process. The stages in this process are campaign, daily budget, max pub cost, max of budget, number of days at or above budget, margin.

Digital Marketing Media Goals With Percentages Portrait PDF
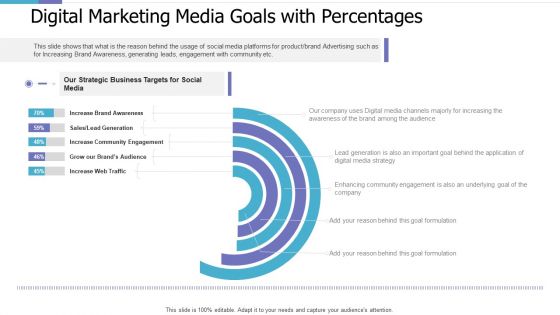
This slide shows that what is the reason behind the usage of social media platforms for product brand Advertising such as for Increasing Brand Awareness, generating leads, engagement with community etc. This is a digital marketing media goals with percentages portrait pdf template with various stages. Focus and dispense information on four stages using this creative set, that comes with editable features. It contains large content boxes to add your information on topics like increase brand awareness, sales lead generation, increase community engagement, grow our brands audience, increase web traffic. You can also showcase facts, figures, and other relevant content using this PPT layout. Grab it now.
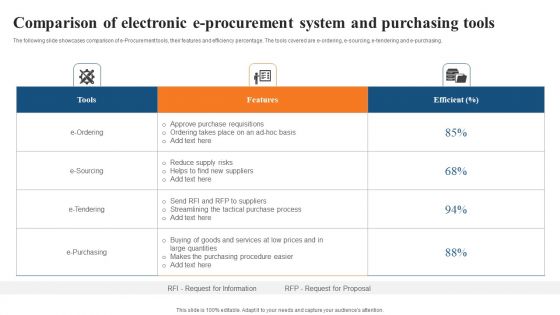
Comparison Of Electronic E Procurement System And Purchasing Tools Brochure PDF

Social Media Event Marketing Business Return On Investment Comparison Microsoft Pdf
The slide displays a comparison chart that helps event managers organisers understand and evaluate event success by comparing the percentage of return on investment per social media platform campaign. The elements are comparative analysis chart, along with its key findings. Showcasing this set of slides titled Social Media Event Marketing Business Return On Investment Comparison Microsoft Pdf The topics addressed in these templates are Social Media Event, Marketing Business, Investment Comparison All the content presented in this PPT design is completely editable. Download it and make adjustments in color, background, font etc. as per your unique business setting.
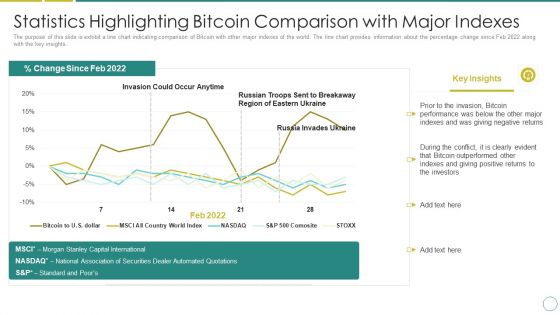
Russia Ukraine Statistics Highlighting Bitcoin Comparison With Major Indexes Mockup PDF
The purpose of this slide is exhibit a line chart indicating comparison of Bitcoin with other major indexes of the world. The line chart provides information about the percentage change since Feb 2022 along with the key insights. Deliver an awe inspiring pitch with this creative russia ukraine statistics highlighting bitcoin comparison with major indexes mockup pdf bundle. Topics like invasion could occur anytime, russia invades ukraine, bitcoin performance can be discussed with this completely editable template. It is available for immediate download depending on the needs and requirements of the user.

Five Year Comparison Of Registered Mobile Money Customers Spread By Region Graphics PDF
This slide shows the information statistics about region wise registered mobile money customers spread during last 5 years. It indicates that customers spread in South Asia recorded highest that is 28.4 percentage over the last five years. Deliver an awe inspiring pitch with this creative Five Year Comparison Of Registered Mobile Money Customers Spread By Region Graphics PDF bundle. Topics like Five Year Comparison Of Registered Mobile Money Customers Spread By Region can be discussed with this completely editable template. It is available for immediate download depending on the needs and requirements of the user.

Comparison Of Traditional Digital And Mobile Comprehensive Smartphone Banking Microsoft Pdf
This slide shows data related to different types of banking users with different age groups. It includes percentage of population uses traditional, digital and mobile banking services. Do you have an important presentation coming up Are you looking for something that will make your presentation stand out from the rest Look no further than Comparison Of Traditional Digital And Mobile Comprehensive Smartphone Banking Microsoft Pdf. With our professional designs, you can trust that your presentation will pop and make delivering it a smooth process. And with Slidegeeks, you can trust that your presentation will be unique and memorable. So why wait Grab Comparison Of Traditional Digital And Mobile Comprehensive Smartphone Banking Microsoft Pdf today and make your presentation stand out from the rest.
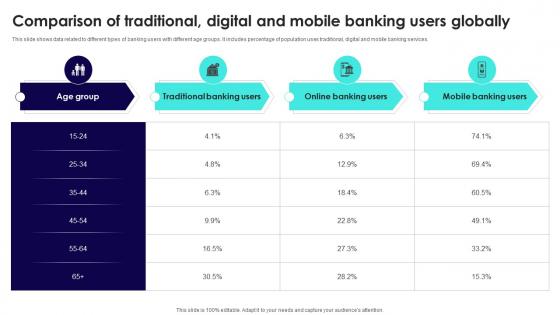
Wireless Banking To Improve Comparison Of Traditional Digital And Mobile Fin SS V
This slide shows data related to different types of banking users with different age groups. It includes percentage of population uses traditional, digital and mobile banking services. Are you in need of a template that can accommodate all of your creative concepts This one is crafted professionally and can be altered to fit any style. Use it with Google Slides or PowerPoint. Include striking photographs, symbols, depictions, and other visuals. Fill, move around, or remove text boxes as desired. Test out color palettes and font mixtures. Edit and save your work, or work with colleagues. Download Wireless Banking To Improve Comparison Of Traditional Digital And Mobile Fin SS V and observe how to make your presentation outstanding. Give an impeccable presentation to your group and make your presentation unforgettable.
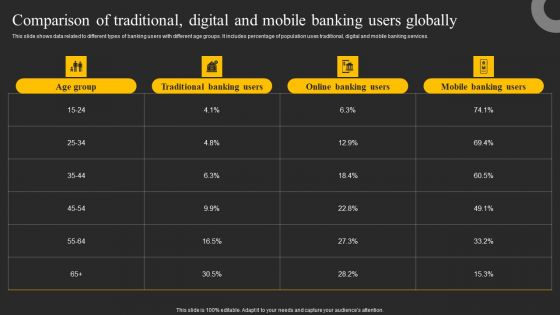
Comparison Of Traditional Digital And Mobile Banking Users Globally Ppt Topics PDF
This slide shows data related to different types of banking users with different age groups. It includes percentage of population uses traditional, digital and mobile banking services. Formulating a presentation can take up a lot of effort and time, so the content and message should always be the primary focus. The visuals of the PowerPoint can enhance the presenters message, so our Comparison Of Traditional Digital And Mobile Banking Users Globally Ppt Topics PDF was created to help save time. Instead of worrying about the design, the presenter can concentrate on the message while our designers work on creating the ideal templates for whatever situation is needed. Slidegeeks has experts for everything from amazing designs to valuable content, we have put everything into Comparison Of Traditional Digital And Mobile Banking Users Globally Ppt Topics PDF.
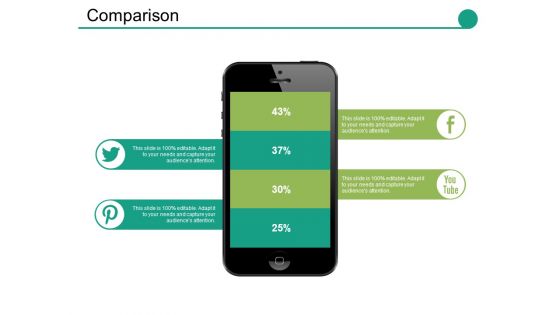
Comparison Ppt PowerPoint Presentation Show Slide Download Ppt PowerPoint Presentation Professional Smartart
This is a comparison ppt powerpoint presentation show slide download ppt powerpoint presentation professional smartart. This is a four stage process. The stages in this process are compare, percentage, finance, business, marketing.
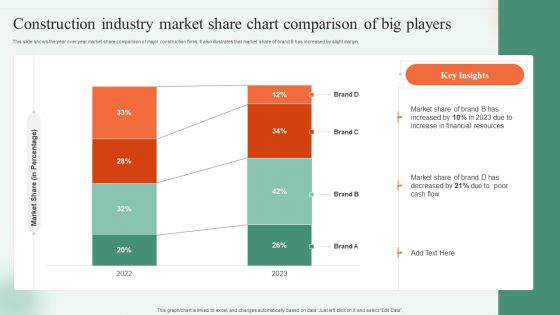
Construction Industry Market Share Chart Comparison Of Big Players Ppt Portfolio Shapes PDF
This slide shows the year over year market share comparison of major construction firms. It also illustrates that market share of brand B has increased by slight margin. Pitch your topic with ease and precision using this Construction Industry Market Share Chart Comparison Of Big Players Ppt Portfolio Shapes PDF. This layout presents information on Market Share Percentage, 2022 To 2023, Market Share. It is also available for immediate download and adjustment. So, changes can be made in the color, design, graphics or any other component to create a unique layout.
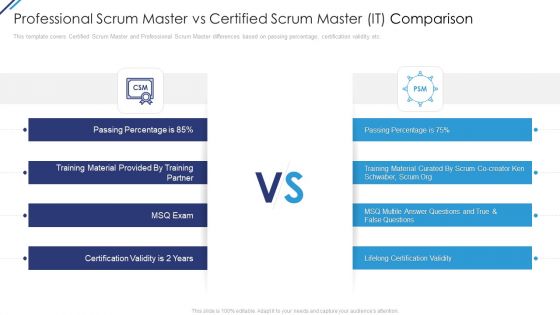
Professional Scrum Master Vs Certified Scrum Master IT Comparison Ppt Gallery Slide Download PDF
This template covers Certified Scrum Master and Professional Scrum Master differences based on passing percentage, certification validity etc. Presenting professional scrum master vs certified scrum master it comparison ppt gallery slide download pdf to provide visual cues and insights. Share and navigate important information on two stages that need your due attention. This template can be used to pitch topics like professional scrum master vs certified scrum master it comparison. In addtion, this PPT design contains high resolution images, graphics, etc, that are easily editable and available for immediate download.

9 Stages Hub And Spoke Comparison Diagram How Business Plan PowerPoint Templates
We present our 9 stages hub and spoke comparison diagram how business plan PowerPoint templates.Use our Process and Flows PowerPoint Templates because Our PowerPoint Templates and Slides will let Your superior ideas hit the target always and everytime. Download our Arrows PowerPoint Templates because Our PowerPoint Templates and Slides are a sure bet. Gauranteed to win against all odds. Download our Business PowerPoint Templates because Our PowerPoint Templates and Slides have the Brilliant backdrops. Guaranteed to illuminate the minds of your audience. Use our Circle Charts PowerPoint Templates because Our PowerPoint Templates and Slides will let you meet your Deadlines. Download our Flow Charts PowerPoint Templates because Our PowerPoint Templates and Slides will effectively help you save your valuable time. They are readymade to fit into any presentation structure. Use these PowerPoint slides for presentations relating to Pie, chart, graph, market, isolated, statistics, sales, economy, display, white, corporate, business, income, concept, arrow, success, presentation, nine,diagram, percentage, graphic, finance, data, report, marketing, accounting, management, result, piece, strategy, growth, company, competition, progress, account,profit, part, information, investment, improvement, index, financial, reflect, performance. The prominent colors used in the PowerPoint template are Black, Green, Blue.

Chart Data Comparison 7 Stages Examples Of Business Plans For PowerPoint Slides
We present our chart data comparison 7 stages examples of business plans for PowerPoint Slides.Download and present our Circle Charts PowerPoint Templates because You are well armed with penetrative ideas. Our PowerPoint Templates and Slides will provide the gunpowder you need. Use our Business PowerPoint Templates because It can be used to Set your controls for the heart of the sun. Our PowerPoint Templates and Slides will be the propellant to get you there. Present our Shapes PowerPoint Templates because You will get more than you ever bargained for. Download and present our Signs PowerPoint Templates because Our PowerPoint Templates and Slides are truly out of this world. Even the MIB duo has been keeping tabs on our team. Present our Metaphors-Visual Concepts PowerPoint Templates because Our PowerPoint Templates and Slides will bullet point your ideas. See them fall into place one by one.Use these PowerPoint slides for presentations relating to business, chart, circle, circular, diagram, economy, finance, framework, graph, isolated, percentage, pie chart, results, scheme, statistics, stats, strategy, success. The prominent colors used in the PowerPoint template are Red, Pink, Green.
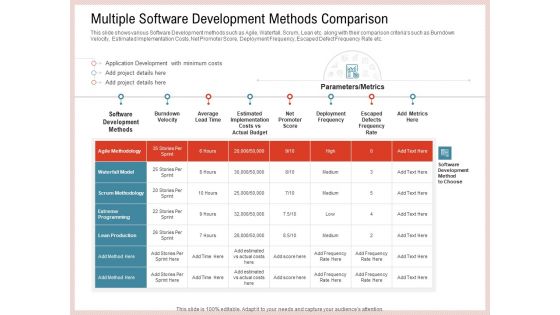
Agile Model Improve Task Team Performance Multiple Software Development Methods Comparison Elements PDF
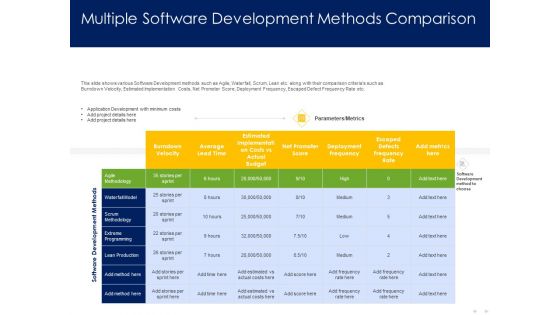
This slide shows various Software Development methods such as Agile, Waterfall, Scrum, Lean etc. along with their comparison criterias such as Burndown Velocity, Estimated Implementation Costs, Net Promoter Score, Deployment Frequency, Escaped Defect Frequency Rate etc. Deliver an awe inspiring pitch with this creative aagile model improve task team performance multiple software development methods comparison elements pdf bundle. Topics like development, implementation, costs, metrics, deployment can be discussed with this completely editable template. It is available for immediate download depending on the needs and requirements of the user.
Optimizing Tasks Team Collaboration Agile Operations Multiple Software Development Methods Comparison Download PDF
Presenting this set of slides with name optimizing tasks team collaboration agile operations multiple software development methods comparison download pdf. The topics discussed in these slides are waterfall model, scrum methodology, extreme programming, lean production. This is a completely editable PowerPoint presentation and is available for immediate download. Download now and impress your audience.

Evaluation Chart For Various System Tool Comparison Ppt PowerPoint Presentation Layouts Images PDF
Showcasing this set of slides titled evaluation chart for various system tool comparison ppt powerpoint presentation layouts images pdf. The topics addressed in these templates are project definition, resource definition, work management, task scheduling, expense recording. All the content presented in this PPT design is completely editable. Download it and make adjustments in color, background, font etc. as per your unique business setting.

Shareholder Structure Of The Company With Percentages Ppt Pictures Slide Portrait PDF
This slide shows companys Shareholder structure with shareholder names and their respective percentages. This Shareholder Structure Of The Company With Percentages Ppt Pictures Slide Portrait PDF is perfect for any presentation, be it in front of clients or colleagues. It is a versatile and stylish solution for organizing your meetings. The product features a modern design for your presentation meetings. The adjustable and customizable slides provide unlimited possibilities for acing up your presentation. Slidegeeks has done all the homework before launching the product for you. So, do not wait, grab the presentation templates today
Digital Marketing Media Goals With Percentages Investor Pitch Deck For PE Funding Ideas PDF
This slide shows that what is the reason behind the usage of social media platforms for product brand Advertising such as for Increasing Brand Awareness, generating leads, engagement with community etc. This is a digital marketing media goals with percentages investor pitch deck for pe funding ideas pdf template with various stages. Focus and dispense information on five stages using this creative set, that comes with editable features. It contains large content boxes to add your information on topics like lead generation, community engagement, web traffic. You can also showcase facts, figures, and other relevant content using this PPT layout. Grab it now.

United States Of America Map Locations Percentages Ppt PowerPoint Presentation Complete Deck With Slides
Boost your confidence and team morale with this well-structured united states of america map locations percentages ppt powerpoint presentation complete deck with slides. This prefabricated set gives a voice to your presentation because of its well-researched content and graphics. Our experts have added all the components very carefully, thus helping you deliver great presentations with a single click. Not only that, it contains a set of twelve slides that are designed using the right visuals, graphics, etc. Various topics can be discussed, and effective brainstorming sessions can be conducted using the wide variety of slides added in this complete deck. Apart from this, our PPT design contains clear instructions to help you restructure your presentations and create multiple variations. The color, format, design anything can be modified as deemed fit by the user. Not only this, it is available for immediate download. So, grab it now.

Users Comparisons For Communication Devices Powerpoint Slides
This PowerPoint slide is definitely one of our most downloaded templates. This modern slide has been creatively made to depict technology in various forms. This would be best suited to differentiate between users on the basis of their devices, screen size preferences, operating system preferences. This slide can also be used to present the availability of an app or website on multiple operating systems such as android, Ios, Windows etc. and for different screen sizes. The slide has been designed in a manner to depict percentage or ratio of users without the need of any assistance from the presenter. The slide can also be used to demonstrate communication, networking and the use of gadgets.

 Home
Home