Percentage Charts
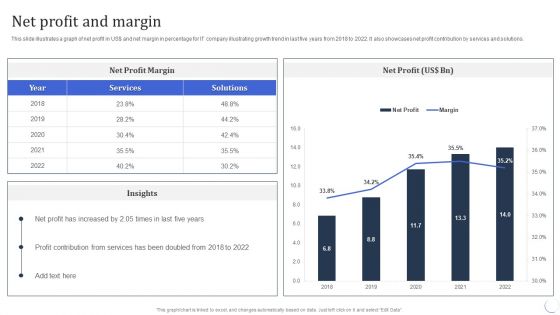
Infotech Solutions Research And Development Company Summary Net Profit And Margin Information PDF
This slide illustrates a graph of net profit in US dollar and net margin in percentage for IT company illustrating growth trend in last five years from 2018 to 2022. It also showcases net profit contribution by services and solutions. Deliver and pitch your topic in the best possible manner with this Infotech Solutions Research And Development Company Summary Net Profit And Margin Information PDF. Use them to share invaluable insights on Profit Contribution, Services, Net Profit and impress your audience. This template can be altered and modified as per your expectations. So, grab it now.
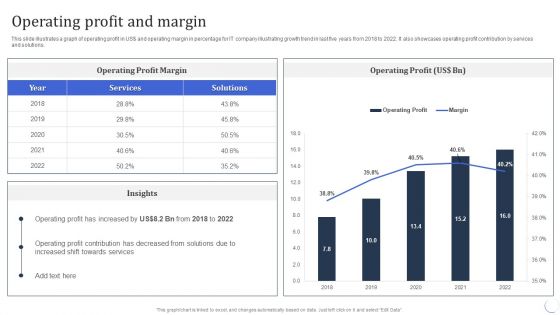
Infotech Solutions Research And Development Company Summary Operating Profit And Margin Download PDF
This slide illustrates a graph of operating profit in US dollar and operating margin in percentage for IT company illustrating growth trend in last five years from 2018 to 2022. It also showcases operating profit contribution by services and solutions. Deliver an awe inspiring pitch with this creative Infotech Solutions Research And Development Company Summary Operating Profit And Margin Download PDF bundle. Topics like Services, Operating Profit can be discussed with this completely editable template. It is available for immediate download depending on the needs and requirements of the user.
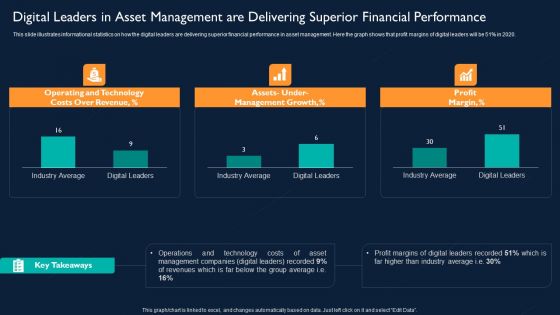
Digital Leaders In Asset Management Are Delivering Superior Financial Performance Designs PDF
This slide illustrates informational statistics on how the digital leaders are delivering superior financial performance in asset management. Here the graph shows that profit margins of digital leaders will be 51 percentage in 2020. Deliver and pitch your topic in the best possible manner with this Digital Leaders In Asset Management Are Delivering Superior Financial Performance Designs PDF. Use them to share invaluable insights on Operating And Technology Costs, Management Growth, Profit Margin and impress your audience. This template can be altered and modified as per your expectations. So, grab it now.
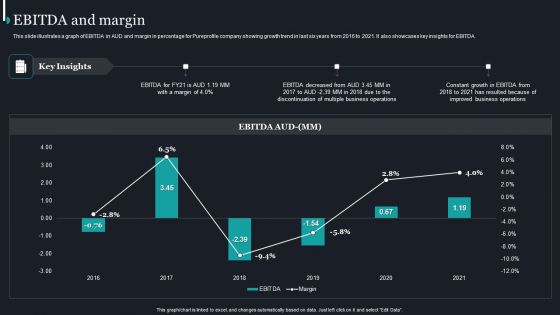
Pureprofile Business Overview EBITDA And Margin Ppt Gallery Sample PDF
This slide illustrates a graph of EBITDA in AUD and margin in percentage for Pureprofile company showing growth trend in last six years from 2016 to 2021. It also showcases key insights for EBITDA. Deliver and pitch your topic in the best possible manner with this Pureprofile Business Overview EBITDA And Margin Ppt Gallery Sample PDF. Use them to share invaluable insights on EBITDA Decreased, Business Operations, 2016 To 2021 and impress your audience. This template can be altered and modified as per your expectations. So, grab it now.

IT Application Services Company Outline Gross Profit And Margin Elements PDF
This slide illustrates a graph of gross profit in US dollar and gross margin in percentage for IT company illustrating growth trend in last five years from 2018 to 2022. It also showcases gross profit contribution by services and solutions. Deliver an awe inspiring pitch with this creative IT Application Services Company Outline Gross Profit And Margin Elements PDF bundle. Topics like Gross Profit Margin, Services can be discussed with this completely editable template. It is available for immediate download depending on the needs and requirements of the user.
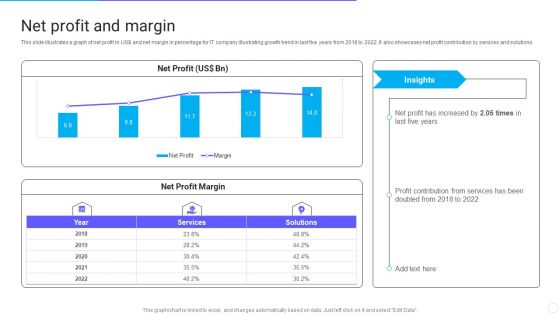
IT Application Services Company Outline Net Profit And Margin Structure PDF
This slide illustrates a graph of net profit in US dollar and net margin in percentage for IT company illustrating growth trend in last five years from 2018 to 2022. It also showcases net profit contribution by services and solutions. Deliver and pitch your topic in the best possible manner with this IT Application Services Company Outline Net Profit And Margin Structure PDF. Use them to share invaluable insights on Net Profit Margin, Services, Margin and impress your audience. This template can be altered and modified as per your expectations. So, grab it now.

IT Application Services Company Outline Operating Profit And Margin Structure PDF
This slide illustrates a graph of operating profit in US dollar and operating margin in percentage for IT company illustrating growth trend in last five years from 2018 to 2022. It also showcases operating profit contribution by services and solutions. Deliver an awe inspiring pitch with this creative IT Application Services Company Outline Operating Profit And Margin Structure PDF bundle. Topics like Operating Profit And Margin can be discussed with this completely editable template. It is available for immediate download depending on the needs and requirements of the user.

Gross Profit And Margin IT Software Development Company Profile Slides PDF
This slide illustrates a graph of gross profit in US doller and gross margin in percentage for IT company illustrating growth trend in last five years from 2018 to 2022. It also showcases gross profit contribution by services and solutions. Deliver and pitch your topic in the best possible manner with this Gross Profit And Margin IT Software Development Company Profile Slides PDF. Use them to share invaluable insights on Gross Profit, Margin and impress your audience. This template can be altered and modified as per your expectations. So, grab it now.

Operating Profit And Margin IT Software Development Company Profile Guidelines PDF
This slide illustrates a graph of operating profit in US doller and operating margin in percentage for IT company illustrating growth trend in last five years from 2018 to 2022. It also showcases operating profit contribution by services and solutions. Deliver and pitch your topic in the best possible manner with this Operating Profit And Margin IT Software Development Company Profile Guidelines PDF. Use them to share invaluable insights on Operating Profit, Operating Profit Margin and impress your audience. This template can be altered and modified as per your expectations. So, grab it now.
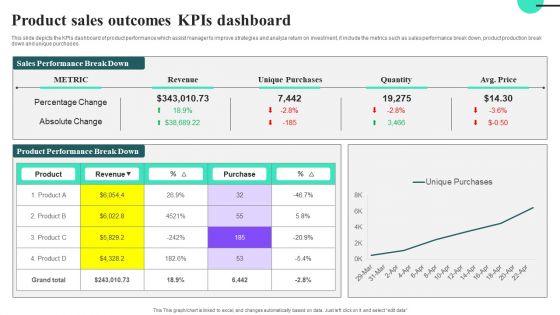
Product Sales Outcomes Kpis Dashboard Ideas PDF
This slide depicts the KPIs dashboard of product performance which assist manager to improve strategies and analyze return on investment, it include the metrics such as sales performance break down, product production break down and unique purchases.Showcasing this set of slides titled Product Sales Outcomes Kpis Dashboard Ideas PDF. The topics addressed in these templates are Percentage Change, Absolute Change. All the content presented in this PPT design is completely editable. Download it and make adjustments in color, background, font etc. as per your unique business setting.

Six Sigma Methodologies For Process Optimization Low Productivity Faced By The Business Sample PDF
This slide demonstrates the issue of low productivity faced by the business, which has been declining since 2018 continuously and has been less than 1 percentage each year. Showcasing this set of slides titled Six Sigma Methodologies For Process Optimization Low Productivity Faced By The Business Sample PDF. The topics addressed in these templates are Annual Productivity Growth, Low Productivity Faced. All the content presented in this PPT design is completely editable. Download it and make adjustments in color, background, font etc. as per your unique business setting.
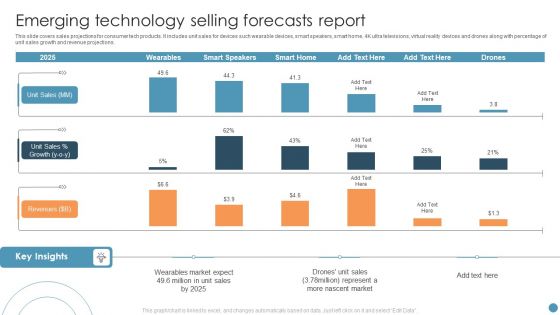
Emerging Technology Selling Forecasts Report Clipart PDF
This slide covers sales projections for consumer tech products. It includes unit sales for devices such wearable devices, smart speakers, smart home, 4K ultra televisions, virtual reality devices and drones along with percentage of unit sales growth and revenue projections. Showcasing this set of slides titled Emerging Technology Selling Forecasts Report Clipart PDF. The topics addressed in these templates are Emerging Technology Selling Forecasts, Market. All the content presented in this PPT design is completely editable. Download it and make adjustments in color, background, font etc. as per your unique business setting.
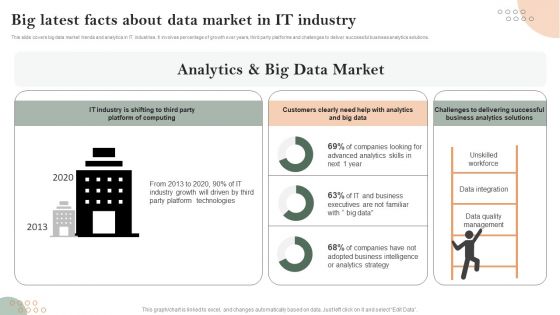
Big Latest Facts About Data Market In IT Industry Pictures PDF
This slide covers big data market trends and analytics in IT industries. It involves percentage of growth over years, third party platforms and challenges to deliver successful business analytics solutions. Showcasing this set of slides titled Big Latest Facts About Data Market In IT Industry Pictures PDF. The topics addressed in these templates are Unskilled Workforce, Data Integration, Data Quality Management. All the content presented in this PPT design is completely editable. Download it and make adjustments in color, background, font etc. as per your unique business setting.

Drone Service Company Investor Funding Elevator Pitch Deck Financial Projections Structure PDF
The slide outlines the financial projections of the company containing estimated revenue growth and expected percentage of decline in business expenditures. This modern and well arranged Drone Service Company Investor Funding Elevator Pitch Deck Financial Projections Structure PDF provides lots of creative possibilities. It is very simple to customize and edit with the Powerpoint Software. Just drag and drop your pictures into the shapes. All facets of this template can be edited with Powerpoint no extra software is necessary. Add your own material, put your images in the places assigned for them, adjust the colors, and then you can show your slides to the world, with an animated slide included.
Skill Development Training To Strengthen Employee Performance Employee Efficiency Graph For The Five Years Icons PDF
This slide shows the five- year graph of average production per employee in tonne and employee efficiency in percentage along with the key insights. Deliver and pitch your topic in the best possible manner with this skill development training to strengthen employee performance employee efficiency graph for the five years icons pdf. Use them to share invaluable insights on employee efficiency graph for the five years and impress your audience. This template can be altered and modified as per your expectations. So, grab it now.
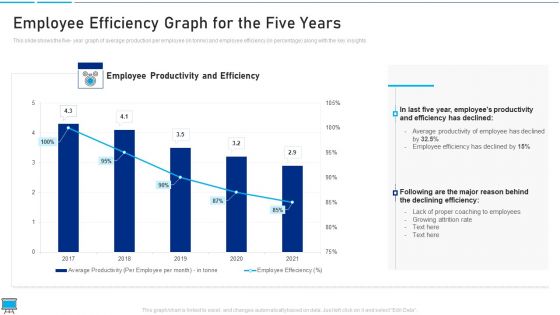
Performance Training Action Plan And Extensive Strategies Employee Efficiency Graph For The Five Years Guidelines PDF
This slide shows the five year graph of average production per employee in tonne and employee efficiency in percentage along with the key insights Deliver and pitch your topic in the best possible manner with this performance training action plan and extensive strategies employee efficiency graph for the five years guidelines pdf Use them to share invaluable insights on declining efficiency, proper coaching to employees, employee efficiency and impress your audience. This template can be altered and modified as per your expectations. So, grab it now.
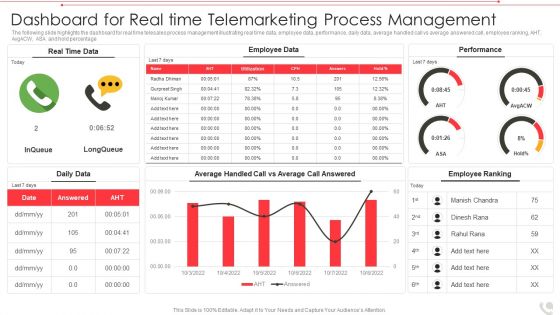
Dashboard For Real Time Telemarketing Process Management Themes PDF
The following slide highlights the dashboard for real time telesales process management illustrating real time data, employee data, performance, daily data, average handled call vs average answered call, employee ranking, AHT, AvgACW, ASA and hold percentage Showcasing this set of slides titled dashboard for real time telemarketing process management themes pdf The topics addressed in these templates are dashboard for real time telemarketing process management All the content presented in this PPT design is completely editable. Download it and make adjustments in color, background, font etc. as per your unique business setting.
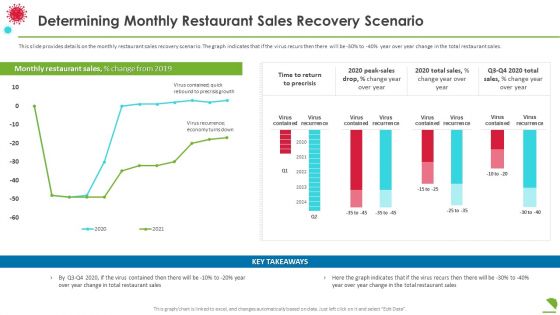
Determining Monthly Restaurant Sales Recovery Scenario Professional PDF
This slide provides details on the monthly restaurant sales recovery scenario. The graph indicates that if the virus recurs then there will be 30percentage to 40 percentage year over year change in the total restaurant sales. Deliver an awe inspiring pitch with this creative determining monthly restaurant sales recovery scenario professional pdf bundle. Topics like determining monthly restaurant sales recovery scenario can be discussed with this completely editable template. It is available for immediate download depending on the needs and requirements of the user.
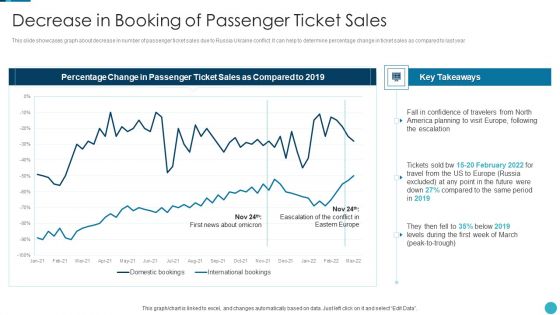
Russia Ukraine War Influence On Airline Sector Decrease In Booking Of Passenger Ticket Sales Topics PDF
This slide showcases graph about decrease in number of passenger ticket sales due to Russia Ukraine conflict. It can help to determine percentage change in ticket sales as compared to last year Deliver and pitch your topic in the best possible manner with this russia ukraine war influence on airline sector decrease in booking of passenger ticket sales topics pdf Use them to share invaluable insights on decrease in booking of passenger ticket sales and impress your audience. This template can be altered and modified as per your expectations. So, grab it now.

Real Estate Construction And Engineering Company Profile Operating Profit And Margin Designs PDF
This slide illustrates a graph of operating profit in US and gross margin in percentage for engineering company illustrating key insights and changes in last five years from 2018 to 2022.Deliver and pitch your topic in the best possible manner with this Real Estate Construction And Engineering Company Profile Operating Profit And Margin Designs PDF. Use them to share invaluable insights on Operating Profit, Insights, Material Prices and impress your audience. This template can be altered and modified as per your expectations. So, grab it now.
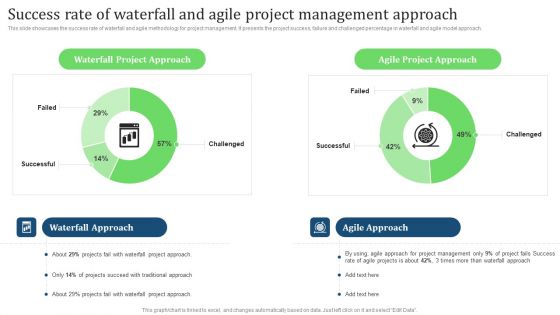
Success Rate Of Waterfall And Agile Project Management Approach Infographics PDF
This slide showcases the success rate of waterfall and agile methodology for project management. It presents the project success, failure and challenged percentage in waterfall and agile model approach. If your project calls for a presentation, then Slidegeeks is your go-to partner because we have professionally designed, easy-to-edit templates that are perfect for any presentation. After downloading, you can easily edit Success Rate Of Waterfall And Agile Project Management Approach Infographics PDF and make the changes accordingly. You can rearrange slides or fill them with different images. Check out all the handy templates
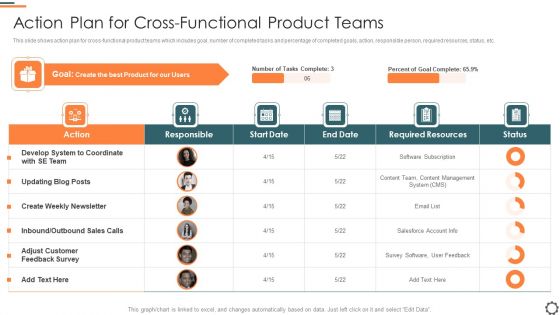
Agile Group For Product Development Action Plan For Cross Functional Product Teams Ideas PDF
This slide shows action plan for cross functional product teams which includes goal, number of completed tasks and percentage of completed goals, action, responsible person, required resources, status, etc. Deliver an awe inspiring pitch with this creative agile group for product development action plan for cross functional product teams ideas pdf bundle. Topics like salesforce account info, software subscription, survey software can be discussed with this completely editable template. It is available for immediate download depending on the needs and requirements of the user.
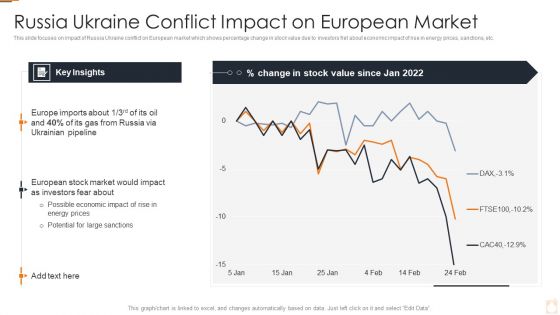
Ukraine Russia Conflict Effect On Petroleum Industry Russia Ukraine Conflict Impact Topics PDF
This slide focuses on impact of Russia Ukraine conflict on European market which shows percentage change in stock value due to investors fret about economic impact of rise in energy prices, sanctions, etc.Deliver an awe inspiring pitch with this creative Ukraine Russia Conflict Effect On Petroleum Industry Russia Ukraine Conflict Impact Topics PDF bundle. Topics like Russia Ukraine Conflict Impact On European Market can be discussed with this completely editable template. It is available for immediate download depending on the needs and requirements of the user.

Analyzing Top Reasons For Product Portfolio Failure Designs PDF
This slide displays various reasons that may contribute to product portfolio failure in new region. Most contributing factor is unclear or continuously changing product definitions which contribute 42 percentage to product failure. Deliver and pitch your topic in the best possible manner with this Analyzing Top Reasons For Product Portfolio Failure Designs PDF. Use them to share invaluable insights on Product Portfolio, Analyzing Top Reasons and impress your audience. This template can be altered and modified as per your expectations. So, grab it now.
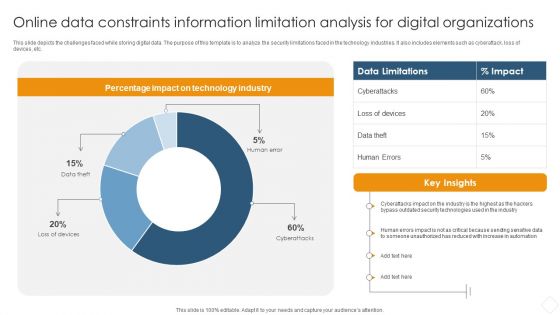
Online Data Constraints Information Limitation Analysis For Digital Organizations Information PDF
This slide depicts the challenges faced while storing digital data. The purpose of this template is to analyze the security limitations faced in the technology industries. It also includes elements such as cyberattack, loss of devices, etc.Pitch your topic with ease and precision using this Online Data Constraints Information Limitation Analysis For Digital Organizations Information PDF. This layout presents information on Percentage Impact, Technology Industry, Security Technologies. It is also available for immediate download and adjustment. So, changes can be made in the color, design, graphics or any other component to create a unique layout.

Saas Company KPI Dashboard With Assigned Subscriptions Formats PDF
The purpose of this slide is to showcase SaaS key performance indicator KPI metrics dashboard. Information covered in this template is related to current subscription spend, percent of stale subscription, etc. Pitch your topic with ease and precision using this Saas Company KPI Dashboard With Assigned Subscriptions Formats PDF. This layout presents information on Current Subscription Spend, Percentage Of Stale Subscriptions, True Up Cost, Underperforming Subscription Spend. It is also available for immediate download and adjustment. So, changes can be made in the color, design, graphics or any other component to create a unique layout.

Net Promoter Score Trends With Promoters Passives Detractors Background PDF
This slide presents NPS trend over time with percentage change in promoters, passives and detractors over four consecutive years. It includes total net promoter score for each year that highlights customer loyalty and benchmarks satisfaction level Showcasing this set of slides titled Net Promoter Score Trends With Promoters Passives Detractors Background PDF. The topics addressed in these templates are Trend, Detractors, Net. All the content presented in this PPT design is completely editable. Download it and make adjustments in color, background, font etc. as per your unique business setting.

Assuring Management In Product Innovation To Enhance Processes Action Plan For Cross Functional Product Teams Formats PDF
This slide shows action plan for cross functional product teams which includes goal, number of completed tasks and percentage of completed goals, action, responsible person, required resources, status, etc.Deliver an awe inspiring pitch with this creative assuring management in product innovation to enhance processes action plan for cross functional product teams formats pdf bundle. Topics like create weekly newsletter, inbound or outbound, adjust customer can be discussed with this completely editable template. It is available for immediate download depending on the needs and requirements of the user.

Quarterly Sales Performance Of Business Analysis With Key Insights Information PDF
In this slide sales performance of each product is recorded as their percentage share in total sales first quarter of company. The goods include headphones, joystick, mouse pad, bluetooth speaker, etc. Pitch your topic with ease and precision using this Quarterly Sales Performance Of Business Analysis With Key Insights Information PDF. This layout presents information on Wireless Mouse, Keyboard, Mouse Pad, Joystick, Headsets. It is also available for immediate download and adjustment. So, changes can be made in the color, design, graphics or any other component to create a unique layout.
Project Tracking Planned Vs Actual Project Progress Tracker Pictures PDF
The following slide highlights the variations in the project progress to manage the its and ensure timely delivery. It includes KPIs such as completion percentage and the gap in the planned versus actual hours. Pitch your topic with ease and precision using this Project Tracking Planned Vs Actual Project Progress Tracker Pictures PDF. This layout presents information on Project Tracking Planned, Project Progress Tracker. It is also available for immediate download and adjustment. So, changes can be made in the color, design, graphics or any other component to create a unique layout.

Upskill Training For Employee Performance Improvement Employee Efficiency Graph For The Five Years Summary PDF
This slide shows the five- year graph of average production per employee in tonne and employee efficiency in percentage along with the key insights. Deliver and pitch your topic in the best possible manner with this upskill training for employee performance improvement employee efficiency graph for the five years summary pdf. Use them to share invaluable insights on employee efficiency graph for the five years and impress your audience. This template can be altered and modified as per your expectations. So, grab it now.

Organizational Tactical Plan Of Action Tools Usage Ppt Show Ideas PDF
This slide exhibit percentage of companies using tactical planning tools and techniques in their daily business decision making process. It includes organizations such as financial sectors, business groups, private companies, joint ventures etc. Showcasing this set of slides titled Organizational Tactical Plan Of Action Tools Usage Ppt Show Ideas PDF. The topics addressed in these templates are Mostly Used, Moderately Used, Rarely Used. All the content presented in this PPT design is completely editable. Download it and make adjustments in color, background, font etc. as per your unique business setting.

Buyers Conversion Rate Of The Company Themes PDF
This slide shows a graph of the percentage of actual buyers that make purchase form the site once they visit the site. The rate has considerably gone down since 2017 due to reasons such as poor user interface, limited product categories, long waiting time, complex billing options etc. Deliver an awe-inspiring pitch with this creative buyers conversion rate of the company themes pdf. bundle. Topics like buyers conversion rate, 2016 to 2021 can be discussed with this completely editable template. It is available for immediate download depending on the needs and requirements of the user.
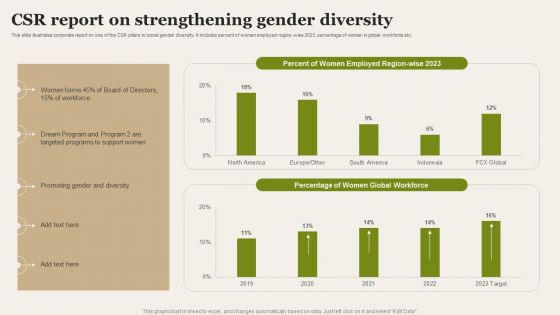
CSR Report On Strengthening Gender Diversity Introduction PDF
This slide illustrates corporate report on one of the CSR pillars to boost gender diversity. It includes percent of women employed region wise 2023, percentage of women in global workforce etc. Pitch your topic with ease and precision using this CSR Report On Strengthening Gender Diversity Introduction PDF. This layout presents information on Targeted Programs, Strengthening Gender Diversity. It is also available for immediate download and adjustment. So, changes can be made in the color, design, graphics or any other component to create a unique layout.
Technology Disaster Recovery Plan Current Situation Of The Client Company Icons PDF
This slide depicts the current situation of the client company by displaying the total number of breaches due to hacking, the number of errors, the percentage of social attacks, and so on. Deliver and pitch your topic in the best possible manner with this Technology Disaster Recovery Plan Current Situation Of The Client Company Icons PDF. Use them to share invaluable insights on Organized, Social and impress your audience. This template can be altered and modified as per your expectations. So, grab it now.
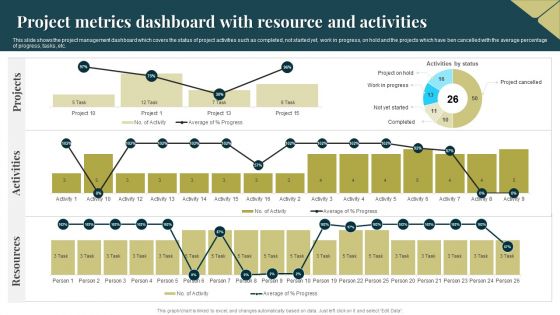
Project Metrics Dashboard With Resource And Activities Infographics PDF
This slide shows the project management dashboard which covers the status of project activities such as completed, not started yet, work in progress, on hold and the projects which have ben cancelled with the average percentage of progress, tasks, etc. Showcasing this set of slides titled Project Metrics Dashboard With Resource And Activities Infographics PDF. The topics addressed in these templates are Activities, Projects, Resources. All the content presented in this PPT design is completely editable. Download it and make adjustments in color, background, font etc. as per your unique business setting.
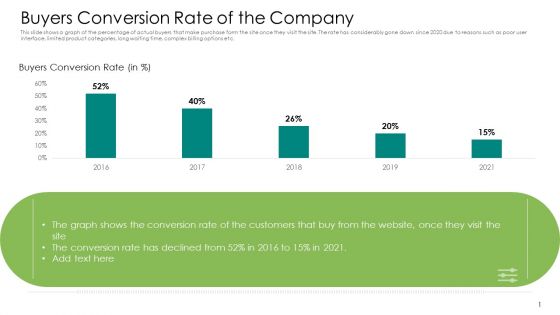
Buyers Conversion Rate Of The Company Diagrams PDF
This slide shows a graph of the percentage of actual buyers that make purchase form the site once they visit the site. The rate has considerably gone down since 2020 due to reasons such as poor user interface, limited product categories, long waiting time, complex billing options etc. Deliver an awe-inspiring pitch with this creative buyers conversion rate of the company diagrams pdf. bundle. Topics like buyers conversion rate, 2016 to 2021 can be discussed with this completely editable template. It is available for immediate download depending on the needs and requirements of the user.
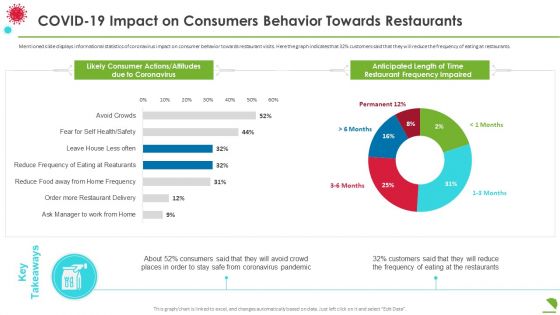
Covid19 Impact On Consumers Behavior Towards Restaurants Diagrams PDF
Mentioned slide displays informational statistics of coronavirus impact on consumer behavior towards restaurant visits. Here the graph indicates that 32 percentage customers said that they will reduce the frequency of eating at restaurants. Deliver an awe inspiring pitch with this creative covid19 impact on consumers behavior towards restaurants diagrams pdf bundle. Topics like covid 19 impact on consumers behavior towards restaurants can be discussed with this completely editable template. It is available for immediate download depending on the needs and requirements of the user.

Virtual Customer Healthcare Trends Among Different Generations Professional PDF
The below slide depicts the consumer trends in healthcare industry. The graph includes the data for the past two years comparing the percentage of change in the virtual visits among different generations. Pitch your topic with ease and precision using this Virtual Customer Healthcare Trends Among Different Generations Professional PDF. This layout presents information on Millennial, Baby Boomers, Seniors. It is also available for immediate download and adjustment. So, changes can be made in the color, design, graphics or any other component to create a unique layout.

Factory Waste Management Current Situation And Companies Target Diagrams PDF
This slide covers the current situation of the company along with future objectives such as eliminating collection of waste from revenues. It also covers revenue percentage for FY 20 21 . Deliver and pitch your topic in the best possible manner with this factory waste management current situation and companies target diagrams pdf. Use them to share invaluable insights on current situation and companies target and impress your audience. This template can be altered and modified as per your expectations. So, grab it now.

Health Insurance Company Expenses Of Operation Expenses Diagrams PDF
This slide shows the 3 years distribution of operating expenditure in health insurance to control drug related issues and extra expenses. This includes hospital and medical benefits , professional fees, etc.Showcasing this set of slides titled Health Insurance Company Expenses Of Operation Expenses Diagrams PDF. The topics addressed in these templates are Percentage Total Expenses, Propessional Fees, Emergency Room. All the content presented in this PPT design is completely editable. Download it and make adjustments in color, background, font etc. as per your unique business setting.
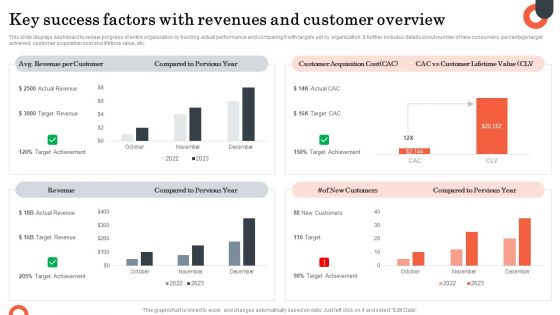
Key Success Factors With Revenues And Customer Overview Diagrams PDF
This slide displays dashboard to review progress of entire organization by tracking actual performance and comparing it with targets set by organization. It further includes details about number of new consumers, percentage target achieved, customer acquisition cost and lifetime value, etc. Showcasing this set of slides titled Key Success Factors With Revenues And Customer Overview Diagrams PDF. The topics addressed in these templates are Compared Pervious Year, Customer Acquisition Cost. All the content presented in this PPT design is completely editable. Download it and make adjustments in color, background, font etc. as per your unique business setting.

Digital Products Company Outline Ebitda And Margin Inspiration PDF
This slide illustrates a graph of EBITDA in US dollar and margin in percentage for software company illustrating growth trend in last five years from 2018 to 2022. It also showcases net profit contribution by services and solutions. Take your projects to the next level with our ultimate collection of Digital Products Company Outline Ebitda And Margin Inspiration PDF. Slidegeeks has designed a range of layouts that are perfect for representing task or activity duration, keeping track of all your deadlines at a glance. Tailor these designs to your exact needs and give them a truly corporate look with your own brand colors they will make your projects stand out from the rest.
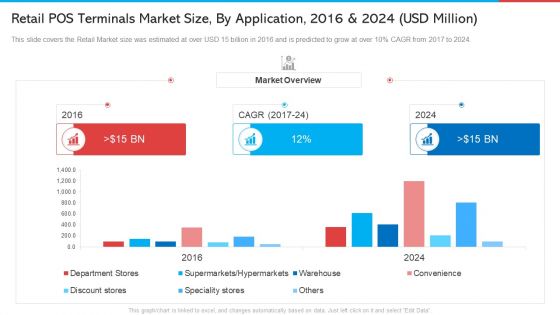
Retail POS Terminals Market Size By Application 2016 And 2024 USD Million Themes PDF
This slide covers the Retail Market size was estimated at over USD 15 billion in 2016 and is predicted to grow at over 10 percentage CAGR from 2017 to 2024. Deliver and pitch your topic in the best possible manner with this retail pos terminals market size by application 2016 and 2024 usd million themes pdf. Use them to share invaluable insights on retail pos terminals market size, by application, 2016 and 2024 usd million and impress your audience. This template can be altered and modified as per your expectations. So, grab it now.
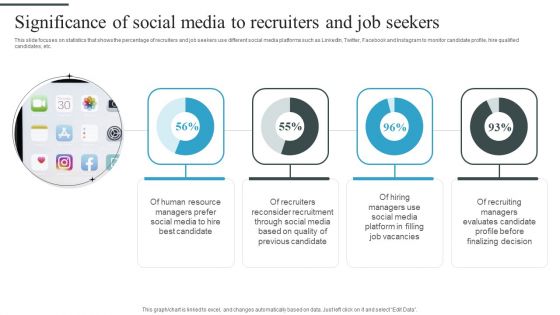
Tactical Process For Social Significance Of Social Media To Recruiters And Job Seekers Themes PDF
This slide focuses on statistics that shows the percentage of recruiters and job seekers use different social media platforms such as LinkedIn, Twitter, Facebook and Instagram to monitor candidate profile, hire qualified candidates, etc. Deliver an awe inspiring pitch with this creative Tactical Process For Social Significance Of Social Media To Recruiters And Job Seekers Themes PDF bundle. Topics like Human Resource, Best Candidate, Social Media can be discussed with this completely editable template. It is available for immediate download depending on the needs and requirements of the user.
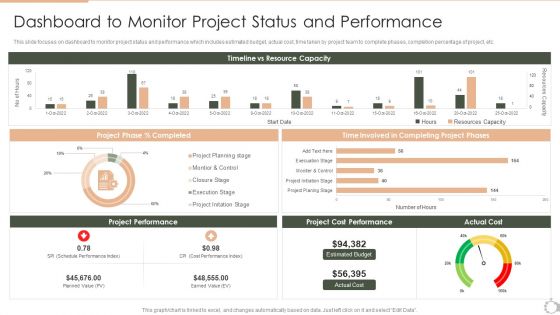
Techniques For Timely Project Dashboard To Monitor Project Status And Performance Microsoft PDF
This slide focuses on dashboard to monitor project status and performance which includes estimated budget, actual cost, time taken by project team to complete phases, completion percentage of project, etc. Deliver and pitch your topic in the best possible manner with this Techniques For Timely Project Dashboard To Monitor Project Status And Performance Microsoft PDF. Use them to share invaluable insights on Timeline vs, Resource Capacity, Project Phase, Time Involved and impress your audience. This template can be altered and modified as per your expectations. So, grab it now.
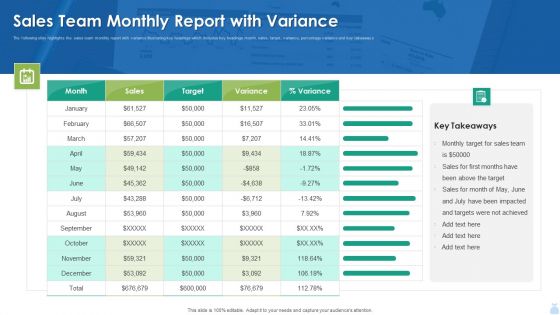
Sales Team Monthly Report With Variance Background PDF
The following slide highlights the sales team monthly report with variance illustrating key headings which includes key headings month, sales, target, variance, percentage variance and key takeaways. Pitch your topic with ease and precision using this Sales Team Monthly Report With Variance Background PDF. This layout presents information on Sales Team Monthly Report With Variance Background PDF. It is also available for immediate download and adjustment. So, changes can be made in the color, design, graphics or any other component to create a unique layout.

Quarterly Supply Chain Management Kpis Mockup PDF
The following slide depicts the key performing areas of supply chain management to improve customer satisfaction and operational efficiencies. It also includes KPIs such as annual inventory to sales, quarterly inventory turnover, percentage of targets achieved, inventory carrying cost etc. Pitch your topic with ease and precision using this Quarterly Supply Chain Management Kpis Mockup PDF. This layout presents information on Inventory Turnover, Inventory Carrying Cost, Target Achieved. It is also available for immediate download and adjustment. So, changes can be made in the color, design, graphics or any other component to create a unique layout.
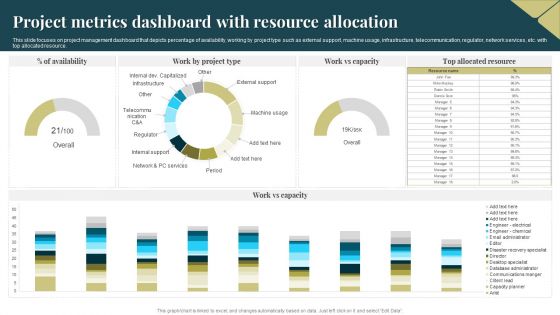
Project Metrics Dashboard With Resource Allocation Portrait PDF
This slide focuses on project management dashboard that depicts percentage of availability, working by project type such as external support, machine usage, infrastructure, telecommunication, regulator, network services, etc. with top allocated resource. Pitch your topic with ease and precision using this Project Metrics Dashboard With Resource Allocation Portrait PDF. This layout presents information on Project Metrics Dashboard, Resource Allocation. It is also available for immediate download and adjustment. So, changes can be made in the color, design, graphics or any other component to create a unique layout.

Customer Behavior Analytics Dashboard To Improve Satisfaction Ppt File Infographics PDF
The following slide provides an insight of websites performance that includes date parameters. The dashboard includes sessions, users, pageviews, bounce rate and percentage of new sessions. Pitch your topic with ease and precision using this Customer Behavior Analytics Dashboard To Improve Satisfaction Ppt File Infographics PDF. This layout presents information on Session, Avg Session Duration, Bounce Rate. It is also available for immediate download and adjustment. So, changes can be made in the color, design, graphics or any other component to create a unique layout.
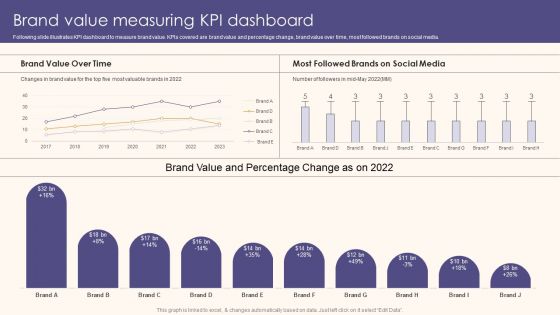
Brand Value Measuring KPI Dashboard Guide To Understand Evaluate And Enhance Brand Value Slides PDF
Following slide illustrates KPI dashboard to measure brand value. KPIs covered are brand value and percentage change, brand value over time, most followed brands on social media.Take your projects to the next level with our ultimate collection of Brand Value Measuring KPI Dashboard Guide To Understand Evaluate And Enhance Brand Value Slides PDF. Slidegeeks has designed a range of layouts that are perfect for representing task or activity duration, keeping track of all your deadlines at a glance. Tailor these designs to your exact needs and give them a truly corporate look with your own brand colors they all make your projects stand out from the rest
Tracking Goals Alignment KPI Dashboard Guidelines PDF
This slide showcases a tracking dashboard for determining the alignment and progress percentage of the assigned objectives. It also includes the objective evaluation KPIs such as active objectives, overall progress, total employees, objective as per employees, aligned, organizational and departmental objectives. Pitch your topic with ease and precision using this Tracking Goals Alignment KPI Dashboard Guidelines PDF. This layout presents information on Employee, Organizational Objectives, Departmental Objectives. It is also available for immediate download and adjustment. So, changes can be made in the color, design, graphics or any other component to create a unique layout.
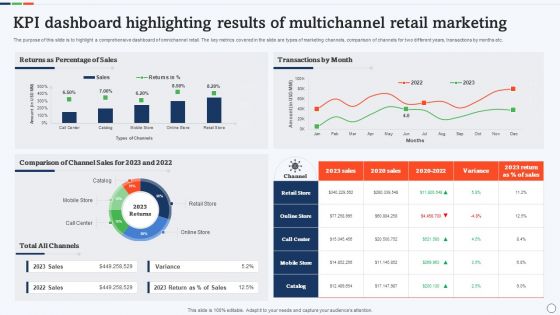
KPI Dashboard Highlighting Results Of Multichannel Retail Marketing Rules PDF
The purpose of this slide is to highlight a comprehensive dashboard of omnichannel retail. The key metrics covered in the slide are types of marketing channels, comparison of channels for two different years, transactions by months etc. Pitch your topic with ease and precision using this KPI Dashboard Highlighting Results Of Multichannel Retail Marketing Rules PDF. This layout presents information on Comparison Of Channel Sales, Percentage Of Sales, Transactions By Month. It is also available for immediate download and adjustment. So, changes can be made in the color, design, graphics or any other component to create a unique layout.
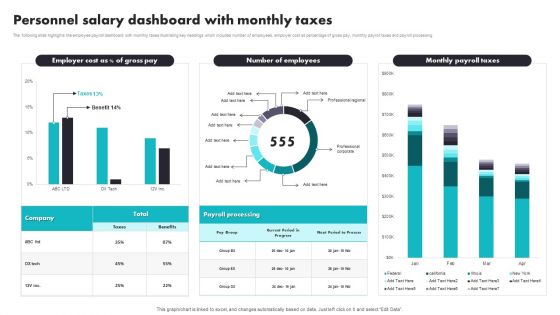
Personnel Salary Dashboard With Monthly Taxes Introduction PDF
The following slide highlights the employee payroll dashboard with monthly taxes illustrating key headings which includes number of employees, employer cost as percentage of gross pay, monthly payroll taxes and payroll processing. Pitch your topic with ease and precision using this Personnel Salary Dashboard With Monthly Taxes Introduction PDF. This layout presents information on Payroll Processing, Benefits. It is also available for immediate download and adjustment. So, changes can be made in the color, design, graphics or any other component to create a unique layout.
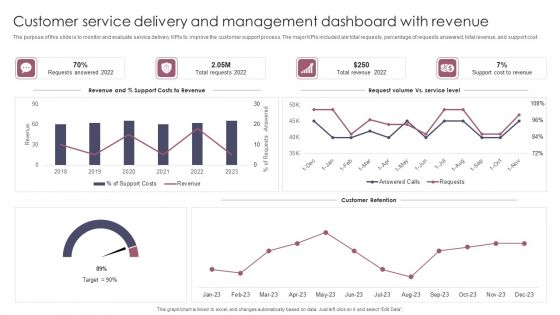
Customer Service Delivery And Management Dashboard With Revenue Brochure PDF
The purpose of this slide is to monitor and evaluate service delivery KPIs to improve the customer support process. The major KPIs included are total requests, percentage of requests answered, total revenue, and support cost. Pitch your topic with ease and precision using this Customer Service Delivery And Management Dashboard With Revenue Brochure PDF. This layout presents information on Customer Service Delivery, Management Dashboard With Revenue. It is also available for immediate download and adjustment. So, changes can be made in the color, design, graphics or any other component to create a unique layout.

Overview Of Reported Data Theft Threats Trends In Health Care Sector Introduction PDF
This slide covers findings for loss of data in health and medical sector. It includes stats on data patterns, motives behind data theft, percentage of data compromised, etc. Pitch your topic with ease and precision using this Overview Of Reported Data Theft Threats Trends In Health Care Sector Introduction PDF. This layout presents information on Top Threat Patterns, Exposure Country, March To September 2023. It is also available for immediate download and adjustment. So, changes can be made in the color, design, graphics or any other component to create a unique layout.
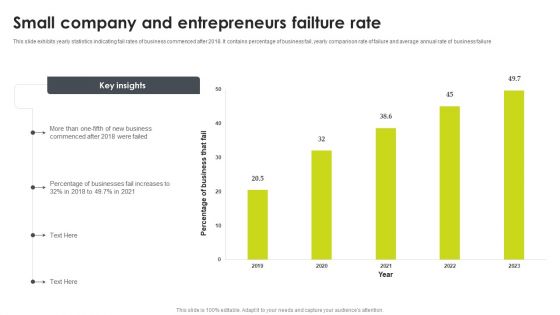
Small Company And Entrepreneurs Failture Rate Summary PDF
This slide exhibits yearly statistics indicating fail rates of business commenced after 2018. It contains percentage of business fail, yearly comparison rate of failure and average annual rate of business failure. Pitch your topic with ease and precision using this Small Company And Entrepreneurs Failture Rate Summary PDF. This layout presents information on Entrepreneurs Failture Rate, Business. It is also available for immediate download and adjustment. So, changes can be made in the color, design, graphics or any other component to create a unique layout.

IT Department Operations Issues Analysis Dashboard Designs PDF
This slide represents the dashboard showing operational analysis of issues faced by the IT team of the organization. It shows data related to uptime and downtime of servers, downtime issues, IT support employee per thousand end user over time etc.Pitch your topic with ease and precision using this IT Department Operations Issues Analysis Dashboard Designs PDF. This layout presents information on Support Employee, Uptime Downtime, Percentage Unsolved. It is also available for immediate download and adjustment. So, changes can be made in the color, design, graphics or any other component to create a unique layout.
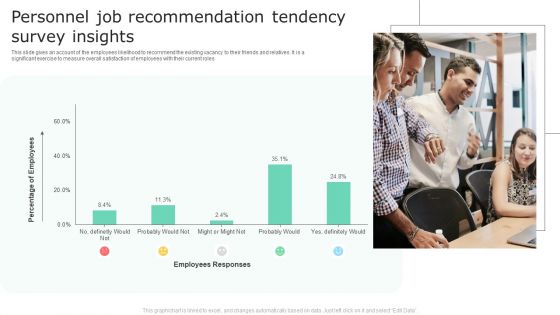
Personnel Job Recommendation Tendency Survey Insights Topics PDF
This slide gives an account of the employees likelihood to recommend the existing vacancy to their friends and relatives. It is a significant exercise to measure overall satisfaction of employees with their current roles. Pitch your topic with ease and precision using this Personnel Job Recommendation Tendency Survey Insights Topics PDF. This layout presents information on Percentage Of Employees, Employees Responses. It is also available for immediate download and adjustment. So, changes can be made in the color, design, graphics or any other component to create a unique layout.
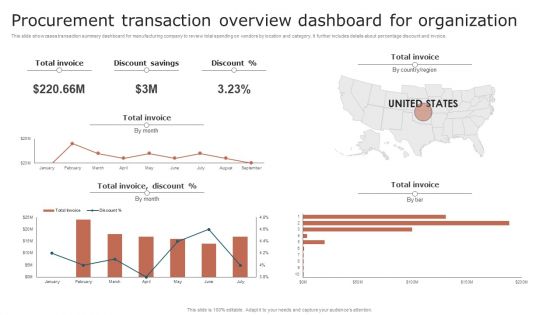
Procurement Transaction Overview Dashboard For Organization Background PDF
This slide showcases transaction summary dashboard for manufacturing company to review total spending on vendors by location and category. It further includes details about percentage discount and invoice. Pitch your topic with ease and precision using this Procurement Transaction Overview Dashboard For Organization Background PDF. This layout presents information on Procurement Transaction, Overview Dashboard For Organization. It is also available for immediate download and adjustment. So, changes can be made in the color, design, graphics or any other component to create a unique layout.

 Home
Home