Number Infographic
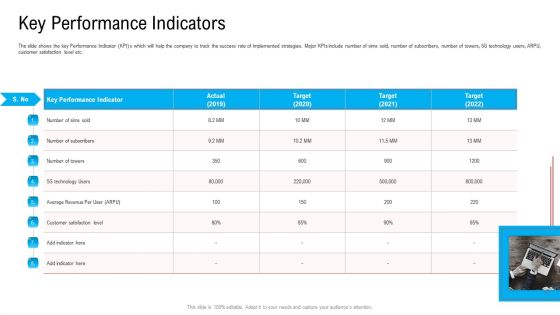
Key Performance Indicators Ppt Infographics Mockup PDF
The slide shows the key Performance Indicator KPI s which will help the company to track the success rate of implemented strategies. Major KPIs include number of sims sold, number of subscribers, number of towers, 5G technology users, ARPU, customer satisfaction level etc. This is a key performance indicators ppt infographics mockup pdf template with various stages. Focus and dispense information on one stage using this creative set, that comes with editable features. It contains large content boxes to add your information on topics like key performance indicator, technology, customer satisfaction level, target, 2019 to 2022. You can also showcase facts, figures, and other relevant content using this PPT layout. Grab it now.
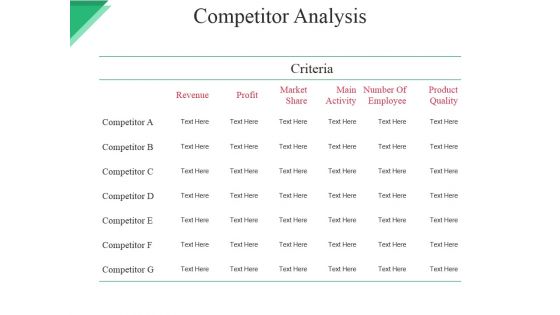
Competitor Analysis Ppt PowerPoint Presentation Show Infographics
This is a competitor analysis ppt powerpoint presentation show infographics. This is a seven stage process. The stages in this process are revenue, profit, market, share, main activity, number of employee.
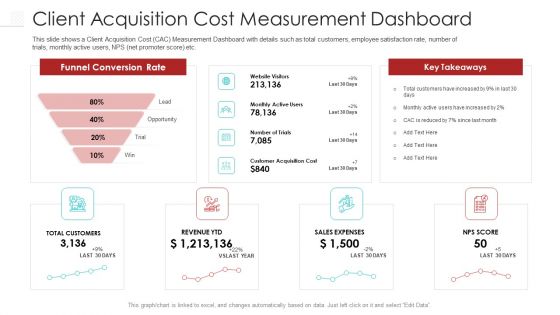
Client Acquisition Cost Measurement Dashboard Infographics PDF
This slide shows a Client Acquisition Cost CAC Measurement Dashboard with details such as total customers, employee satisfaction rate, number of trials, monthly active users, NPS net promoter score etc. Deliver an awe inspiring pitch with this creative client acquisition cost measurement dashboard infographics pdf bundle. Topics like funnel conversion rate, opportunity, key takeaways can be discussed with this completely editable template. It is available for immediate download depending on the needs and requirements of the user.

Food Company Overview Competitor Comparison Infographics PDF
The slide highlights the competitor comparison for top competitors. It compares companies on the basis of global market share, revenue, employee count, service area, number of brands and total sales.Deliver and pitch your topic in the best possible manner with this Food Company Overview Competitor Comparison Infographics PDF. Use them to share invaluable insights on Currently Serves, Quantum Foods, Key Insights and impress your audience. This template can be altered and modified as per your expectations. So, grab it now.

Brief History And Key Events Infographics PDF
This slide Provides the key historical events of the company including its founding, expansion, number of clients landmark, new launches etc. This is a brief history and key events infographics pdf. template with various stages. Focus and dispense information on one stages using this creative set, that comes with editable features. It contains large content boxes to add your information on topics like brief history and key events. You can also showcase facts, figures, and other relevant content using this PPT layout. Grab it now.
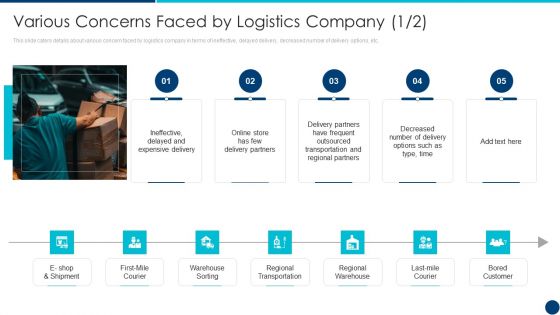
Various Concerns Faced By Logistics Company Freight Forwarding Agency Ppt Infographics Infographics PDF
This slide caters details about various concern faced by logistics company in terms of ineffective, delayed delivery, decreased number of delivery options, etc. Deliver and pitch your topic in the best possible manner with this various concerns faced by logistics company freight forwarding agency ppt infographics infographics pdf. Use them to share invaluable insights on regional transportation, regional warehouse, bored customer, delivery partners, ineffective, delayed and impress your audience. This template can be altered and modified as per your expectations. So, grab it now.

Thank You Ppt PowerPoint Presentation Infographics Rules
This is a thank you ppt powerpoint presentation infographics rules. This is a one stage process. The stages in this process are address, contact numbers, email address.

Contact Us Ppt PowerPoint Presentation Infographics Example
This is a contact us ppt powerpoint presentation infographics example. This is a one stage process. The stages in this process are address, contact number, email address.

Thank You Ppt PowerPoint Presentation Infographics Influencers
This is a thank you ppt powerpoint presentation infographics influencers. This is a one stage process. The stages in this process are address, contact numbers, email address.

Thank You Ppt PowerPoint Presentation Infographics Visuals
This is a thank you ppt powerpoint presentation infographics visuals. This is a one stage process. The stages in this process are address, contact numbers, email address.

Thank You Ppt PowerPoint Presentation Infographics
This is a thank you ppt powerpoint presentation infographics. This is a one stage process. The stages in this address, contact numbers, email address.

Thank You Ppt PowerPoint Presentation Gallery Infographics
This is a thank you ppt powerpoint presentation gallery infographics. This is a one stage process. The stages in this process are thank you, address, contact numbers, email address.
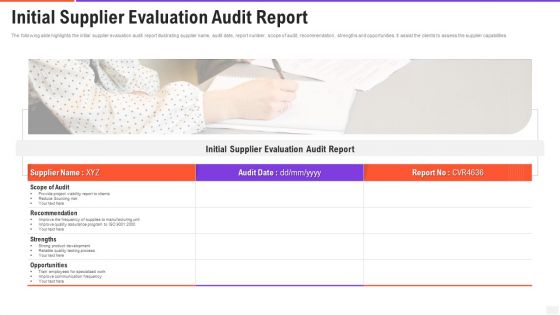
Initial Supplier Evaluation Audit Report Infographics PDF
The following slide highlights the initial supplier evaluation audit report illustrating supplier name, audit date, report number, scope of audit, recommendation, strengths and opportunities. It assist the clients to assess the supplier capabilities. Presenting initial supplier evaluation audit report infographics pdf to dispense important information. This template comprises one stages. It also presents valuable insights into the topics including scope of audit, recommendation, opportunities. This is a completely customizable PowerPoint theme that can be put to use immediately. So, download it and address the topic impactfully.
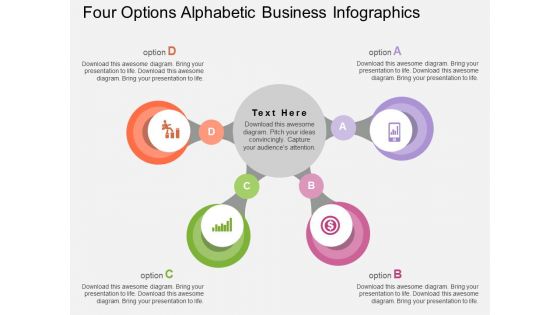
Four Options Alphabetic Business Infographics Powerpoint Template
The above PPT template displays layout of four options alphabetic steps. This diagram helps to exhibit steps to perform business action. Adjust the above diagram in your business presentations to visually support your content.
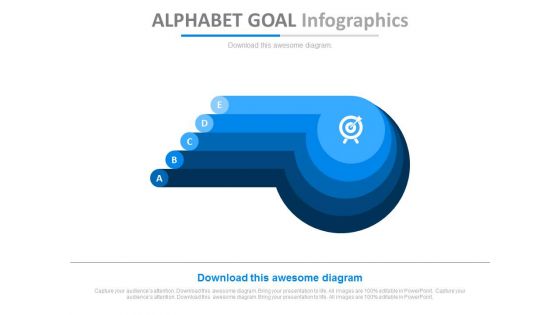
Five Steps Alphabet Goal Infographics Powerpoint Slides
This PPT slide contains unique graphic design of alphabetic steps with goals icon. You may use this PPT slide to display strategy for target achievement. Impress your audiences by using this PPT slide.
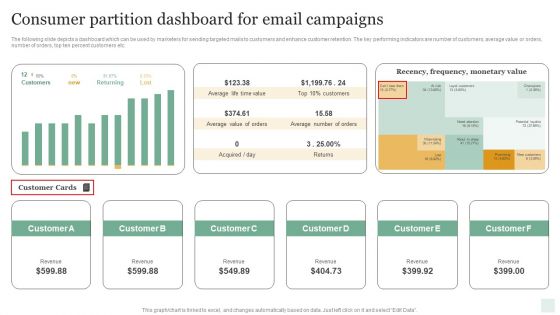
Consumer Partition Dashboard For Email Campaigns Infographics PDF
The following slide depicts a dashboard which can be used by marketers for sending targeted mails to customers and enhance customer retention. The key performing indicators are number of customers, average value or orders, number of orders, top ten percent customers etc. Showcasing this set of slides titled Consumer Partition Dashboard For Email Campaigns Infographics PDF. The topics addressed in these templates are Average Life Time Value, Average Value Of Orders, Returns, Average Number Of Orders. All the content presented in this PPT design is completely editable. Download it and make adjustments in color, background, font etc. as per your unique business setting.
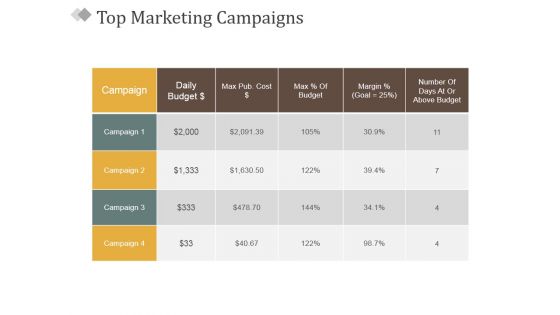
Top Marketing Campaigns Ppt PowerPoint Presentation Infographics Ideas
This is a top marketing campaigns ppt powerpoint presentation infographics ideas. This is a four stage process. The stages in this process are campaign, daily budget, daily budget, max pub cost, number of days at or above budget.

competition comparison table ppt powerpoint presentation infographics design inspiration
This is a competition comparison table ppt powerpoint presentation infographics design inspiration. This is a seven stage process. The stages in this process are revenue, profit, market share, main activity, number of employee.

Pareto Chart Ppt PowerPoint Presentation Infographics Design Inspiration
This is a pareto chart ppt powerpoint presentation infographics design inspiration. This is a seven stage process. The stages in this process are number of defects, business, marketing, finance.
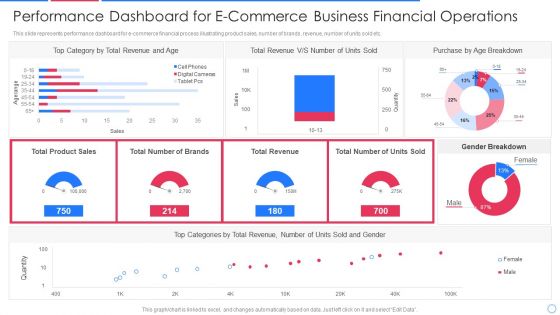
Performance Dashboard For E Commerce Business Financial Operations Infographics PDF
This slide represents performance dashboard for e-commerce financial process illustrating product sales, number of brands, revenue, number of units sold etc.Pitch your topic with ease and precision using this performance dashboard for e commerce business financial operations infographics pdf This layout presents information on category by total revenue, total revenue, purchase by age breakdown It is also available for immediate download and adjustment. So, changes can be made in the color, design, graphics or any other component to create a unique layout.
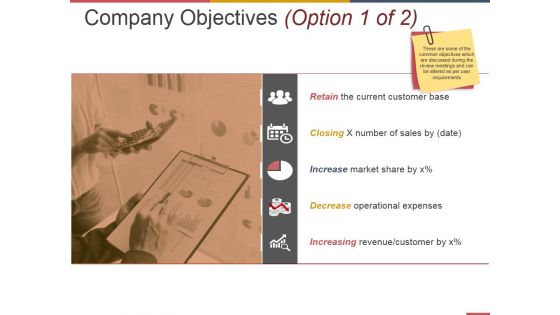
Company Objectives Template 1 Ppt PowerPoint Presentation Styles Infographics
This is a company objectives template 1 ppt powerpoint presentation styles infographics. This is a one stage process. The stages in this process are current customer base, number of sales by, market share, operational expenses.
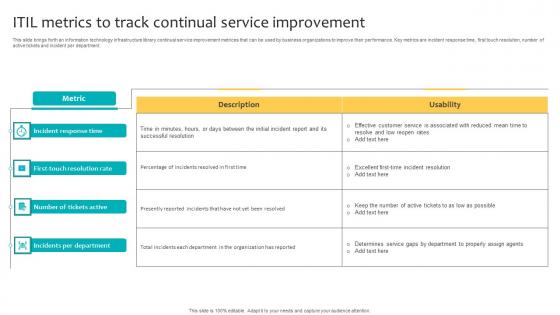
ITIL Metrics To Track Continual Service Improvement Infographics Pdf
This slide brings forth an information technology infrastructure library continual service improvement metrices that can be used by business organizations to improve their performance. Key metrics are incident response time, first touch resolution, number of active tickets and incident per department. Pitch your topic with ease and precision using this ITIL Metrics To Track Continual Service Improvement Infographics Pdf. This layout presents information on Incident Response Time, Number Of Tickets Active, Incidents Per Department. It is also available for immediate download and adjustment. So, changes can be made in the color, design, graphics or any other component to create a unique layout.
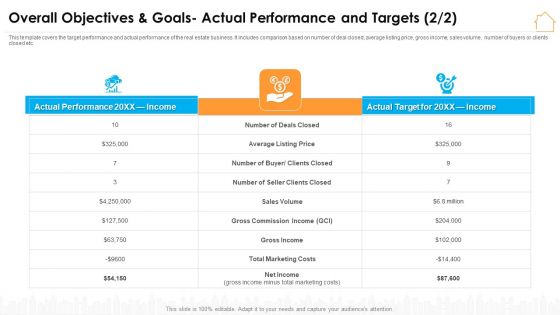
Overall Objectives And Goals Actual Performance And Targets Infographics PDF
This template covers the target performance and actual performance of the real estate business. It includes comparison based on number of deal closed, average listing price, gross income, sales volume, number of buyers or clients closed etc. Deliver and pitch your topic in the best possible manner with this overall objectives and goals actual performance and targets infographics pdf. Use them to share invaluable insights on sales volume, gross commission income, gross income and impress your audience. This template can be altered and modified as per your expectations. So, grab it now.
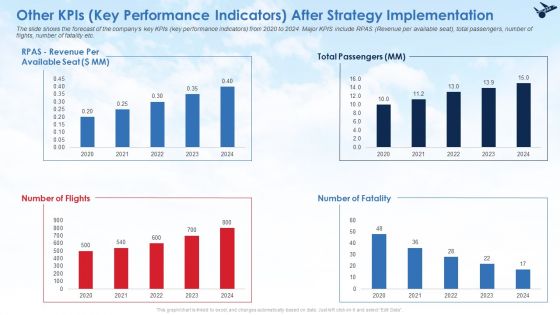
Other Kpis Key Performance Indicators After Strategy Implementation Infographics PDF
The slide shows the forecast of the companys key KPIs key performance indicators from 2020 to 2024. Major KPIS include RPAS Revenue per available seat, total passengers, number of flights, number of fatality etc. Deliver and pitch your topic in the best possible manner with this other kpis key performance indicators after strategy implementation infographics pdf. Use them to share invaluable insights on other kpis key performance indicators after strategy implementation and impress your audience. This template can be altered and modified as per your expectations. So, grab it now.
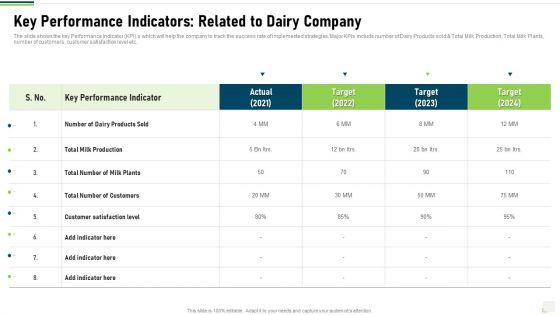
Key Performance Indicators Related To Dairy Company Infographics PDF
The slide shows the key Performance Indicator KPI s which will help the company to track the success rate of implemented strategies. Major KPIs include number of Dairy Products sold and Total Milk Production, Total Milk Plants, number of customers, customer satisfaction level etc. Deliver and pitch your topic in the best possible manner with this key performance indicators related to dairy company infographics pdf. Use them to share invaluable insights on key performance indicators related to dairy company and impress your audience. This template can be altered and modified as per your expectations. So, grab it now.
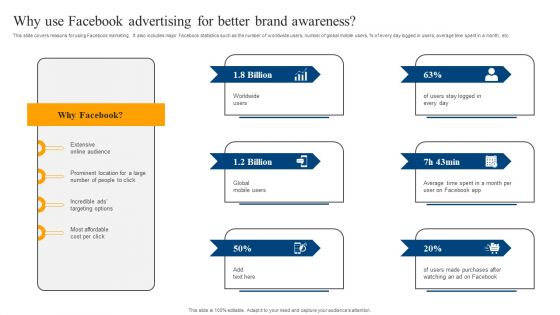
Why Use Facebook Advertising For Better Brand Awareness Infographics PDF
This slide covers reasons for using Facebook marketing. It also includes major Facebook statistics such as the number of worldwide users, number of global mobile users, percent of every day logged in users, average time spent in a month, etc. Power up your presentations with our Why Use Facebook Advertising For Better Brand Awareness Infographics PDF single-slide PPT template. Our visually-stunning template will help you deliver your message with confidence. With easy-to-use editing options and fully customizable features, you can create polished and captivating presentations in no time. Say goodbye to boring slides and hello to impactful presentations with our top-quality template. Download now and get ready to wow your audience. singles
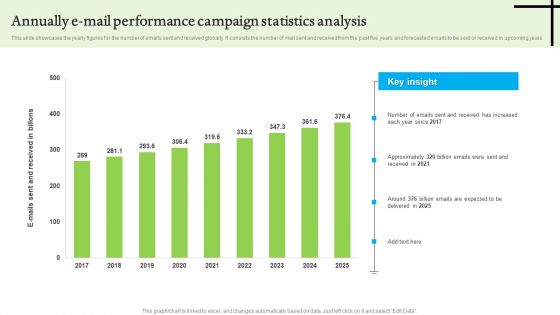
Annually E Mail Performance Campaign Statistics Analysis Infographics PDF
This slide showcases the yearly figures for the number of emails sent and received globally. It consists the number of mail sent and received from the past five years and forecasted emails to be sent or received in upcoming years. Showcasing this set of slides titled Annually E Mail Performance Campaign Statistics Analysis Infographics PDF. The topics addressed in these templates are Annually E Mail Performance, Campaign Statistics Analysis. All the content presented in this PPT design is completely editable. Download it and make adjustments in color, background, font etc. as per your unique business setting.

Content Marketing Performance Template 1 Ppt PowerPoint Presentation Styles Infographics
This is a content marketing performance template 1 ppt powerpoint presentation styles infographics. This is a eight stage process. The stages in this process are conversion rate, quality of leads, number of leads, sales revenue, website traffic, subscriber list growth, social media sharing, search engine ranking.

Powered Armor Overview Of Robotic Exoskeleton Company Infographics PDF
This slide represents the overview of the robotic exoskeleton manufacturing company, including the years of experience, the number of total products shipped worldwide, and the number of partners working in the network globally. Are you in need of a template that can accommodate all of your creative concepts This one is crafted professionally and can be altered to fit any style. Use it with Google Slides or PowerPoint. Include striking photographs, symbols, depictions, and other visuals. Fill, move around, or remove text boxes as desired. Test out color palettes and font mixtures. Edit and save your work, or work with colleagues. Download Powered Armor Overview Of Robotic Exoskeleton Company Infographics PDF and observe how to make your presentation outstanding. Give an impeccable presentation to your group and make your presentation unforgettable.

Comparison Of Top Cryptocurrency Companies Market Size Infographics PDF
The slide provides the Competitive landscape of the company on the basis of size i.e. number of users, revenue, Net income, app downloads, user traffic, social media followers etc.Deliver an awe-inspiring pitch with this creative comparison of top cryptocurrency companies market size infographics pdf. bundle. Topics like employee count, revenue, net income margin can be discussed with this completely editable template. It is available for immediate download depending on the needs and requirements of the user.
Enterprise System Business Administration Asset Tracking Dashboard Infographics PDF
This slide covers the asset tracking dashboard wherein terminal, object type, work type, number of breakdown, stoppages, etc. are tracked. Deliver and pitch your topic in the best possible manner with this enterprise system business administration asset tracking dashboard infographics pdf. Use them to share invaluable insights on asset tracking dashboard and impress your audience. This template can be altered and modified as per your expectations. So, grab it now.
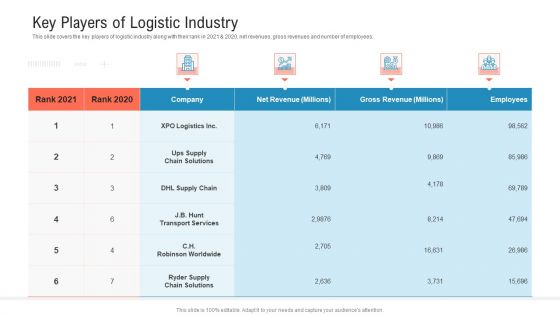
Transportation Governance Enhancement Key Players Of Logistic Industry Infographics PDF
This slide covers the key players of logistic industry along with their rank in 2021 and 2020, net revenues, gross revenues and number of employees. Deliver an awe-inspiring pitch with this creative transportation governance enhancement key players of logistic industry infographics pdf. bundle. Topics like company, net revenue, gross revenue, employees can be discussed with this completely editable template. It is available for immediate download depending on the needs and requirements of the user.
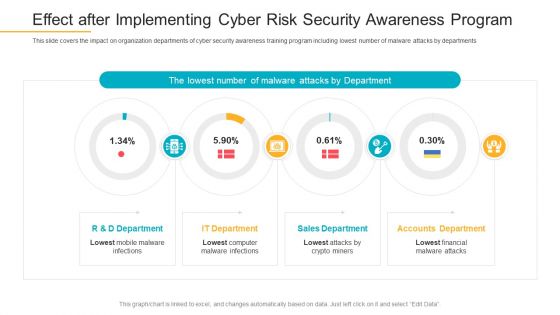
Effect After Implementing Cyber Risk Security Awareness Program Infographics PDF
This slide covers the impact on organization departments of cyber security awareness training program including lowest number of malware attacks by departments. Deliver an awe-inspiring pitch with this creative effect after implementing cyber risk security awareness program infographics pdf bundle. Topics like sales department, accounts department, it department can be discussed with this completely editable template. It is available for immediate download depending on the needs and requirements of the user.

Competitor Comparison On The Basis Of Key Financials Infographics PDF
The slide provides the companys comparisons with its competitors on the basis of key financials total revenue, net income, Assets under Management, employee count, number of M and A deals etc. Deliver an awe inspiring pitch with this creative competitor comparison on the basis of key financials infographics pdf bundle. Topics like competitor comparison on the basis of key financials can be discussed with this completely editable template. It is available for immediate download depending on the needs and requirements of the user.

Vitality And Network Effects Lunchclub Investor Capitalizing Elevator Infographics Pdf
This template covers lunchclub companys number natural global networks effects and professional connection span for multiple cities. Presenting vitality and network effects lunchclub investor capitalizing elevator infographics pdf to provide visual cues and insights. Share and navigate important information on one stages that need your due attention. This template can be used to pitch topics like vitality and network effects. In addtion, this PPT design contains high resolution images, graphics, etc, that are easily editable and available for immediate download.
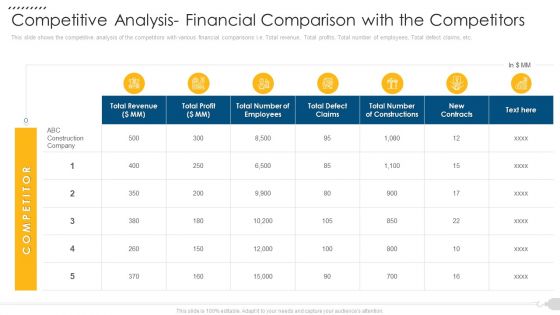
Competitive Analysis Financial Comparison With The Competitors Infographics PDF
This slide shows the competitive analysis of the competitors with various financial comparisons i.e. Total revenue, Total profits, Total number of employees, Total defect claims, etc. Deliver and pitch your topic in the best possible manner with this competitive analysis financial comparison with the competitors infographics pdf. Use them to share invaluable insights on profit, revenue, claims and impress your audience. This template can be altered and modified as per your expectations. So, grab it now.
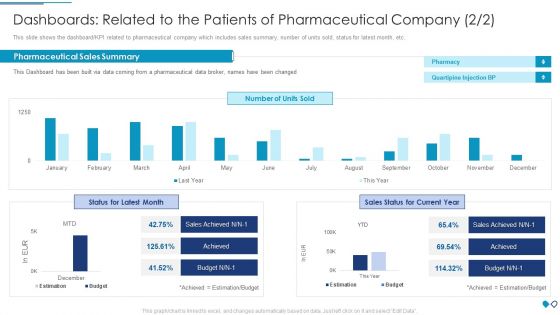
Dashboards Related To The Patients Of Pharmaceutical Company Infographics PDF
This slide shows the dashboard or KPI related to pharmaceutical company which includes sales summary, number of units sold, status for latest month, etc.Deliver an awe inspiring pitch with this creative dashboards related to the patients of pharmaceutical company infographics pdf bundle. Topics like pharmaceutical sales summary, pharmaceutical data broker, quartipine injection can be discussed with this completely editable template. It is available for immediate download depending on the needs and requirements of the user.
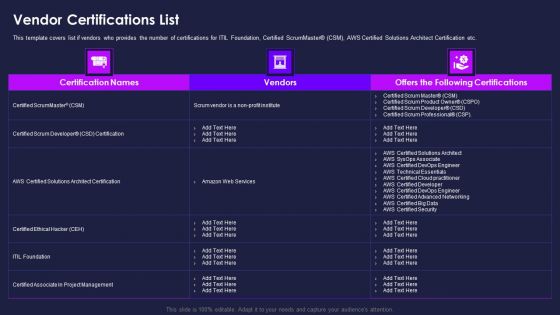
Certification Information Technology Professionals Vendor Certifications List Infographics PDF
This template covers list if vendors who provides the number of certifications for ITIL Foundation, Certified ScrumMaster CSM, AWS Certified Solutions Architect Certification etc. Deliver an awe inspiring pitch with this creative certification information technology professionals vendor certifications list infographics pdf bundle. Topics like vendor certifications list can be discussed with this completely editable template. It is available for immediate download depending on the needs and requirements of the user.
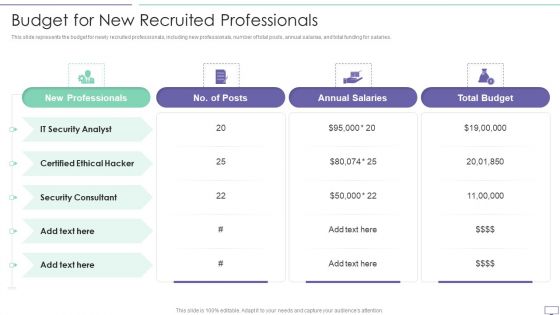
IT Security Hacker Budget For New Recruited Professionals Infographics PDF
This slide represents the budget for newly recruited professionals, including new professionals, number of total posts, annual salaries, and total funding for salaries.Deliver and pitch your topic in the best possible manner with this IT Security Hacker Budget For New Recruited Professionals Infographics PDF. Use them to share invaluable insights on New Professionals, Certified Ethical, Annual Salaries and impress your audience. This template can be altered and modified as per your expectations. So, grab it now.
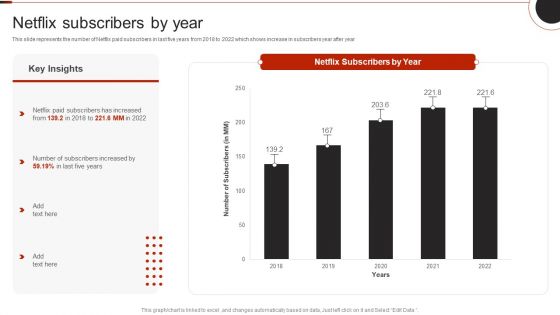
Netflix Company Outline Netflix Subscribers By Year Infographics PDF
This slide represents the number of Netflix paid subscribers in last five years from 2018 to 2022 which shows increase in subscribers year after year.Deliver an awe inspiring pitch with this creative Netflix Company Outline Netflix Subscribers By Year Infographics PDF bundle. Topics like Netflix Subscribers, Netflix Paid, Subscribers Increased can be discussed with this completely editable template. It is available for immediate download depending on the needs and requirements of the user.
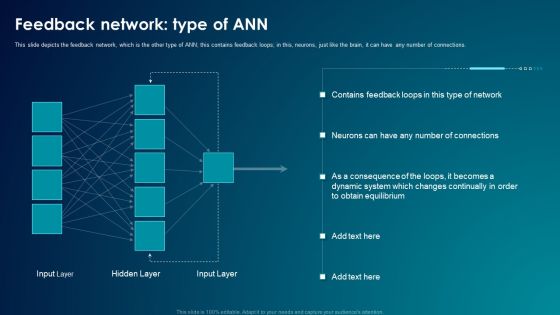
ANN System Feedback Network Type Of ANN Infographics PDF
This slide depicts the feedback network, which is the other type of ANN this contains feedback loops in this, neurons, just like the brain, it can have any number of connections. Deliver an awe inspiring pitch with this creative ANN System Feedback Network Type Of ANN Infographics PDF bundle. Topics like Feedback Network, Type Of Ann can be discussed with this completely editable template. It is available for immediate download depending on the needs and requirements of the user.
Tactical Planning And Analyzing Organizational Goals Icon Infographics PDF
This slide defines the dashboard for analyzing the sales key performance indicators KPIs. It includes information related to the number of sales, revenue, profit, and cost. Showcasing this set of slides titled Tactical Planning And Analyzing Organizational Goals Icon Infographics PDF. The topics addressed in these templates are Cost Breakdown, Sales Revenue, Accumulated Revenue. All the content presented in this PPT design is completely editable. Download it and make adjustments in color, background, font etc. as per your unique business setting.
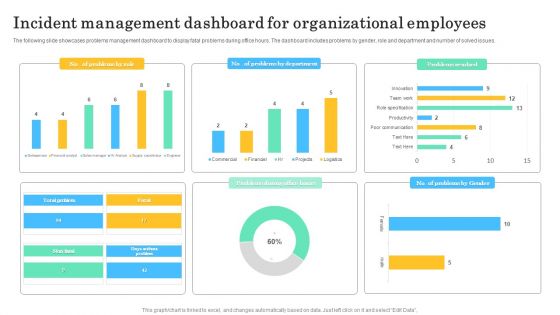
Incident Management Dashboard For Organizational Employees Infographics PDF
The following slide showcases problems management dashboard to display fatal problems during office hours. The dashboard includes problems by gender, role and department and number of solved issues. Showcasing this set of slides titled Incident Management Dashboard For Organizational Employees Infographics PDF. The topics addressed in these templates are Incident Management Dashboard, Organizational Employees. All the content presented in this PPT design is completely editable. Download it and make adjustments in color, background, font etc. as per your unique business setting.
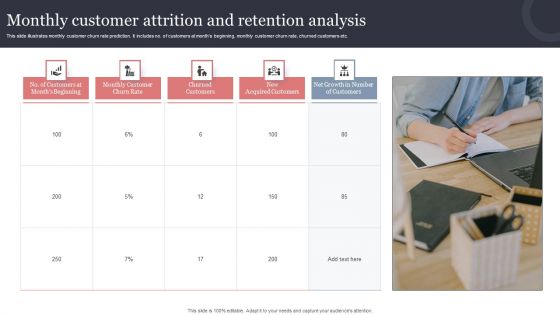
Monthly Customer Attrition And Retention Analysis Infographics PDF
This slide illustrates monthly customer churn rate prediction. It includes no. of customers at months beginning, monthly customer churn rate, churned customers etc. Presenting Monthly Customer Attrition And Retention Analysis Infographics PDF to dispense important information. This template comprises one stages. It also presents valuable insights into the topics including Number Customers Months Beginning, Monthly Customer Churn Rate, Churned Customers. This is a completely customizable PowerPoint theme that can be put to use immediately. So, download it and address the topic impactfully.
Text Boxes With Icons PowerPoint Templates
This PowerPoint template has been designed with numbered list of options. This Infographics template useful for text display. Accelerate the impact of your ideas using this template.
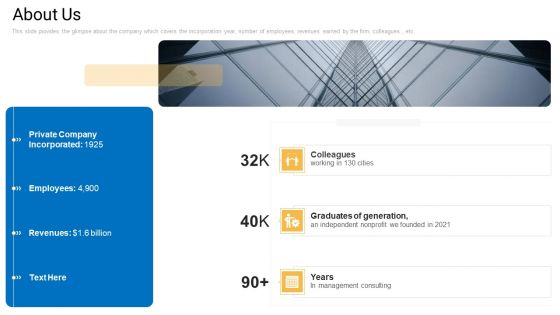
Sales Management Advisory Service About Us Ppt Infographics Skills PDF
This slide provides the glimpse about the company which covers the incorporation year, number of employees, revenues earned by the firm, colleagues , etc. This is a sales management advisory service about us ppt infographics skills pdf template with various stages. Focus and dispense information on three stages using this creative set, that comes with editable features. It contains large content boxes to add your information on topics like employees, nonprofit, revenues. You can also showcase facts, figures, and other relevant content using this PPT layout. Grab it now.

Workforce Management Planning With Role Requirements Infographics PDF
This slide shows staff management plan for role requirements. It provides information about role, project accountability, competencies required, number of employees needed, estimated start date and duration required. Pitch your topic with ease and precision using this workforce management planning with role requirements infographics pdf This layout presents information on evaluation team, web developer, project accountability. It is also available for immediate download and adjustment. So, changes can be made in the color, design, graphics or any other component to create a unique layout.

Food Manufacturing Registered Plants In USA Infographics PDF
The purpose of this slide is to represent the number of food manufacturing plants in the USA. The multiple registered plants in the country are exhibited on map to showcase state wise distribution. This is a Food Manufacturing Registered Plants In USA Infographics PDF template with various stages. Focus and dispense information on one stages using this creative set, that comes with editable features. It contains large content boxes to add your information on topics like Business, Food Manufacturing, Registered Plants. You can also showcase facts, figures, and other relevant content using this PPT layout. Grab it now.

Quarterly Manpower Analytics Dashboard For Talent Management Infographics PDF
This slide covers dashboard with employees details prepared by human resources. It includes number of employees, monthly salary, vacancies count, turnover rate, terminated employees, workforce talent satisfaction scale, etc. Showcasing this set of slides titled Quarterly Manpower Analytics Dashboard For Talent Management Infographics PDF. The topics addressed in these templates are Talent Management, Cost Per Hire, Net Training Costs. All the content presented in this PPT design is completely editable. Download it and make adjustments in color, background, font etc. as per your unique business setting.
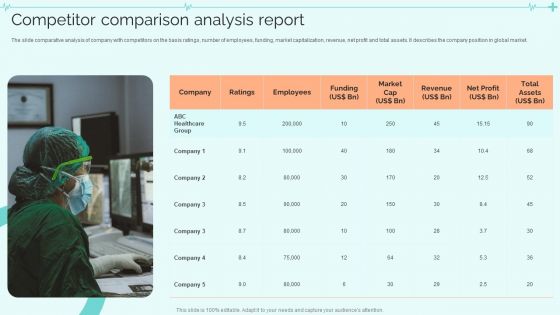
Clinical Services Company Profile Competitor Comparison Analysis Report Infographics PDF
The slide comparative analysis of company with competitors on the basis ratings, number of employees, funding, market capitalization, revenue, net profit and total assets. It describes the company position in global market. This is a Clinical Services Company Profile Competitor Comparison Analysis Report Infographics PDF template with various stages. Focus and dispense information on one stages using this creative set, that comes with editable features. It contains large content boxes to add your information on topics like Employees, Revenue, Net Profit. You can also showcase facts, figures, and other relevant content using this PPT layout. Grab it now.
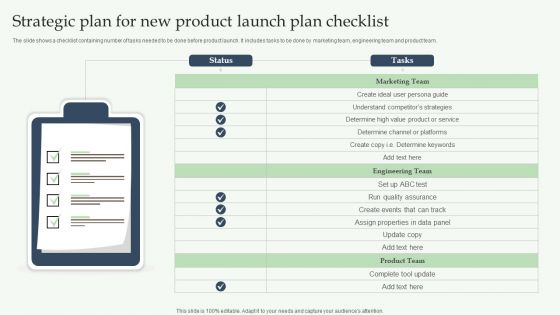
Strategic Plan For New Product Launch Plan Checklist Infographics PDF
The slide shows a checklist containing number of tasks needed to be done before product launch. It includes tasks to be done by marketing team, engineering team and product team. Presenting Strategic Plan For New Product Launch Plan Checklist Infographics PDF to dispense important information. This template comprises one stages. It also presents valuable insights into the topics including Marketing Team, Engineering Team, Product Team. This is a completely customizable PowerPoint theme that can be put to use immediately. So, download it and address the topic impactfully.

Fundraising Event Communication Agenda Development Process Infographics PDF
The slide carries a plan for effective communication of fundraising event to attract and encourage large number of donors. Various steps included are auditing, set objectives, define target audience, messaging, communication channels, assign teams, track and review . Presenting Fundraising Event Communication Agenda Development Process Infographics PDF to dispense important information. This template comprises seven stages. It also presents valuable insights into the topics including Communication Channels, Define Target Audience, Requirements Campaign. This is a completely customizable PowerPoint theme that can be put to use immediately. So, download it and address the topic impactfully.

Software Engineering Performance Metrics Dashboard To Improve Results Infographics PDF
This slide covers software engineering KPI dashboard to improve results and efficiency. It involves details such as new issues of last week, number of remaining issues, daily pull requests, average response time on daily basis and cumulative task flow. Pitch your topic with ease and precision using this Software Engineering Performance Metrics Dashboard To Improve Results Infographics PDF. This layout presents information on Software Engineering Performance, Metrics Dashboard Improve Results. It is also available for immediate download and adjustment. So, changes can be made in the color, design, graphics or any other component to create a unique layout.
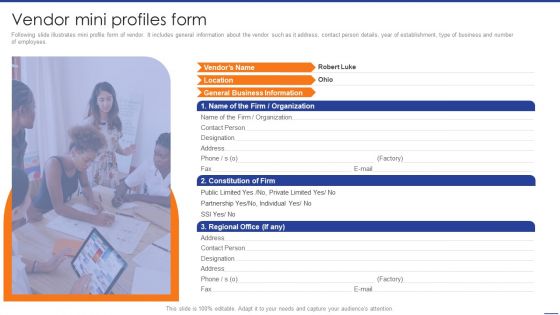
Digital Transformation Of Supply Vendor Mini Profiles Form Infographics PDF
Following slide illustrates mini profile form of vendor. It includes general information about the vendor such as it address, contact person details, year of establishment, type of business and number of employees. Take your projects to the next level with our ultimate collection of Digital Transformation Of Supply Vendor Mini Profiles Form Infographics PDF. Slidegeeks has designed a range of layouts that are perfect for representing task or activity duration, keeping track of all your deadlines at a glance. Tailor these designs to your exact needs and give them a truly corporate look with your own brand colors theyll make your projects stand out from the rest.

Value Drivers And Result Framework Overview Ppt Infographics Ideas PDF
The slide covers various drivers and outcomes to align developmental activities for creating business value. Various drivers included are boost revenue per visitor, increase number of visitors, enhance platform stability and reduce development expenses. Pitch your topic with ease and precision using this Value Drivers And Result Framework Overview Ppt Infographics Ideas PDF. This layout presents information on Outcomes, Drivers, Kpis, Boost Revenue, Per Visitor. It is also available for immediate download and adjustment. So, changes can be made in the color, design, graphics or any other component to create a unique layout.

Business Connection Network Company Outline Mission And Vision Infographics PDF
The slide highlights the mission and vision of LinkedIn corporation along with brief information about number of members and presence in countries. Welcome to our selection of the Business Connection Network Company Outline Mission And Vision Infographics PDF. These are designed to help you showcase your creativity and bring your sphere to life. Planning and Innovation are essential for any business that is just starting out. This collection contains the designs that you need for your everyday presentations. All of our PowerPoints are 100 percent editable, so you can customize them to suit your needs. This multi purpose template can be used in various situations. Grab these presentation templates today.

Data Automation Solution Investor Funding Presentation Shareholding Pattern Infographics PDF
Mentioned slide provides insights into company shareholding distribution by number of shareholders and percentage of holding by each member. Coming up with a presentation necessitates that the majority of the effort goes into the content and the message you intend to convey. The visuals of a PowerPoint presentation can only be effective if it supplements and supports the story that is being told. Keeping this in mind our experts created Data Automation Solution Investor Funding Presentation Shareholding Pattern Infographics PDF to reduce the time that goes into designing the presentation. This way, you can concentrate on the message while our designers take care of providing you with the right template for the situation.

Crash Couse Platform Investor Funding Presentation Shareholding Pattern Infographics PDF
The slide mentions the number of shares each business partner holds, such as Caledonia Investments, The Vanguard Group, Inc., Greenvale Capital LLP, etc. This modern and well arranged Crash Couse Platform Investor Funding Presentation Shareholding Pattern Infographics PDF provides lots of creative possibilities. It is very simple to customize and edit with the Powerpoint Software. Just drag and drop your pictures into the shapes. All facets of this template can be edited with Powerpoint no extra software is necessary. Add your own material, put your images in the places assigned for them, adjust the colors, and then you can show your slides to the world, with an animated slide included.
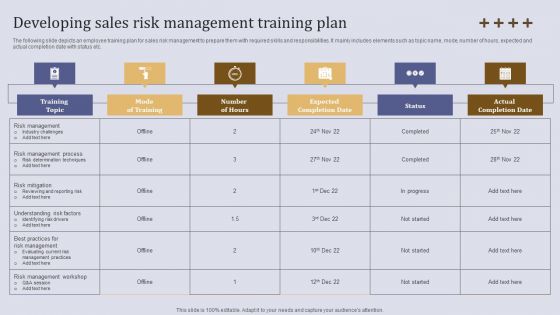
Developing Sales Risk Management Training Plan Ppt Slides Infographics PDF
The following slide depicts an employee training plan for sales risk management to prepare them with required skills and responsibilities. It mainly includes elements such as topic name, mode, number of hours, expected and actual completion date with status etc. The best PPT templates are a great way to save time, energy, and resources. Slidegeeks have 100 percent editable powerpoint slides making them incredibly versatile. With these quality presentation templates, you can create a captivating and memorable presentation by combining visually appealing slides and effectively communicating your message. Download Developing Sales Risk Management Training Plan Ppt Slides Infographics PDF from Slidegeeks and deliver a wonderful presentation.

Key Statistics Associated To Apple Brand Ppt Infographics Aids PDF
This slide caters details about key statistics associated to Apple in terms of number of employees, estimated annual revenue, market capitalization, active installed base of device, no. of Apple store across globe. The best PPT templates are a great way to save time, energy, and resources. Slidegeeks have 100 percent editable powerpoint slides making them incredibly versatile. With these quality presentation templates, you can create a captivating and memorable presentation by combining visually appealing slides and effectively communicating your message. Download Key Statistics Associated To Apple Brand Ppt Infographics Aids PDF from Slidegeeks and deliver a wonderful presentation.

 Home
Home