ITIL Metrics To Track Continual Service Improvement Infographics Pdf
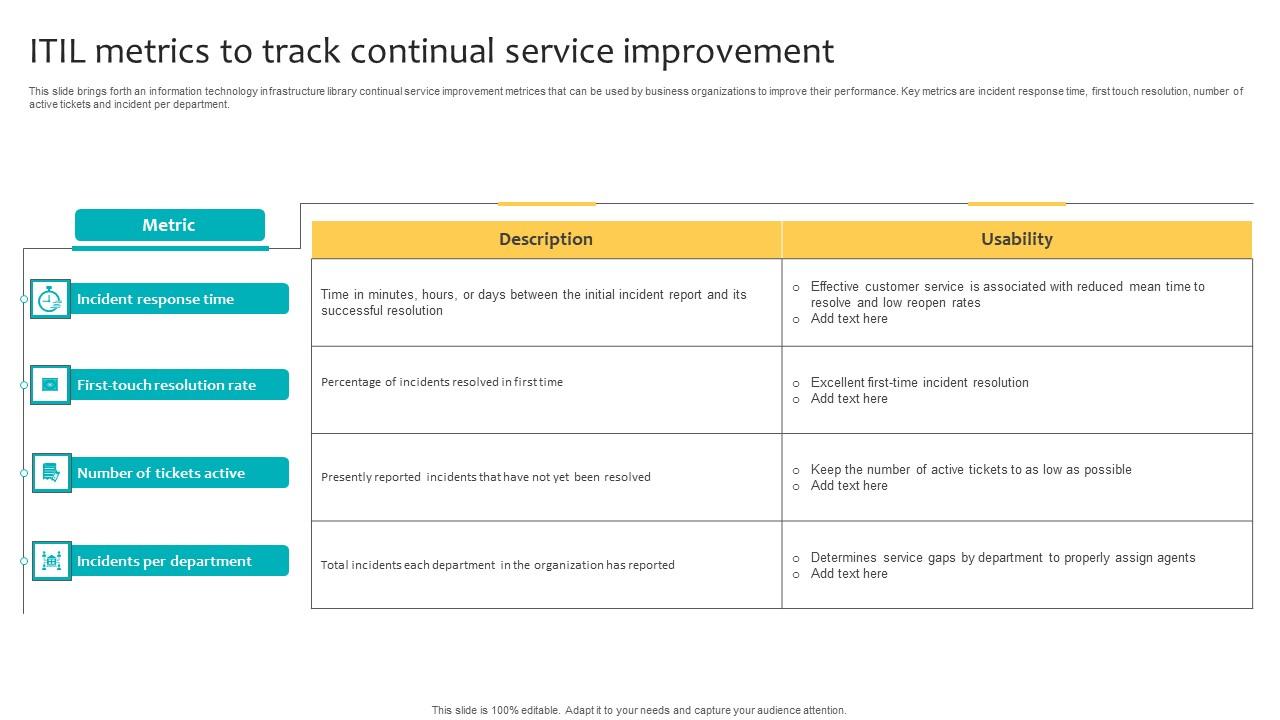
This slide brings forth an information technology infrastructure library continual service improvement metrices that can be used by business organizations to improve their performance. Key metrics are incident response time, first touch resolution, number of active tickets and incident per department.
- Google Slides is a new FREE Presentation software from Google.
- All our content is 100% compatible with Google Slides.
- Just download our designs, and upload them to Google Slides and they will work automatically.
- Amaze your audience with SlideGeeks and Google Slides.
-
Want Changes to This PPT Slide? Check out our Presentation Design Services
- WideScreen Aspect ratio is becoming a very popular format. When you download this product, the downloaded ZIP will contain this product in both standard and widescreen format.
-

- Some older products that we have may only be in standard format, but they can easily be converted to widescreen.
- To do this, please open the SlideGeeks product in Powerpoint, and go to
- Design ( On the top bar) -> Page Setup -> and select "On-screen Show (16:9)” in the drop down for "Slides Sized for".
- The slide or theme will change to widescreen, and all graphics will adjust automatically. You can similarly convert our content to any other desired screen aspect ratio.
Compatible With Google Slides

Get This In WideScreen
You must be logged in to download this presentation.
 Impress Your
 Audience
 100%
100% Editable
Google Slides
Features of these PowerPoint presentation slides:
This slide brings forth an information technology infrastructure library continual service improvement metrices that can be used by business organizations to improve their performance. Key metrics are incident response time, first touch resolution, number of active tickets and incident per department. Pitch your topic with ease and precision using this ITIL Metrics To Track Continual Service Improvement Infographics Pdf. This layout presents information on Incident Response Time, Number Of Tickets Active, Incidents Per Department. It is also available for immediate download and adjustment. So, changes can be made in the color, design, graphics or any other component to create a unique layout. This slide brings forth an information technology infrastructure library continual service improvement metrices that can be used by business organizations to improve their performance. Key metrics are incident response time, first touch resolution, number of active tickets and incident per department.
People who downloaded this PowerPoint presentation also viewed the following :
ITIL Metrics To Track Continual Service Improvement Infographics Pdf with all 9 slides:
Use our ITIL Metrics To Track Continual Service Improvement Infographics Pdf to effectively help you save your valuable time. They are readymade to fit into any presentation structure.
Most Relevant Reviews
-
Perfect template with attractive color combination.
-
Qualitative and comprehensive slides.

 Home
Home 


