Metrics

Model Based Marketing Planning Powerpoint Slide Show
This is a model based marketing planning powerpoint slide show. This is a four stage process. The stages in this process are diagnostic metrics, inspirational vision, brand building, model based marketing planning.

Objective Of Risk Alignment Sample Diagram Ppt Slides
This is a objective of risk alignment sample diagram ppt slides. This is a eight stage process. The stages in this process are objectives, threats, opportunities, systemic risk, metrics, risk, resource, strategy.

Strategic Marketing Initiatives Sample Diagram Powerpoint Ideas
This is a strategic marketing initiatives sample diagram powerpoint ideas. This is a eight stage process. The stages in this process are analysis, metrics, contacts, clients, target market, branding, strategy, pricing.
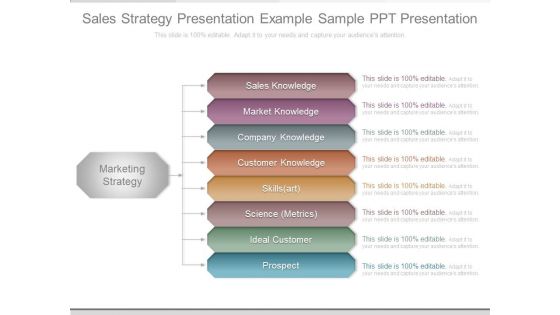
Sales Strategy Presentation Example Sample Ppt Presentation
This is a sales strategy presentation example sample ppt presentation. This is a eight stage process. The stages in this process are marketing strategy, sales knowledge, market knowledge, company knowledge, customer knowledge, skills art, science metrics, ideal customer, prospect.

Non Profit Service Model Sample Diagram Powerpoint Guide
This is a non profit service model sample diagram powerpoint guide. This is a six stage process. The stages in this process are functions of service, tpa broker, underwriting, metrics, customer outreach, partner agreements, results, impact, effectiveness.
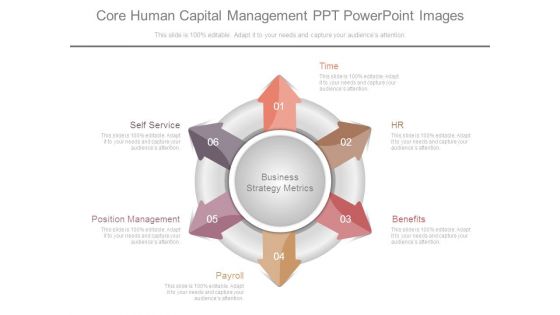
Core Human Capital Management Ppt Powerpoint Images
This is a core human capital management ppt powerpoint images. This is a six stage process. The stages in this process are business strategy metrics, self service, position management, payroll, benefits, hr, time.

Quality Management Applications Diagram Design
This is a quality management applications diagram design. This is a seven stage process. The stages in this process are sops, process review, monitoring oversight, regulatory requirement, trading, audits and inspection, quality metrics, quality management.
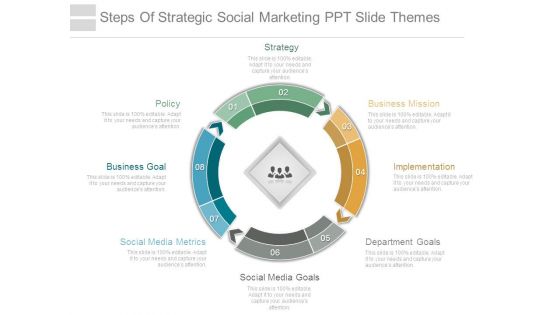
Steps Of Strategic Social Marketing Ppt Slide Themes
This is a steps of strategic social marketing ppt slide themes. This is a eight stage process. The stages in this process are strategy, policy, business goal, social media metrics, social media goals, department goals, implementation, business mission.
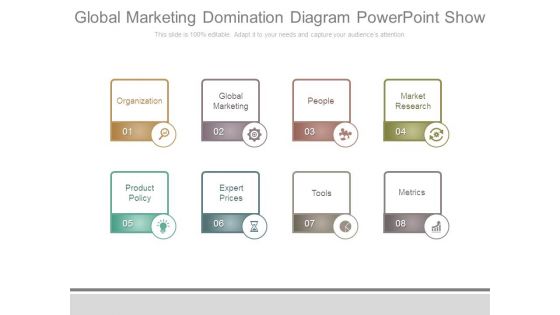
Global Marketing Domination Diagram Powerpoint Show
This is a global marketing domination diagram powerpoint show. This is a eight stage process. The stages in this process are organization, global marketing, people, market research, product policy, expert prices, tools, metrics.
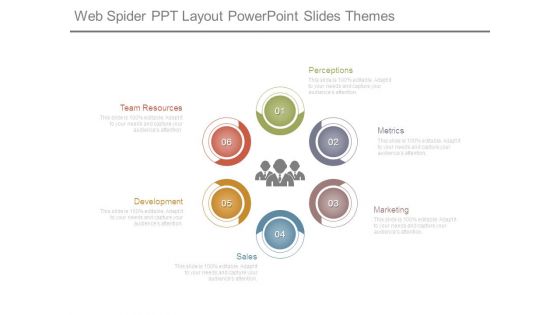
Web Spider Ppt Layout Powerpoint Slides Themes
This is a web spider ppt layout powerpoint slides themes. This is a six stage process. The stages in this process are perceptions, metrics, marketing, sales, development, team resources.

Sales And Marketing Plan Template Powerpoint Slides Graphics
This is a sales and marketing plan template powerpoint slides graphics. This is a six stage process. The stages in this process are sales process and strategy, market knowledge, science metrics, sales excellence and performance, sales skills, customer knowledge.
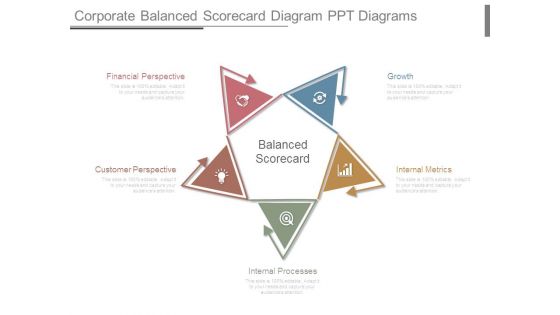
Corporate Balanced Scorecard Diagram Ppt Diagrams
This is a corporate balanced scorecard diagram ppt diagrams. This is a five stage process. The stages in this process are financial perspective, customer perspective, internal processes, growth, internal metrics, balanced scorecard.
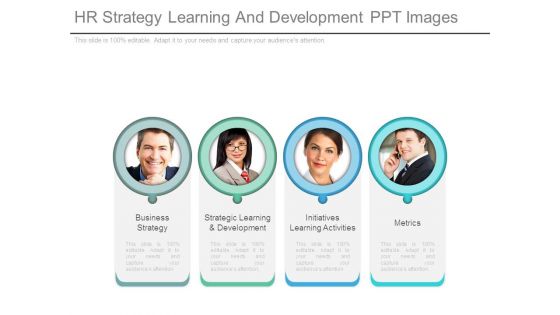
Hr Strategy Learning And Development Ppt Images
This is a hr strategy learning and development ppt images. This is a four stage process. The stages in this process are business strategy, strategic learning and development, initiatives learning activities, metrics.

Organizational Development Plan Ppt Slides Examples
This is a organizational development plan ppt slides examples. This is a five stage process. The stages in this process are strategy and commitment, discovery and knowledge, brand promise, brand scorecard metrics, brand execution.

Kips For Different Focus Areas Presentation Visuals
This is a kips for different focus areas presentation visuals. This is a four stage process. The stages in this process are area of focus, metrics, targets, objectives, invites, vision and strategy, focus.
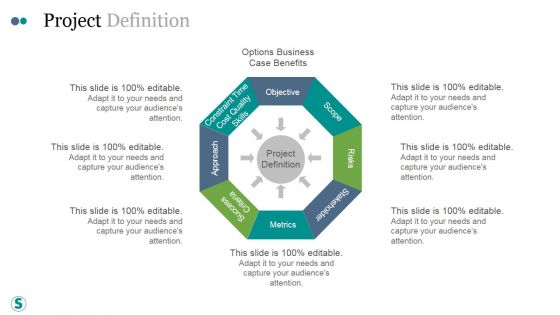
Project Definition Ppt PowerPoint Presentation Shapes
This is a project definition ppt powerpoint presentation shapes. This is a eight stage process. The stages in this process are constraint time cost quality skills, objective, scope, risks, stakeholder, success criteria, metrics, approach.
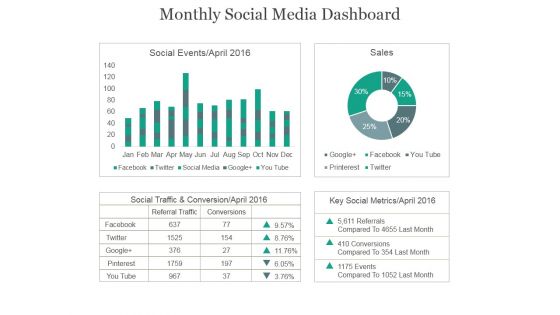
Monthly Social Media Dashboard Ppt PowerPoint Presentation Example 2015
This is a monthly social media dashboard ppt powerpoint presentation example 2015. This is a four stage process. The stages in this process are social events, sales, social traffic, conservation, key social metrics.
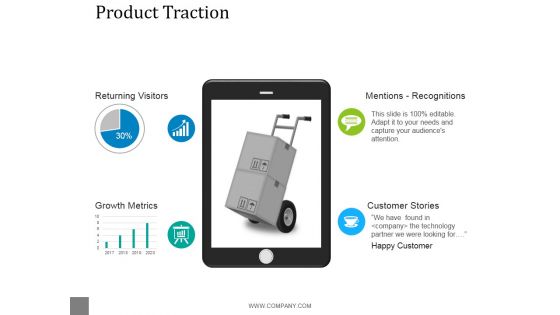
Product Traction Ppt PowerPoint Presentation Visual Aids
This is a product traction ppt powerpoint presentation visual aids. This is a four stage process. The stages in this process are returning visitors, mentions recognitions, growth metrics, customer stories.

Hr Dashboard Ppt PowerPoint Presentation Shapes
This is a hr dashboard ppt powerpoint presentation shapes. This is a four stage process. The stages in this process are total employees, key metrics, employee churn, open positions by divisions.
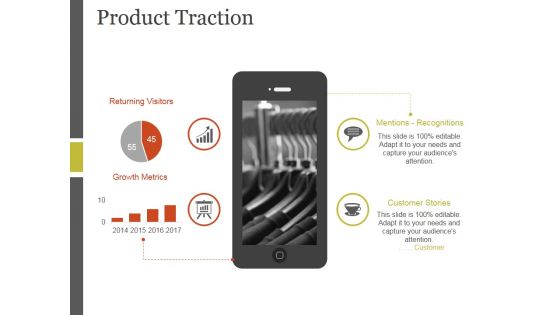
Product Traction Ppt PowerPoint Presentation Themes
This is a product traction ppt powerpoint presentation themes. This is a four stage process. The stages in this process are returning visitors, growth metrics, mentions recognitions, customer stories.
Monthly Social Media Dashboard Ppt PowerPoint Presentation Icon Gallery
This is a monthly social media dashboard ppt powerpoint presentation icon gallery. This is a two stage process. The stages in this process are facebook, social traffic and conversion, referral traffic, conversions, key social metrics, pinterest, you tube.

Hr Dashboard Template 2 Ppt PowerPoint Presentation Microsoft
This is a hr dashboard template 2 ppt powerpoint presentation microsoft. This is a four stage process. The stages in this process are open positions by divisions, key metrics, total employees, employee churn.

Hr Dashboard Template 1 Ppt PowerPoint Presentation Layouts Slideshow
This is a hr dashboard template 1 ppt powerpoint presentation layouts slideshow. This is a four stage process. The stages in this process are employee churn, key metrics, total employees, open positions by divisions.
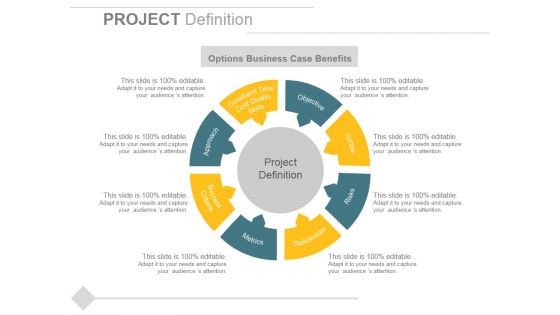
Project Definition Ppt PowerPoint Presentation Gallery Information
This is a project definition ppt powerpoint presentation gallery information. This is a eight stage process. The stages in this process are objective, scope, risks, stakeholder, metrics, approach, project definition.

Project Definition Ppt PowerPoint Presentation Layouts Examples
This is a project definition ppt powerpoint presentation layouts examples. This is a eight stage process. The stages in this process are options business case benefits, objective, scope, risks, stakeholder, metrics, success criteria.

Project Definition Ppt PowerPoint Presentation Styles Templates
This is a project definition ppt powerpoint presentation styles templates. This is a eight stage process. The stages in this objective, scope, risks, stakeholder, metrics, success criteria, approach, constraint time cost quality skills, project definition.

Marketing Strategy Template 1 Ppt PowerPoint Presentation Pictures Styles
This is a marketing strategy template 1 ppt powerpoint presentation pictures styles. This is a six stage process. The stages in this process are metrics, tactics, target message, target, target audience, strategy, big goals.

Marketing Strategy Template 2 Ppt PowerPoint Presentation Infographic Template Clipart Images
This is a marketing strategy template 2 ppt powerpoint presentation infographic template clipart images. This is a six stage process. The stages in this process are strategy, target message, metrics, big goals, target audience, tactics.

Hr Dashboard Template 1 Ppt PowerPoint Presentation Infographic Template Format Ideas
This is a hr dashboard template 1 ppt powerpoint presentation infographic template format ideas. This is a four stage process. The stages in this process are hr management dashboard, key metrics, employee churn, open positions by divisions, total employees.

Monthly Social Media Dashboard Ppt PowerPoint Presentation Model Slide
This is a monthly social media dashboard ppt powerpoint presentation model slide. This is a four stage process. The stages in this process are sales, social events, business, finance, key social metrics.

Marketing Strategy Ppt PowerPoint Presentation Infographics Background Images
This is a marketing strategy ppt powerpoint presentation infographics background images. This is a six stage process. The stages in this process are big goals, strategy, target audience, target message, tactics, metrics.

Marketing Strategy Template 2 Ppt PowerPoint Presentation Model Infographics
This is a marketing strategy template 2 ppt powerpoint presentation model infographics. This is a six stage process. The stages in this process are big goals, strategy, tactics, metrics, target message.

Deck Outline Ppt PowerPoint Presentation Summary
This is a deck outline ppt powerpoint presentation summary. This is a thirteen stage process. The stages in this process are segmentation, targeting audience, costing, key metrics, ca framework.
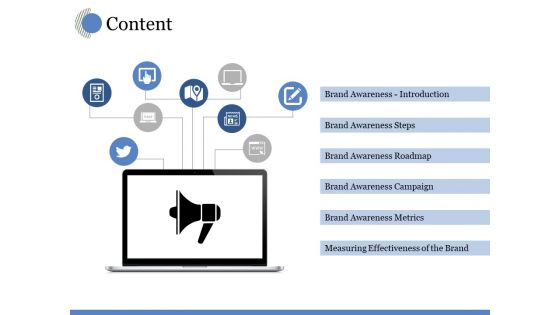
Content Ppt PowerPoint Presentation Inspiration Vector
This is a content ppt powerpoint presentation inspiration vector. This is a two stage process. The stages in this process are brand awareness introduction, brand awareness steps, brand awareness roadmap, brand awareness campaign, brand awareness metrics.
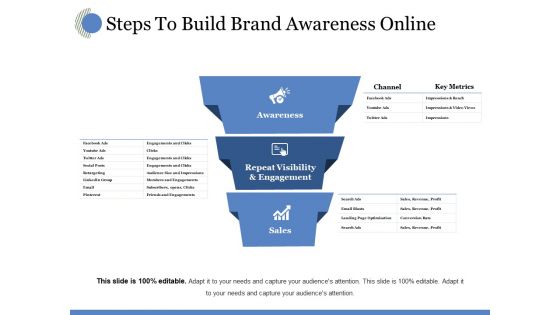
Steps To Build Brand Awareness Online Ppt PowerPoint Presentation Ideas Clipart
This is a steps to build brand awareness online ppt powerpoint presentation ideas clipart. This is a three stage process. The stages in this process are awareness, repeat visibility and engagement, sales, channel, key metrics.

Content Ppt PowerPoint Presentation Outline Graphics Design
This is a content ppt powerpoint presentation outline graphics design. This is a nine stage process. The stages in this process are brand awareness steps, brand awareness roadmap, brand awareness campaign, brand awareness metrics, brand awareness introduction.

Steps To Build Brand Awareness Online Ppt PowerPoint Presentation Portfolio Themes
This is a steps to build brand awareness online ppt powerpoint presentation portfolio themes. This is a three stage process. The stages in this process are awareness, repeat visibility and engagement, sales, channel, key metrics.

Project Closure Report Ppt PowerPoint Presentation File Templates
This is a project closure report ppt powerpoint presentation file templates. This is a six stage process. The stages in this process are project information, benefits, key metrics, project deliverables, controls in place, shortfalls.
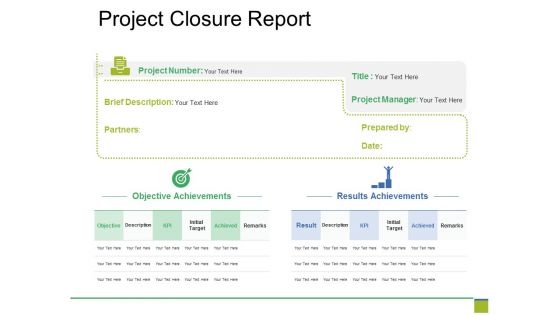
Project Closure Report Ppt PowerPoint Presentation Layouts Show
This is a project closure report ppt powerpoint presentation layouts show. This is a six stage process. The stages in this process are project information, benefits, key metrics, project deliverables, controls in place, shortfalls.
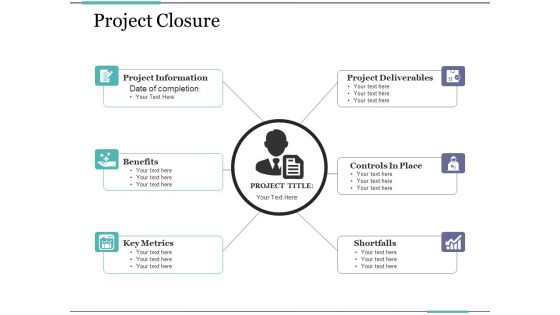
Project Closure Ppt PowerPoint Presentation Infographic Template Introduction
This is a project closure ppt powerpoint presentation infographic template introduction. This is a six stage process. The stages in this process are project information, benefits, key metrics, project deliverables, controls in place.
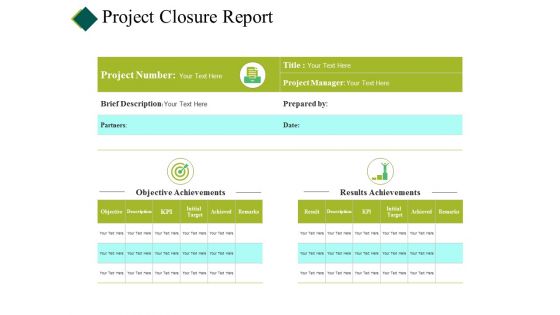
Project Closure Report Ppt PowerPoint Presentation Show Structure
This is a project closure report ppt powerpoint presentation show structure. This is a six stage process. The stages in this process are project information, project deliverables, benefits, controls in place, key metrics.

Project Closure Report Ppt PowerPoint Presentation Slides Portrait
This is a project closure report ppt powerpoint presentation slides portrait. This is a six stage process. The stages in this process are project information, project deliverables, benefits, key metrics, shortfalls, controls in place.

Demand Creation Process Ppt PowerPoint Presentation Design Templates
This is a demand creation process ppt powerpoint presentation design templates. This is a twelve stage process. The stages in this process are market sizing, metrics, sales tools, demand management, automation, offers, contacts.
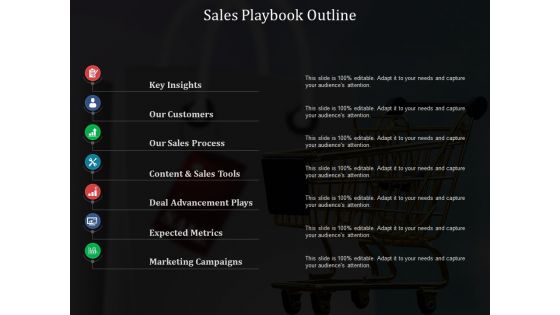
Sales Playbook Outline Ppt PowerPoint Presentation Layouts Infographic Template
This is a sales playbook outline ppt powerpoint presentation layouts infographic template. This is a seven stage process. The stages in this process are our customers, our sales process, content sales tools, expected metrics.

Sales Playbook Outline Ppt PowerPoint Presentation Summary Gallery
This is a sales playbook outline ppt powerpoint presentation summary gallery. This is a seven stage process. The stages in this process arekey insights, our sales process, marketing campaigns, our customers, expected metrics.

Key Financial Performance Indicators Cost Expenses Sales Profit Ppt Powerpoint Presentation Infographic Template Graphic Images
This is a key financial performance indicators cost expenses sales profit ppt powerpoint presentation infographic template graphic images. This is a six stage process. The stages in this process are dashboard, kpi, metrics.
Performance Indicators Of Business Icons Ppt Powerpoint Presentation Infographics Graphics Template
This is a performance indicators of business icons ppt powerpoint presentation infographics graphics template. This is a four stage process. The stages in this process are dashboard, kpi, metrics.
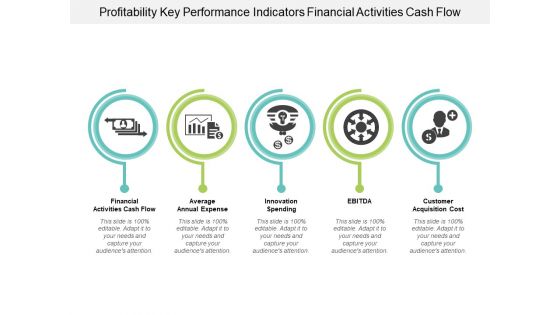
Profitability Key Performance Indicators Financial Activities Cash Flow Ppt Powerpoint Presentation Portfolio Clipart Images
This is a profitability key performance indicators financial activities cash flow ppt powerpoint presentation portfolio clipart images. This is a five stage process. The stages in this process are dashboard, kpi, metrics.
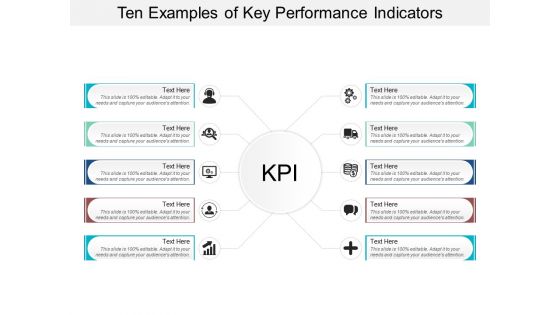
Ten Examples Of Key Performance Indicators Ppt Powerpoint Presentation Layouts Professional
This is a ten examples of key performance indicators ppt powerpoint presentation layouts professional. This is a ten stage process. The stages in this process are dashboard, kpi, metrics.

Bar Chart With Magnifying Glass For Financial Analysis Ppt Powerpoint Presentation Infographics Designs Download
This is a bar chart with magnifying glass for financial analysis ppt powerpoint presentation infographics designs download. This is a three stage process. The stages in this process are business metrics, business kpi, business dashboard.

Business Analysis Data Charts And Reports Ppt Powerpoint Presentation Ideas Portrait
This is a business analysis data charts and reports ppt powerpoint presentation ideas portrait. This is a three stage process. The stages in this process are business metrics, business kpi, business dashboard.
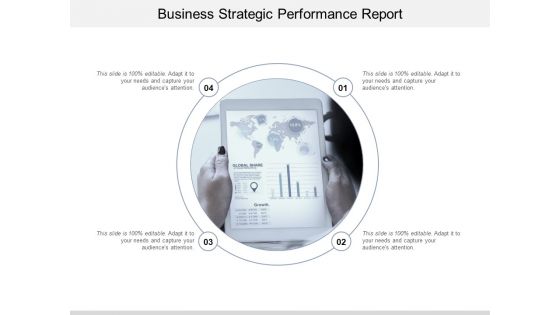
Business Strategic Performance Report Ppt Powerpoint Presentation Show Background Image
This is a business strategic performance report ppt powerpoint presentation show background image. This is a four stage process. The stages in this process are business metrics, business kpi, business dashboard.

Calculator With Business Reports For Operational Efficiency Ppt Powerpoint Presentation Ideas Infographic Template
This is a calculator with business reports for operational efficiency ppt powerpoint presentation ideas infographic template. This is a four stage process. The stages in this process are business metrics, business kpi, business dashboard.
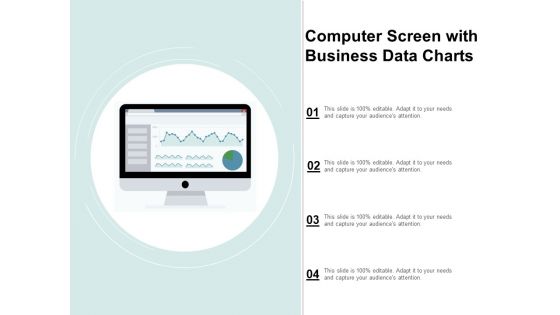
Computer Screen With Business Data Charts Ppt Powerpoint Presentation Show Vector
This is a computer screen with business data charts ppt powerpoint presentation show vector. This is a four stage process. The stages in this process are business metrics, business kpi, business dashboard.
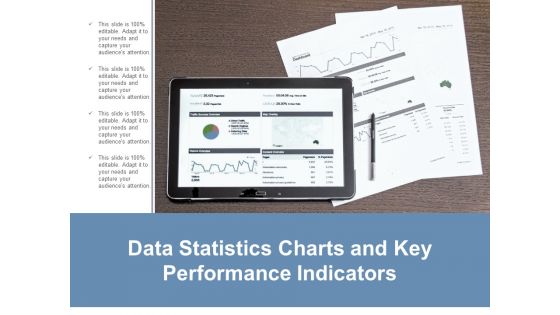
Data Statistics Charts And Key Performance Indicators Ppt Powerpoint Presentation Layouts Guide
This is a data statistics charts and key performance indicators ppt powerpoint presentation layouts guide. This is a four stage process. The stages in this process are business metrics, business kpi, business dashboard.

Essentials Of Statistics For Business And Economics Ppt Powerpoint Presentation Pictures Styles
This is a essentials of statistics for business and economics ppt powerpoint presentation pictures styles. This is a three stage process. The stages in this process are business metrics, business kpi, business dashboard.

Financial Charts And Graphs For Statistical Analysis Ppt Powerpoint Presentation Show Layout
This is a financial charts and graphs for statistical analysis ppt powerpoint presentation show layout. This is a four stage process. The stages in this process are business metrics, business kpi, business dashboard.
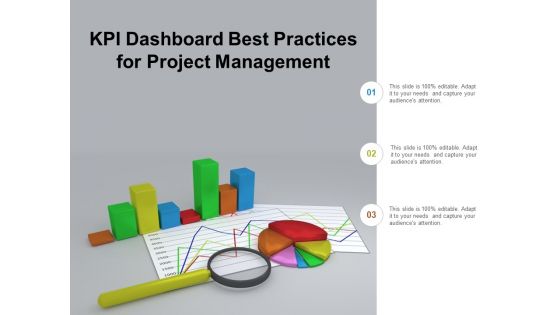
Kpi Dashboard Best Practices For Project Management Ppt Powerpoint Presentation Outline Samples
This is a kpi dashboard best practices for project management ppt powerpoint presentation outline samples. This is a three stage process. The stages in this process are business metrics, business kpi, business dashboard.

Kpi Management Through Dashboard Reporting Ppt Powerpoint Presentation Layouts Slides
This is a kpi management through dashboard reporting ppt powerpoint presentation layouts slides. This is a four stage process. The stages in this process are business metrics, business kpi, business dashboard.
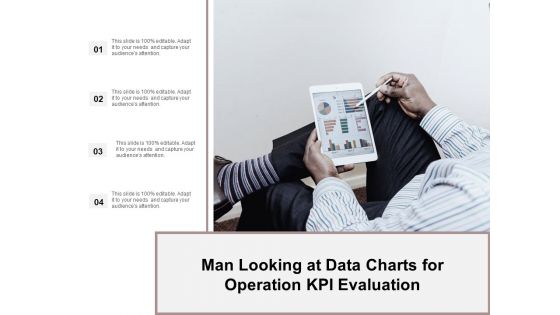
Man Looking At Data Charts For Operation Kpi Evaluation Ppt Powerpoint Presentation Ideas Demonstration
This is a man looking at data charts for operation kpi evaluation ppt powerpoint presentation ideas demonstration. This is a four stage process. The stages in this process are business metrics, business kpi, business dashboard.

 Home
Home