Metrics

Quarterly Company Revenue Summary With Key Information Slides PDF
This slide displays quarterly revenue report for EdTech company from different categories of consumers. It includes various client segments such as consumers, enterprises, degrees, key business metrics, etc.
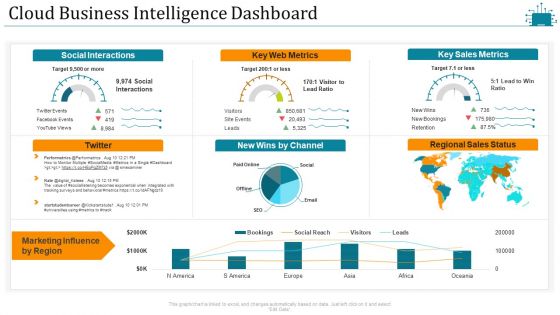
Cloud Intelligence Framework For Application Consumption Cloud Business Intelligence Dashboard Slides PDF
Deliver an awe inspiring pitch with this creative cloud intelligence framework for application consumption cloud business intelligence dashboard slides pdf bundle. Topics like social interactions, key web metrics, key sales metrics, marketing influence by region can be discussed with this completely editable template. It is available for immediate download depending on the needs and requirements of the user.
Customer Attrition In A Bpo - Dashboard Icons PDF
Deliver an awe-inspiring pitch with this creative customer attrition in a bpo - dashboard icons pdf. bundle. Topics like web chart performance, telecom churn overview metrics, customer care call performance, telecom churn overview metrics, monthly revenue lost can be discussed with this completely editable template. It is available for immediate download depending on the needs and requirements of the user.
Strengthen Customer Relation Overall Brand Performance Tracking Dashboard Portrait PDF
This slide provides information regarding brand performance tracking dashboard capturing KPIs such as brand metric, brand commitment, advertising metrics, and purchase metrics. Find a pre-designed and impeccable Strengthen Customer Relation Overall Brand Performance Tracking Dashboard Portrait PDF. The templates can ace your presentation without additional effort. You can download these easy-to-edit presentation templates to make your presentation stand out from others. So, what are you waiting for Download the template from Slidegeeks today and give a unique touch to your presentation.
Defensive Brand Marketing Overall Brand Performance Tracking Dashboard Ideas PDF
This slide provides information regarding brand performance tracking dashboard capturing KPIs such as brand metric, brand commitment, advertising metrics, and purchase metrics. There are so many reasons you need a Defensive Brand Marketing Overall Brand Performance Tracking Dashboard Ideas PDF. The first reason is you cant spend time making everything from scratch, Thus, Slidegeeks has made presentation templates for you too. You can easily download these templates from our website easily.

Approaches To Measure Brand Equity Development On Customer Model Diagrams PDF
The following slide showcase the major approaches to measuring the brand equity model which includes the brand evaluation, brand strength, output and competitive metrics. Presenting Approaches To Measure Brand Equity Development On Customer Model Diagrams PDF to dispense important information. This template comprises four stages. It also presents valuable insights into the topics including Brand Evaluation, Brand Strength, Competitive Metrics, Output Metrics. This is a completely customizable PowerPoint theme that can be put to use immediately. So, download it and address the topic impactfully.
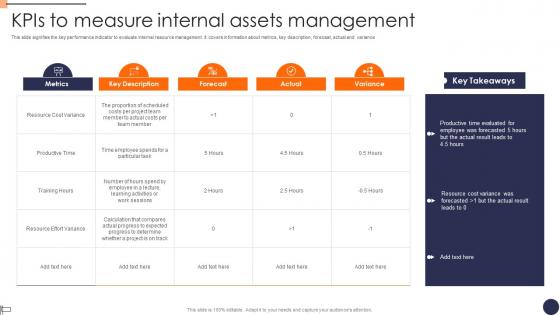
Kpis To Measure Internal Assets Management Diagrams Pdf
This slide signifies the key performance indicator to evaluate internal resource management. It covers information about metrics, key description, forecast, actual and variance. Pitch your topic with ease and precision using this Kpis To Measure Internal Assets Management Diagrams Pdf. This layout presents information on About Metrics, Key Description, Forecast. It is also available for immediate download and adjustment. So, changes can be made in the color, design, graphics or any other component to create a unique layout.
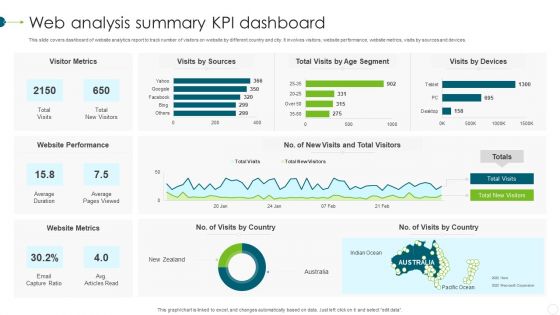
Web Analysis Summary KPI Dashboard Template PDF
This slide covers dashboard of website analytics report to track number of visitors on website by different country and city. It involves visitors, website performance, website metrics, visits by sources and devices. Showcasing this set of slides titled Web Analysis Summary KPI Dashboard Template PDF. The topics addressed in these templates are Website Metrics, Website Performance, Visitor Metrics. All the content presented in this PPT design is completely editable. Download it and make adjustments in color, background, font etc. as per your unique business setting.
Digital Marketing Dashboard For Tracking Lead Generation Guidelines PDF
This slide showcases dashboard for digital marketing that can help organization track the monthly leads generated and performance of online marketing campaigns. Its key components are lead breakdown, total lead by program, web traffic targets, key conversion metrics, trial leads by region, total social media channels and key conversion metrics. Showcasing this set of slides titled Digital Marketing Dashboard For Tracking Lead Generation Guidelines PDF. The topics addressed in these templates are Lead By Program, Lead Breakdown, Key Conversion Metrics. All the content presented in this PPT design is completely editable. Download it and make adjustments in color, background, font etc. as per your unique business setting.
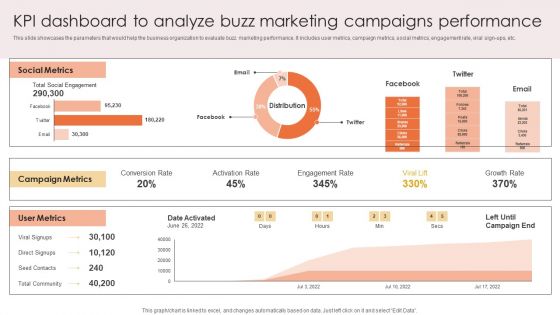
Kpi Dashboard To Analyze Buzz Marketing Campaigns Performance Download PDF
This slide showcases the parameters that would help the business organization to evaluate buzz marketing performance. It includes user metrics, campaign metrics, social metrics, engagement rate, viral sign-ups, etc. Take your projects to the next level with our ultimate collection of Kpi Dashboard To Analyze Buzz Marketing Campaigns Performance Download PDF. Slidegeeks has designed a range of layouts that are perfect for representing task or activity duration, keeping track of all your deadlines at a glance. Tailor these designs to your exact needs and give them a truly corporate look with your own brand colors they will make your projects stand out from the rest.
Sales Order Processing Performance Tracking Indicators Graphics PDF
The following slide showcases key performance indicators for sales order fulfilment to meet customer expectations, specifications, deliver goods on time, compare order fulfilment against past orders. It includes elements such as category, key performance indicators, expected rate and actual rate. Showcasing this set of slides titled Sales Order Processing Performance Tracking Indicators Graphics PDF. The topics addressed in these templates are Customer Metrics, Inbound Metrics, Financial Metrics. All the content presented in this PPT design is completely editable. Download it and make adjustments in color, background, font etc. as per your unique business setting.

Evaluation Of Natural Language Generation Models Natural Language Automation
This slide illustrates how Natural Language Generation models are assessed. The purpose of this slide is to showcase the various methods and parameters to evaluate NLG models, including black box evaluation, glass box evaluation, accuracy, fluency, word-based metrics, grammar-based metrics, and semantic similarity metrics. Make sure to capture your audiences attention in your business displays with our gratis customizable Evaluation Of Natural Language Generation Models Natural Language Automation. These are great for business strategies, office conferences, capital raising or task suggestions. If you desire to acquire more customers for your tech business and ensure they stay satisfied, create your own sales presentation with these plain slides.

Evaluation Of Natural Language Automated Content Generation PPT Sample
This slide illustrates how Natural Language Generation models are assessed. The purpose of this slide is to showcase the various methods and parameters to evaluate NLG models, including black box evaluation, glass box evaluation, accuracy, fluency, word-based metrics, grammar-based metrics, and semantic similarity metrics. Make sure to capture your audiences attention in your business displays with our gratis customizable Evaluation Of Natural Language Automated Content Generation PPT Sample. These are great for business strategies, office conferences, capital raising or task suggestions. If you desire to acquire more customers for your tech business and ensure they stay satisfied, create your own sales presentation with these plain slides.
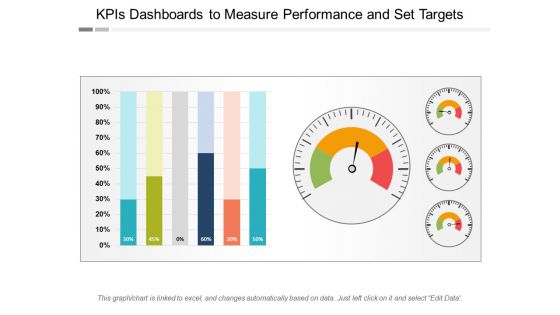
Kpis Dashboards To Measure Performance And Set Targets Ppt PowerPoint Presentation Gallery Visual Aids
This is a kpis dashboards to measure performance and set targets ppt powerpoint presentation gallery visual aids. This is a four stage process. The stages in this process are project dashboard, project kpis, project metrics.

Organization Level Kpis Diagram Powerpoint Layout
This is a organization level kpis diagram powerpoint layout. This is a nine stage process. The stages in this process are goals and objectives, critical success, factors, kpis, metrics, measures, corporate, financials, tactical functional.
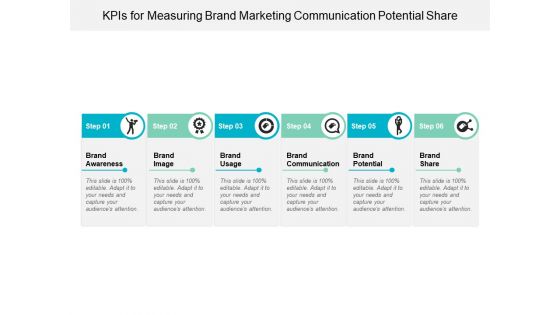
Kpis For Measuring Brand Marketing Communication Potential Share Ppt Powerpoint Presentation Layouts Infographics
This is a kpis for measuring brand marketing communication potential share ppt powerpoint presentation layouts infographics. This is a six stage process. The stages in this process are dashboard, kpi, metrics.

Marketing Performance Measurement And Management Example Of Ppt
This is a marketing performance measurement and management example of ppt. This is a two stage process. The stages in this process are business, technology, critical success factors, goals and objectives, kpis, metrics, measures.

Cost Effectiveness And Productivity Kpis Ppt Powerpoint Presentation Portfolio Demonstration
This is a cost effectiveness and productivity kpis ppt powerpoint presentation portfolio demonstration. This is a two stage process. The stages in this process are availability kpi, availability dashboard, availability metrics.
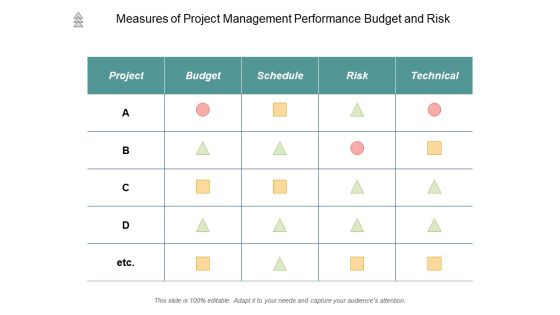
Measures Of Project Management Performance Budget And Risk Ppt PowerPoint Presentation Outline Graphics Design
This is a measures of project management performance budget and risk ppt powerpoint presentation outline graphics design. This is a four stage process. The stages in this process are project dashboard, project kpis, project metrics.
Measures Of Project Management Performance Quality Actions Time Cost Ppt PowerPoint Presentation Styles Icons
This is a measures of project management performance quality actions time cost ppt powerpoint presentation styles icons. This is a six stage process. The stages in this process are project dashboard, project kpis, project metrics.
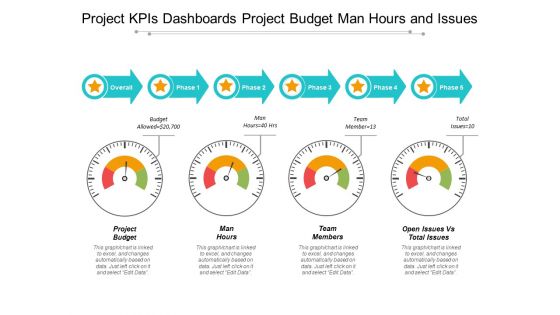
Project Kpis Dashboards Project Budget Man Hours And Issues Ppt PowerPoint Presentation Professional Design Inspiration
This is a project kpis dashboards project budget man hours and issues ppt powerpoint presentation professional design inspiration. This is a four stage process. The stages in this process are project dashboard, project kpis, project metrics.

Customer Retention Kpis Lifetime Value And Acquisition Cost Ppt Powerpoint Presentation Model Samples
This is a customer retention kpis lifetime value and acquisition cost ppt powerpoint presentation model samples. This is a five stage process. The stages in this process are dashboard, kpi, metrics.

Customer Service Kpis Satisfied Customers And Churn Rate Ppt Powerpoint Presentation Pictures Template
This is a customer service kpis satisfied customers and churn rate ppt powerpoint presentation pictures template. This is a four stage process. The stages in this process are dashboard, kpi, metrics.
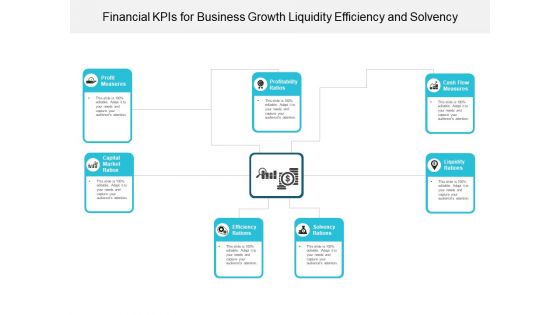
Financial Kpis For Business Growth Liquidity Efficiency And Solvency Ppt Powerpoint Presentation Summary Gridlines
This is a financial kpis for business growth liquidity efficiency and solvency ppt powerpoint presentation summary gridlines. This is a seven stage process. The stages in this process are dashboard, kpi, metrics.
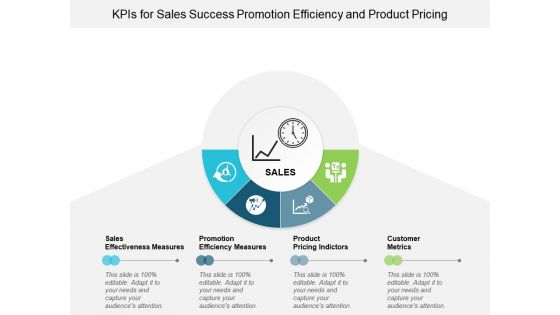
Kpis For Sales Success Promotion Efficiency And Product Pricing Ppt Powerpoint Presentation Infographics Background Images
This is a kpis for sales success promotion efficiency and product pricing ppt powerpoint presentation infographics background images. This is a four stage process. The stages in this process are dashboard, kpi, metrics.

Kpis In Sales And Marketing Conversion Rates And Customer Value Ppt Powerpoint Presentation File Information
This is a kpis in sales and marketing conversion rates and customer value ppt powerpoint presentation file information. This is a ten stage process. The stages in this process are dashboard, kpi, metrics.
Measure Performance And Set Targets Ppt Powerpoint Presentation Gallery Guidelines
This is a measure performance and set targets ppt powerpoint presentation gallery guidelines. This is a three stage process. The stages in this process are business metrics, business kpi, business dashboard.
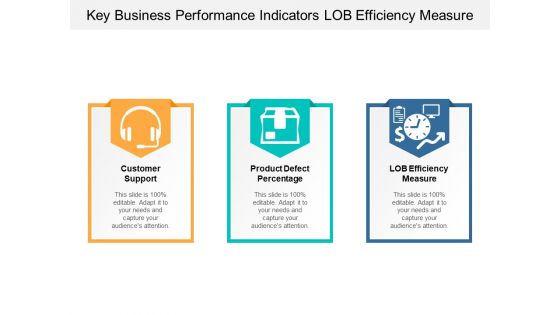
Key Business Performance Indicators Lob Efficiency Measure Ppt Powerpoint Presentation Infographics File Formats
This is a key business performance indicators lob efficiency measure ppt powerpoint presentation infographics file formats. This is a three stage process. The stages in this process are dashboard, kpi, metrics.

Four Steps Of Project Performance Scope Of Work Quality And Satisfaction Ppt PowerPoint Presentation Infographic Template Pictures
This is a four steps of project performance scope of work quality and satisfaction ppt powerpoint presentation infographic template pictures. This is a five stage process. The stages in this process are project dashboard, project kpis, project metrics.
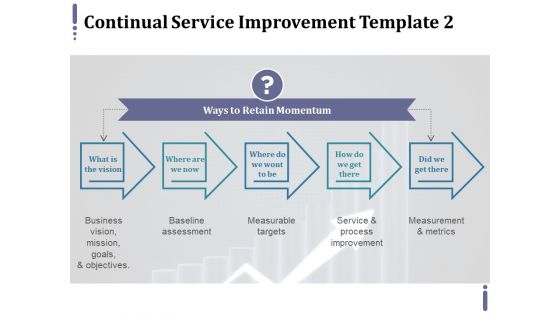
Continual Service Improvement Template 2 Ppt PowerPoint Presentation File Objects
This is a continual service improvement template 2 ppt powerpoint presentation file objects. This is a five stage process. The stages in this process are baseline assessment, measurable targets, measurement and metrics, service and process improvement.

Benchmarking For Best Practices Presentation Slides
This is a benchmarking for best practices presentation slides. This is a six stage process. The stages in this process are metrics, benchmark performance, operational excellence, validate and improve, strategic objectives, measure.

Social Marketing Success Strategy Diagram Presentation Portfolio
This is a social marketing success strategy diagram presentation portfolio. This is a five stage process. The stages in this process are start with a plan, measure metrics, social media, tag news, community.
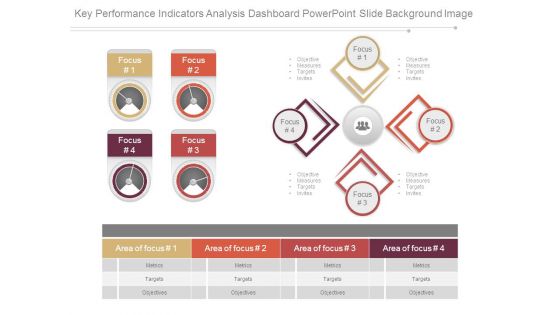
Key Performance Indicators Analysis Dashboard Powerpoint Slide Background Image
This is a key performance indicators analysis dashboard powerpoint slide background image. This is a four stage process. The stages in this process are focus, objective measures targets invites, area of focus, metrics, targets, objectives.
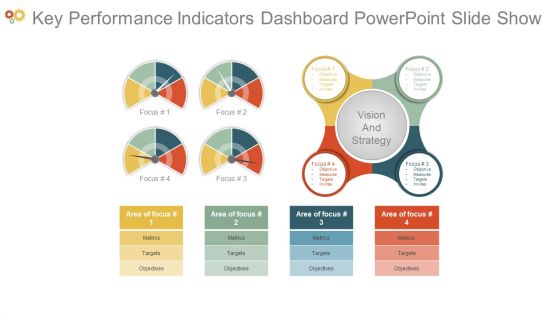
Key Performance Indicators Dashboard Powerpoint Slide Show
This is a key performance indicators dashboard powerpoint slide show. This is a four stage process. The stages in this process are focus, objective, measures, targets, invites, vision and strategy, area of focus, metrics, objectives.

Key Performance Indicators For Area Of Focus Powerpoint Slide Backgrounds
This is a key performance indicators for area of focus powerpoint slide backgrounds. This is a four stage process. The stages in this process are area of focus, metrics, targets, objectives, focus, measures, invites, vision and strategy.

Business Process Performance Indicators Ppt Slide Design
This is a business process performance indicators ppt slide design. This is a four stage process. The stages in this process are focus, objective, measures, targets, invites, vision and strategy, area of focus, metrics, targets, objectives.
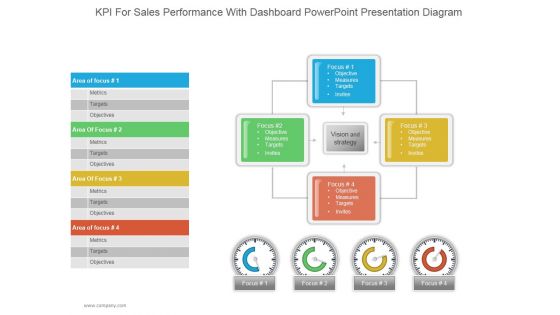
Kpi For Sales Performance With Dashboard Ppt PowerPoint Presentation Information
This is a kpi kpi for sales performance with dashboard ppt powerpoint presentation information. This is a four stage process. The stages in this process are metrics, targets, objectives, measures, targets, invites.

Venn Ppt PowerPoint Presentation Guidelines
This is a venn ppt powerpoint presentation guidelines. This is a two stage process. The stages in this process are critical success factors, business, technology, goals and objectives, measures, metrics.
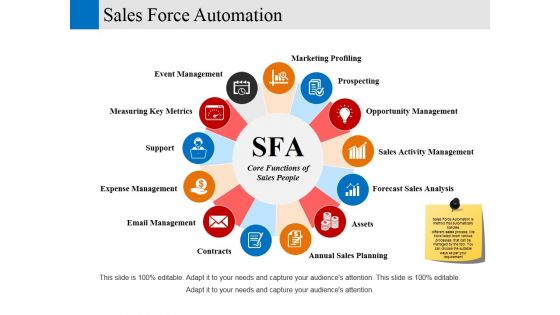
Sales Force Automation Ppt PowerPoint Presentation Gallery Influencers
This is a sales force automation ppt powerpoint presentation gallery influencers. This is a thirteen stage process. The stages in this process are event management, measuring key metrics, support, expense management, email management.
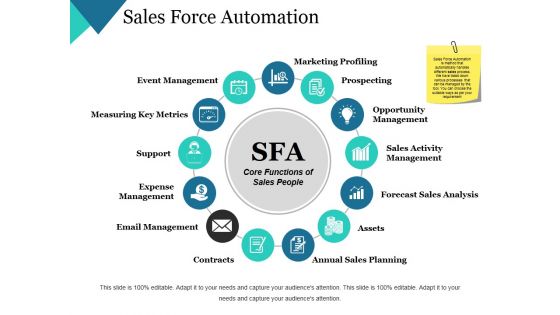
Sales Force Automation Ppt PowerPoint Presentation Professional Mockup
This is a sales force automation ppt powerpoint presentation professional mockup. This is a thirteen stage process. The stages in this process are event management, measuring key metrics, support, expense management, email management.
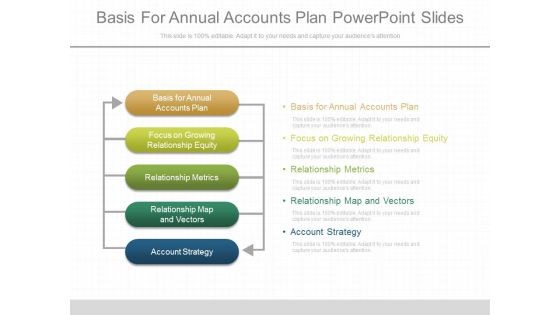
Basis For Annual Accounts Plan Powerpoint Slides
This is a basis for annual accounts plan powerpoint slides. This is a five stage process. The stages in this process are basis for annual accounts plan, focus on growing relationship equity, relationship metrics, relationship map and vectors, account strategy.

Targeted Customer Cost Structure Ppt Sample File
This is a targeted customer cost structure ppt sample file. This is a seven stage process. The stages in this process are life time value, customer segments, targeted customer, key metrics, key activity, cost structure, gross margin.

Sales Territory Strategy Plan Ppt Slide Examples
This is a sales territory strategy plan ppt slide examples. This is a six stage process. The stages in this process are sales knowledge, skills art, science metrics, sales strategy, market knowledge, company knowledge.
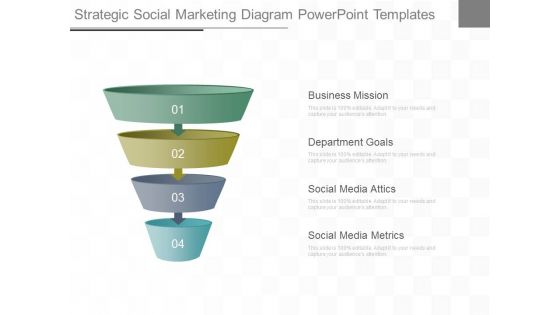
Strategic Social Marketing Diagram Powerpoint Templates
This is a strategic social marketing diagram powerpoint templates. This is a four stage process. The stages in this process are business mission, department goals, social media attics, social media metrics.
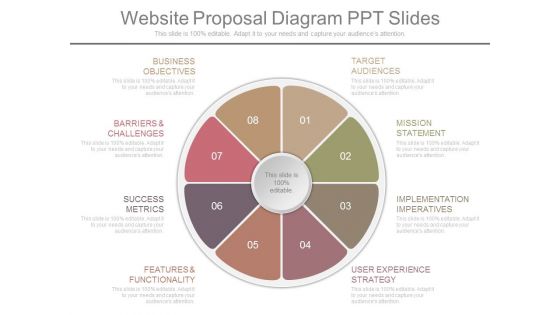
Website Proposal Diagram Ppt Slides
This is a website proposal diagram ppt slides. This is a eight stage process. The stages in this process are business objectives, barriers and challenges, success metrics, features and functionality, user experience strategy, implementation imperatives, mission statement, target audiences.

Seo Marketing Strategy Powerpoint Slide Clipart
This is a seo marketing strategy powerpoint slide clipart. This is a five stage process. The stages in this process are seo marketing strategy, competitive analysis, marketing metrics, evaluate and refine performance, develop quality content.
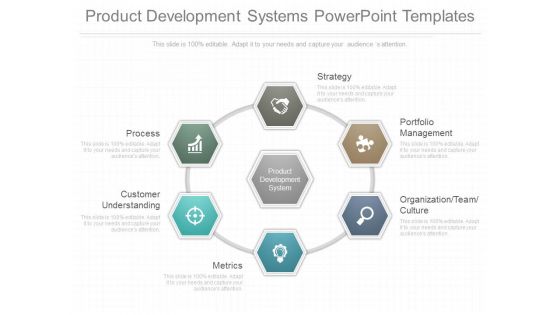
Product Development Systems Powerpoint Templates
This is a product development systems powerpoint templates. This is a seven stage process. The stages in this process are process, customer understanding, metrics, organization team culture, portfolio management, strategy.
Voice Of The Customer Six Sigma Diagram Ppt Images
This is a voice of the customer six sigma diagram ppt images. This is a five stage process. The stages in this process are groups, warranty, metrics, data returns, survey, voice of customer.

Email Marketing Performance Benchmarks Ppt Presentation Examples
This is a email marketing performance benchmarks ppt presentation examples. This is a four stage process. The stages in this process are process background, final notes q and a, what to do, review of selected metrics, agenda.
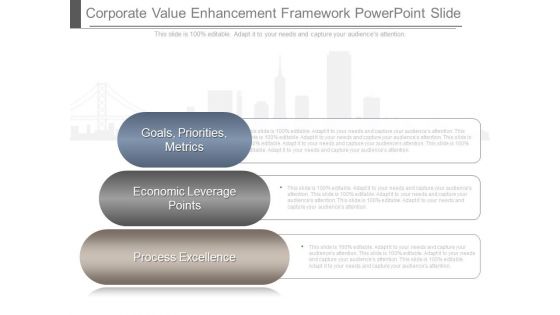
Corporate Value Enhancement Framework Powerpoint Slide
This is a corporate value enhancement framework powerpoint slide. This is a three stage process. The stages in this process are goals, priorities, metrics, economic leverage points, process excellence.
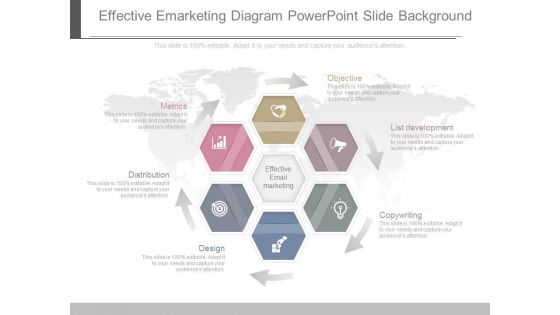
Effective Emarketing Diagram Powerpoint Slide Background
This is a effective emarketing diagram powerpoint slide background. This is a six stage process. The stages in this process are metrics, distribution, design, copywriting, list development, objective, effective email marketing.\n\n\n\n\n\n\n\n\n\n\n\n\n\n\n\n\n\n
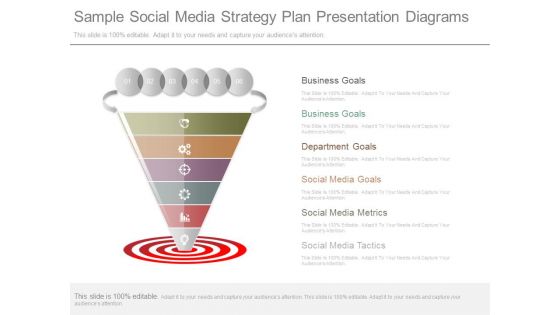
Sample Social Media Strategy Plan Presentation Diagrams
This is a sample social media strategy plan presentation diagrams. This is a six stage process. The stages in this process are business goals, department goals, social media goals, social media metrics, social media tactics.

Managing Sales Activities And Results Ppt Inspiration
This is a managing sales activities and results ppt inspiration. This is a four stage process. The stages in this process are define key metrics, manage performance, refine sales accountability system, dissect buying, selling process, science of sales management.

Service Business Plan Example Powerpoint Ideas
This is a service business plan example powerpoint ideas. This is a nine stage process. The stages in this process are business plan, product or service, marketing plan, financial plan, key management, focused strategy, investors, metrics.
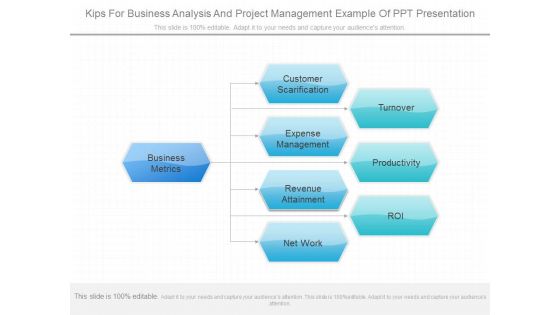
Kips For Business Analysis And Project Management Example Of Ppt Presentation
This is a kips for business analysis and project management example of ppt presentation. This is a eight stage process. The stages in this process are business metrics, customer scarification, expense management, revenue attainment, net work, turnover, productivity, roi.
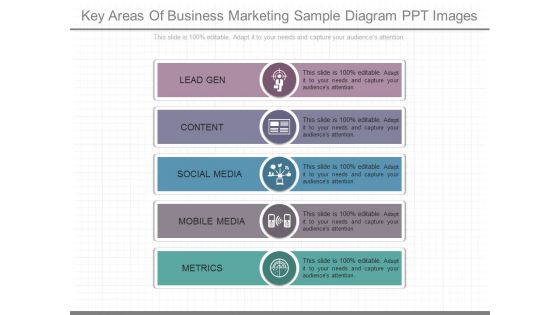
Key Areas Of Business Marketing Sample Diagram Ppt Images
This is a key areas of business marketing sample diagram ppt images. This is a five stage process. The stages in this process are lead gen, content, social media, mobile media, metrics.

Program Management Framework Ppt Powerpoint Slide Graphics
This is a program management framework ppt powerpoint slide graphics. This is a five stage process. The stages in this process are resources, schedule, scope, organizing concept, program plan, plan track report, program metrics, supporting business processes.
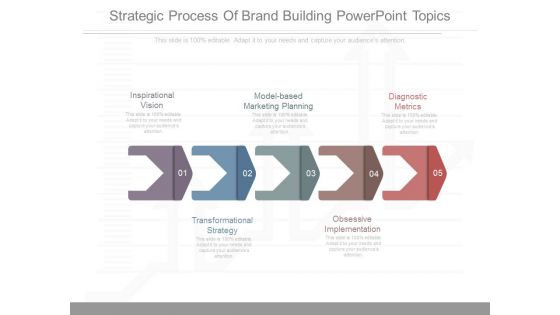
Strategic Process Of Brand Building Powerpoint Topics
This is a strategic process of brand building powerpoint topics. This is a five stage process. The stages in this process are inspirational vision, model based marketing planning, diagnostic metrics, transformational strategy, obsessive implementation.

Key Performance Indicators Powerpoint Slides Background
This is a key performance indicators powerpoint slides background. This is a five stage process. The stages in this process are overall business strategy, goals, objectives, key business drivers, key performance indicators, supporting metrics.

Data Driven Web Site Progressive Enhancement Sample Diagram Powerpoint Templates
This is a data driven web site progressive enhancement sample diagram powerpoint templates. This is a four stage process. The stages in this process are act, experiment, hypothesis, metrics.

 Home
Home