Key Performance Indicators

Business Departments Performance Metrics Ppt Slides
This is a business departments performance metrics ppt slides. This is a seven stage process. The stages in this process are engineering, construction, maintenance, operations, safety, finance, environment.

Performance Snapshot Of 2022 One Pager Documents
Presenting you an exemplary Performance Snapshot Of 2022 One Pager Documents. Our one-pager comprises all the must-have essentials of an inclusive document. You can edit it with ease, as its layout is completely editable. With such freedom, you can tweak its design and other elements to your requirements. Download this Performance Snapshot Of 2022 One Pager Documents brilliant piece now.
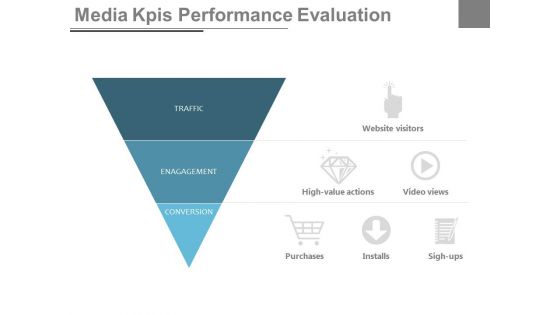
Media Kpis Performance Evaluation Ppt Slides
This is a media KPIs performance evaluation ppt slides. This is a one stage process. The stages in this process are media, business, success marketing.

Sales Performance Ppt PowerPoint Presentation Summary Influencers
This is a sales performance ppt powerpoint presentation summary influencers. This is a six stage process. The stages in this process are sales performance dashboard, sales by region, sales revenue by product, sales kpi performance matrix, quarterly sales review.

Performance Management Kpi Example Ppt Presentation
This is a performance management kpi example ppt presentation. This is a eight stage process. The stages in this process are revise long term plan, strategy objectives, update scorecard with kpi, set budget, forecast, monitor and report, analysis performance, adjust forecast.

Nanorobotics Performance Measuring And Monitoring PPT Slides
This slide showcases the performance tracking dashboard for nanorobotics. The purpose of this slide is to highlight the performance of nanorobots by including components such as top three applications, users and so on. Boost your pitch with our creative Nanorobotics Performance Measuring And Monitoring PPT Slides. Deliver an awe-inspiring pitch that will mesmerize everyone. Using these presentation templates you will surely catch everyones attention. You can browse the ppts collection on our website. We have researchers who are experts at creating the right content for the templates. So you do not have to invest time in any additional work. Just grab the template now and use them.
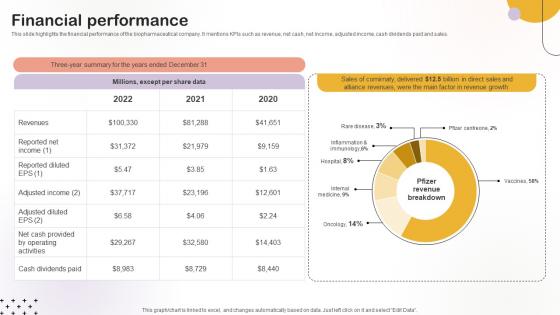
Financial Performance Medical Research Organization Pitch Deck
This slide highlights the financial performance of the biopharmaceutical company. It mentions KPIs such as revenue, net cash, net income, adjusted income, cash dividends paid and sales.From laying roadmaps to briefing everything in detail, our templates are perfect for you. You can set the stage with your presentation slides. All you have to do is download these easy-to-edit and customizable templates. Financial Performance Medical Research Organization Pitch Deck will help you deliver an outstanding performance that everyone would remember and praise you for. Do download this presentation today.
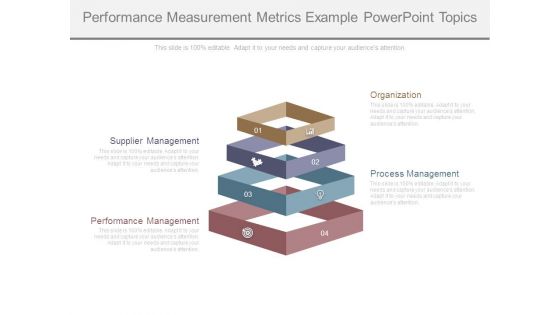
Performance Measurement Metrics Example Powerpoint Topics
This is a performance measurement metrics example powerpoint topics. This is a four stage process. The stages in this process are organization, supplier management, process management, performance management.

Financial Performance Biopharma Research Organization Pitch Deck
This slide highlights the financial performance of the biopharmaceutical company. It highlights KPIs such as EV, revenue, EBITDA, net income, total assets, and total debt. Present like a pro with Financial Performance Biopharma Research Organization Pitch Deck. Create beautiful presentations together with your team, using our easy-to-use presentation slides. Share your ideas in real-time and make changes on the fly by downloading our templates. So whether you are in the office, on the go, or in a remote location, you can stay in sync with your team and present your ideas with confidence. With Slidegeeks presentation got a whole lot easier. Grab these presentations today.
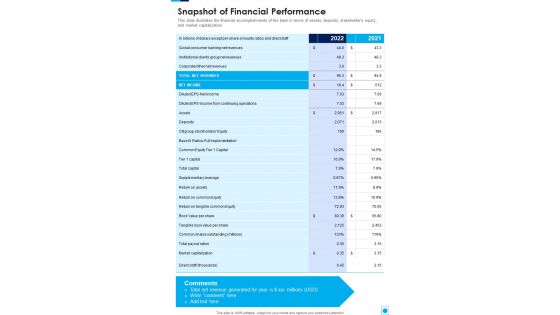
Snapshot Of Financial Performance One Pager Documents
This slide illustrates the financial accomplishments of the bank in terms of assets, deposits, stakeholders equity, and market capitalization. Presenting you a fantastic Snapshot Of Financial Performance One Pager Documents. This piece is crafted on hours of research and professional design efforts to ensure you have the best resource. It is completely editable and its design allow you to rehash its elements to suit your needs. Get this Snapshot Of Financial Performance One Pager Documents A4 One-pager now.
Team Performance Kpi Tracker Powerpoint Slide Templates
This is a team performance kpi tracker powerpoint slide templates. This is a eight stage process. The stages in this process are successful, no answer, call busy, disconnected, wrong number, unavailable, disconnected, demo booked.
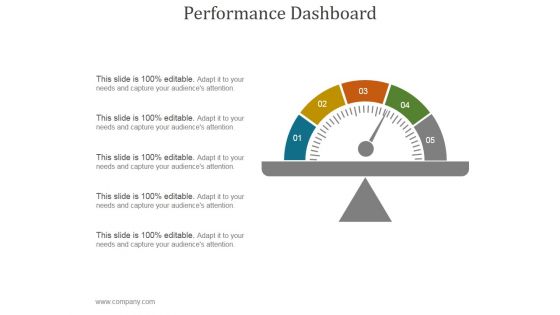
Performance Dashboard Ppt PowerPoint Presentation Background Designs
This is a performance dashboard ppt powerpoint presentation background designs. This is a one stage process. The stages in this process are performance, management, marketing, strategy, business.
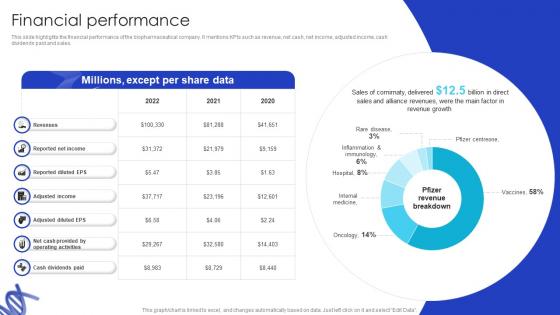
Financial Performance Biotech Firm Pitch Deck
This slide highlights the financial performance of the biopharmaceutical company. It mentions KPIs such as revenue, net cash, net income, adjusted income, cash dividends paid and sales. Present like a pro with Financial Performance Biotech Firm Pitch Deck. Create beautiful presentations together with your team, using our easy-to-use presentation slides. Share your ideas in real-time and make changes on the fly by downloading our templates. So whether you are in the office, on the go, or in a remote location, you can stay in sync with your team and present your ideas with confidence. With Slidegeeks presentation got a whole lot easier. Grab these presentations today.

Application Security Performance Monitoring Application Security Testing
This slide showcases the performance tracking dashboard for application security to analyze and monitor security of application. Want to ace your presentation in front of a live audience Our Application Security Performance Monitoring Application Security Testing can help you do that by engaging all the users towards you. Slidegeeks experts have put their efforts and expertise into creating these impeccable powerpoint presentations so that you can communicate your ideas clearly. Moreover, all the templates are customizable, and easy-to-edit and downloadable. Use these for both personal and commercial use.
Maintenance Performance Metrics Dashboard Icon Inspiration PDF
Presenting Maintenance Performance Metrics Dashboard Icon Inspiration PDF to dispense important information. This template comprises three stages. It also presents valuable insights into the topics including Maintenance Performance, Metrics Dashboard Icon. This is a completely customizable PowerPoint theme that can be put to use immediately. So, download it and address the topic impactfully.

Dashboard Performance Analysis Chart Powerpoint Slides
This PowerPoint template graphics of meter chart. Download this PPT chart for business performance analysis. This PowerPoint slide is of great help in the business sector to make realistic presentations and provides effective way of presenting your newer thoughts.

Dashboard To Impact The Performance Powerpoint Slides
This PowerPoint template graphics of meter chart. Download this PPT chart for business performance analysis. This PowerPoint slide is of great help in the business sector to make realistic presentations and provides effective way of presenting your newer thoughts.
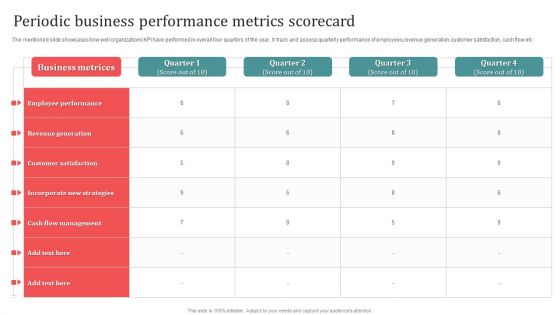
Periodic Business Performance Metrics Scorecard Ideas PDF
The mentioned slide showcases how well organizations KPI have performed in overall four quarters of the year. It track and assess quarterly performance of employees,revenue generation,customer satisfaction, cash flow etc. Pitch your topic with ease and precision using this Periodic Business Performance Metrics Scorecard Ideas PDF. This layout presents information on Employee Performance, Revenue Generation, Customer Satisfaction. It is also available for immediate download and adjustment. So, changes can be made in the color, design, graphics or any other component to create a unique layout.
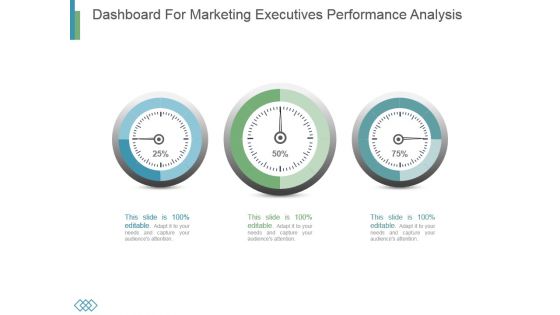
Dashboard For Marketing Executives Performance Analysis
This is a dashboard for marketing executives performance analysis. This is a three stage process. The stages in this process are business, marketing, dashboard, analysis, finance.
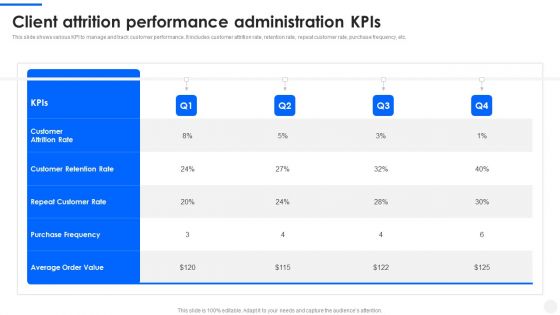
Client Attrition Performance Administration Kpis Topics PDF
This slide shows various KPI to manage and track customer performance. It includes customer attrition rate, retention rate, repeat customer rate, purchase frequency, etc. Pitch your topic with ease and precision using this Client Attrition Performance Administration Kpis Topics PDF. This layout presents information on Customer Retention Rate, Repeat Customer Rate, Purchase Frequency. It is also available for immediate download and adjustment. So, changes can be made in the color, design, graphics or any other component to create a unique layout.
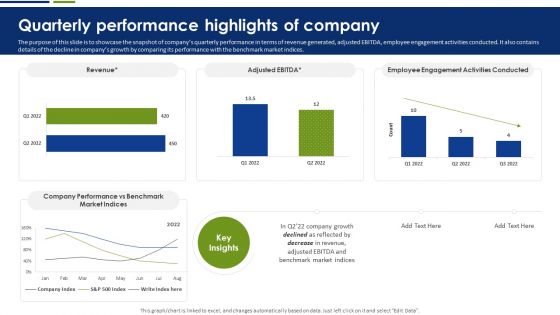
Quarterly Performance Highlights Of Company Brochure PDF
The purpose of this slide is to showcase the snapshot of companys quarterly performance in terms of revenue generated, adjusted EBITDA, employee engagement activities conducted. It also contains details of the decline in companys growth by comparing its performance with the benchmark market indices. This Quarterly Performance Highlights Of Company Brochure PDF is perfect for any presentation, be it in front of clients or colleagues. It is a versatile and stylish solution for organizing your meetings. The Quarterly Performance Highlights Of Company Brochure PDF features a modern design for your presentation meetings. The adjustable and customizable slides provide unlimited possibilities for acing up your presentation. Slidegeeks has done all the homework before launching the product for you. So, do not wait, grab the presentation templates today.

Sales Performance Ppt PowerPoint Presentation Infographics Visuals
This is a sales performance ppt powerpoint presentation infographics visuals. This is a six stage process. The stages in this process are sales by region, sales revenue by product, sales kpi performance matrix, quarterly sales review, sales budget vs actuals.
Dashboards For Measuring Business Performance Ppt Icon
This is a dashboards for measuring business performance ppt icon. This is a three stage process. The stages in this process are dashboard, measuring, management, speedometer, icons, strategy.
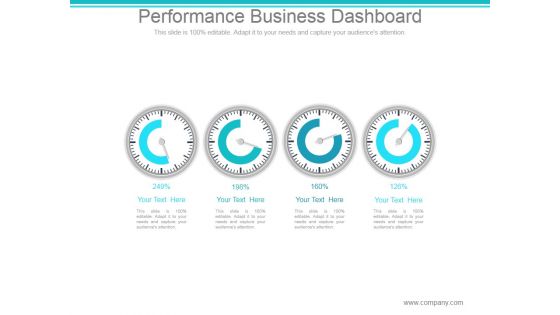
Performance Business Dashboard Ppt PowerPoint Presentation Visuals
This is a performance business dashboard ppt powerpoint presentation visuals. This is a four stage process. The stages in this process are dashboard, speedometer, report, business, marketing.
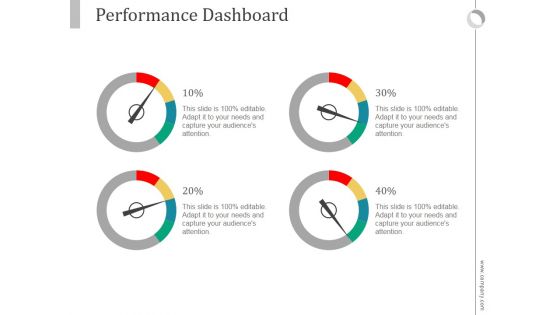
Performance Dashboard Ppt PowerPoint Presentation Background Image
This is a performance dashboard ppt powerpoint presentation background image. This is a four stage process. The stages in this process are business, marketing, management, dashboard, finance.

Performance Dashboard Ppt PowerPoint Presentation Template
This is a performance dashboard ppt powerpoint presentation template. This is a six stage process. The stages in this process are business, strategy, loop, process, dashboard.
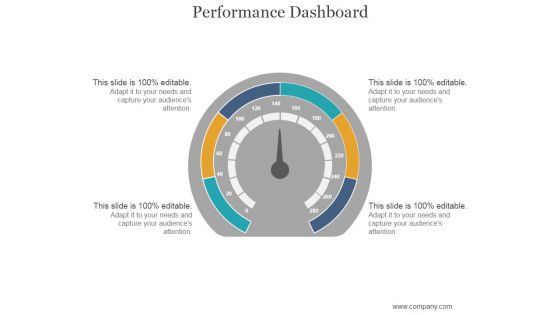
Performance Dashboard Ppt PowerPoint Presentation Show
This is a performance dashboard ppt powerpoint presentation show. This is a one stage process. The stages in this process are business, dashboard, measure, management, marketing.

Performance Dashboard Ppt PowerPoint Presentation Layouts Styles
This is a performance dashboard ppt powerpoint presentation layouts styles. This is a five stage process. The stages in this process are process, measurement, dashboard, business, marketing.
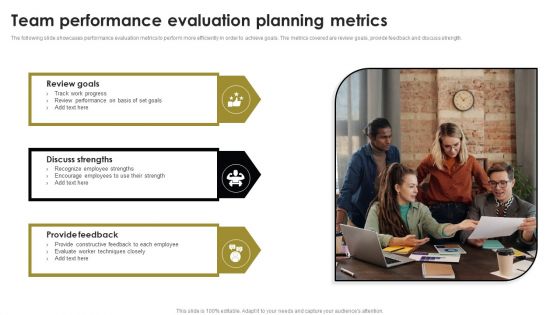
Team Performance Evaluation Planning Metrics Ideas PDF
The following slide showcases performance evaluation metrics to perform more efficiently in order to achieve goals. The metrics covered are review goals, provide feedback and discuss strength. Persuade your audience using this Team Performance Evaluation Planning Metrics Ideas PDF. This PPT design covers three stages, thus making it a great tool to use. It also caters to a variety of topics including Discuss Strengths, Review Goals, Provide Feedback. Download this PPT design now to present a convincing pitch that not only emphasizes the topic but also showcases your presentation skills.

High Performance Sales Kpis Diagram Ppt Templates
This is a high performance sales kpis diagram ppt templates. This is a ten stage process. The stages in this process are strategy map, kpis, action plan, benchmarks, objective, evaluation, measurement, success, strategy, dashboard.

Corporate Performance Management Dashboard Ppt Powerpoint Topics
This is a corporate performance management dashboard ppt powerpoint topics. This is a eight stage process. The stages in this process are analysis, reporting, dashboards, financial consolidation, budgeting, forecasting, detailed planning, operational planning, corporate performance management.
Business Software Performance Metric Icon Demonstration PDF
Presenting Business Software Performance Metric Icon Demonstration PDF to dispense important information. This template comprises Three stages. It also presents valuable insights into the topics including Business Software, Performance, Metric Icon. This is a completely customizable PowerPoint theme that can be put to use immediately. So, download it and address the topic impactfully.
Loyalty Program Performance Tracking Dashboard Topics PDF
This slide covers the KPI dashboard for analyzing customer loyalty campaign results. It includes metrics such as revenue, liability, NQP accrued, transaction count, members, redemption ratio, etc. Deliver an awe inspiring pitch with this creative Loyalty Program Performance Tracking Dashboard Topics PDF bundle. Topics like Loyalty Program Performance, Tracking Dashboard can be discussed with this completely editable template. It is available for immediate download depending on the needs and requirements of the user.
Referral Program Performance Tracking Dashboard Summary PDF
This slide covers the KPI dashboard for analyzing referral campaign results. It includes metrics such as total revenue generated, monthly recurring revenue, new customers, clicks, cancelled customers, paying customers, etc. Deliver and pitch your topic in the best possible manner with this Referral Program Performance Tracking Dashboard Summary PDF. Use them to share invaluable insights on Referral Program Performance, Tracking Dashboard and impress your audience. This template can be altered and modified as per your expectations. So, grab it now.
Dashboard For Tracking Website Performance Professional PDF
This slide covers the KPI dashboard for analyzing the company website. It includes metrics such as conversions, conversion rate, sessions, stickiness, bounce rate, engagement, etc. Deliver and pitch your topic in the best possible manner with this Dashboard For Tracking Website Performance Professional PDF. Use them to share invaluable insights on Dashboard For Tracking, Website Performance and impress your audience. This template can be altered and modified as per your expectations. So, grab it now.

Agency Performance Dashboard Sample Of Ppt
This is a agency performance dashboard sample of ppt. This is a four stage process. The stages in this process are tra score, brand safety, view ability, ad fraud, industry snapshot.
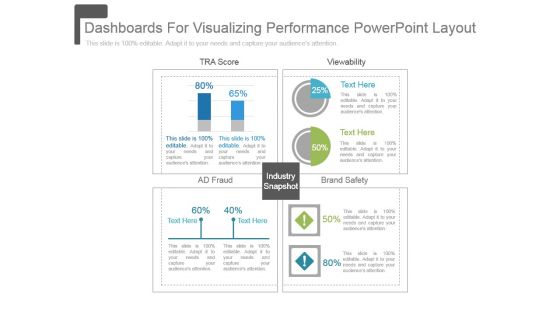
Dashboards For Visualizing Performance Powerpoint Layout
This is a dashboards for visualizing performance powerpoint layout. This is a four stage process. The stages in this process are tra score, view ability, ad fraud, brand safety, industry snapshot.
Fb Advertising Campaign Performance Metrics Icons PDF
The following slide showcases performance metrics to assess a companys behavior, actions, and performance. It includes results, cost per impression and frequency. Presenting Fb Advertising Campaign Performance Metrics Icons PDF to dispense important information. This template comprises three stages. It also presents valuable insights into the topics including Cost Per Impression, Frequency, Results. This is a completely customizable PowerPoint theme that can be put to use immediately. So, download it and address the topic impactfully.

Employee Performance Increment Management Dashboard Summary PDF
The slide shows a dashboard for successful management of employee performance appraisal. Showcasing this set of slides titled Employee Performance Increment Management Dashboard Summary PDF. The topics addressed in these templates are Employee Performance Increment, Management Dashboard. All the content presented in this PPT design is completely editable. Download it and make adjustments in color, background, font etc. as per your unique business setting.

Employee Performance Measures Dashboard Diagram Presentation Ideas
This is a employee performance measures dashboard diagram presentation ideas. This is a one stage process. The stages in this process are business, marketing, dashboard, measuring.

Metrics To Measure Performance Sample Ppt Presentation
This is a metrics to measure performance sample ppt presentation. This is a three stage process. The stages in this process are insight and analysis, goal, tactic.
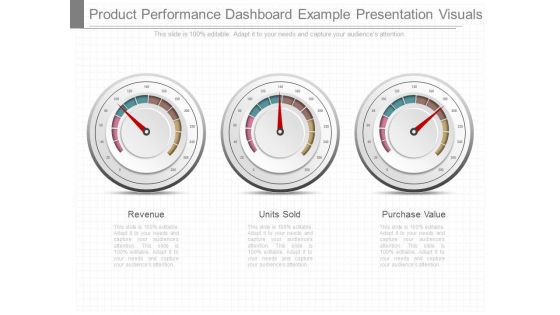
Product Performance Dashboard Example Presentation Visuals
This is a product performance dashboard example presentation visuals. This is a three stage process. The stages in this process are revenue, units sold, purchase value.
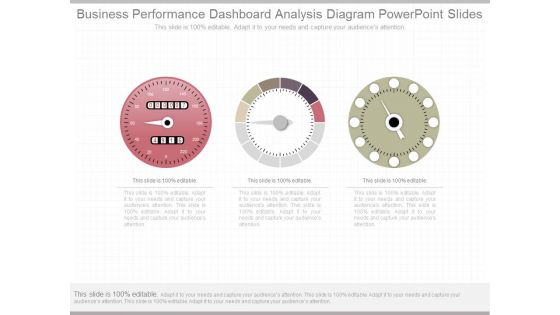
Business Performance Dashboard Analysis Diagram Powerpoint Slides
This is a business performance dashboard analysis diagram powerpoint slides. This is a three stage process. The stages in this process are measure, business, management, presentation, process.

Performance Metrics Application Example Ppt Model
This is a performance metrics application example ppt model. This is a six stage process. The stages in this process are goal, cost, audience, budgeting, forecasting, insight.
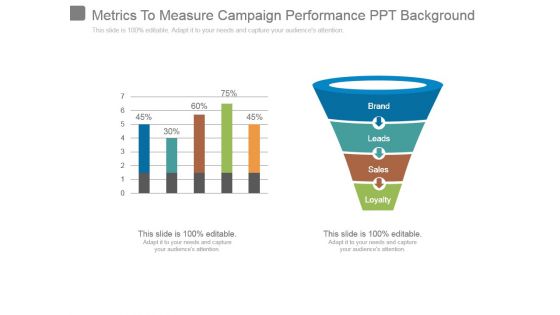
Metrics To Measure Campaign Performance Ppt Background
This is a metrics to measure campaign performance ppt background. This is a two stage process. The stages in this process are brand, leads, sales, loyalty.
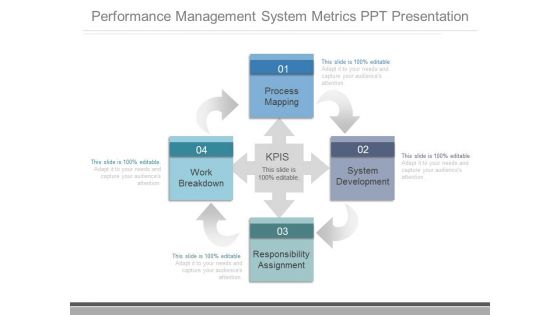
Performance Management System Metrics Ppt Presentation
This is a performance management system metrics ppt presentation. This is a four stage process. The stages in this process are process mapping, work breakdown, responsibility assignment, system development, kpis.
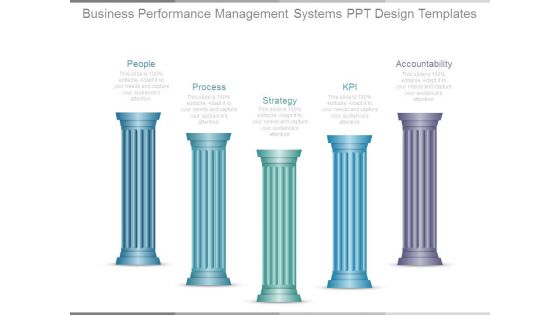
Business Performance Management Systems Ppt Design Templates
This is a business performance management systems ppt design templates. This is a five stage process. The stages in this process are people, process, strategy, kpi, accountability.
Software Development Performance Metric Icon Brochure PDF
Showcasing this set of slides titled Software Development Performance Metric Icon Brochure PDF. The topics addressed in these templates are Software Development, Performance, Metric Icon. All the content presented in this PPT design is completely editable. Download it and make adjustments in color, background, font etc. as per your unique business setting.
Devops Performance Assessment Metrics Icons PDF
This is a devops performance assessment metrics icons pdf template with various stages. Focus and dispense information on four stages using this creative set, that comes with editable features. It contains large content boxes to add your information on topics like devops performance assessment metrics. You can also showcase facts, figures, and other relevant content using this PPT layout. Grab it now.
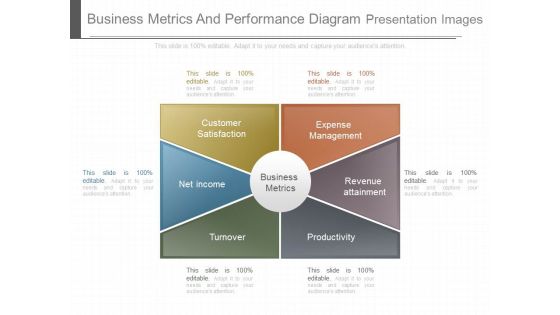
Business Metrics And Performance Diagram Presentation Images
This is a business metrics and performance diagram presentation images. This is a six stage process. The stages in this process are expense management, customer satisfaction, net income, revenue attainment, business metrics, turnover, productivity.
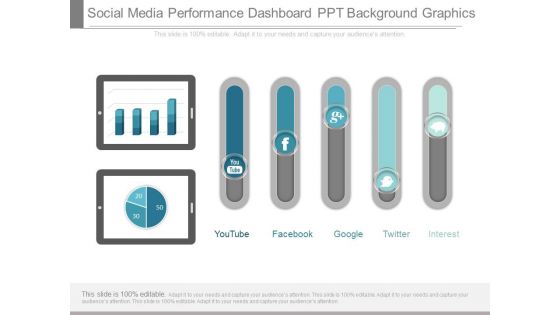
Social Media Performance Dashboard Ppt Background Graphics
This is a social media performance dashboard ppt background graphics. This is a seven stage process. The stages in this process are youtube, facebook, google, twitter, pinterest.
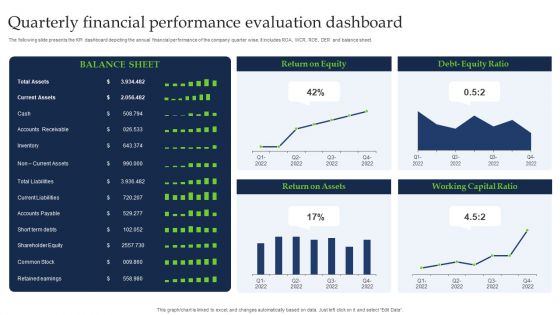
Quarterly Financial Performance Evaluation Dashboard Guidelines PDF
The following slide presents the KPI dashboard depicting the annual financial performance of the company quarter wise. It includes ROA, WCR, ROE, DER and balance sheet. Pitch your topic with ease and precision using this Quarterly Financial Performance Evaluation Dashboard Guidelines PDF. This layout presents information on Current Assets, Shareholder Equity, Common Stock. It is also available for immediate download and adjustment. So, changes can be made in the color, design, graphics or any other component to create a unique layout.
Application Performance Dashboard Ppt Icon Template PDF
This slide covers application performance in market KPIs and metrics such as impressions, clicks, searches for app, conversion rate etc. This Application Performance Dashboard Ppt Icon Template PDF from Slidegeeks makes it easy to present information on your topic with precision. It provides customization options, so you can make changes to the colors, design, graphics, or any other component to create a unique layout. It is also available for immediate download, so you can begin using it right away. Slidegeeks has done good research to ensure that you have everything you need to make your presentation stand out. Make a name out there for a brilliant performance.
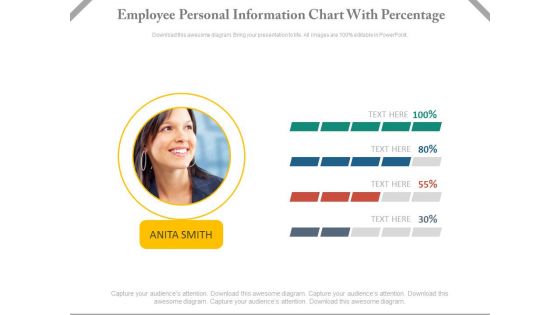
Employee Performance Information Chart Powerpoint Slides
This dashboard template contains employee picture with percentage slides. This dashboard PowerPoint template conveys employees performance in a visual manner. Download this PPT slide for quick decision-making.

Performance Dashboard Template Ppt PowerPoint Presentation Topics
This is a performance dashboard template ppt powerpoint presentation topics. This is a four stage process. The stages in this process are business, strategy, marketing, analysis, success, growth strategy, dashboard.
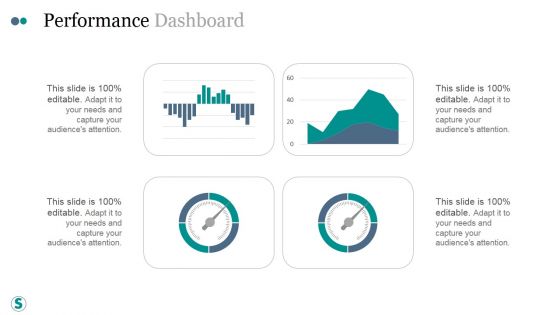
Performance Dashboard Ppt PowerPoint Presentation Summary
This is a performance dashboard ppt powerpoint presentation summary. This is a one stage process. The stages in this process are business, strategy, marketing, analysis, success, growth strategy, dashboard.
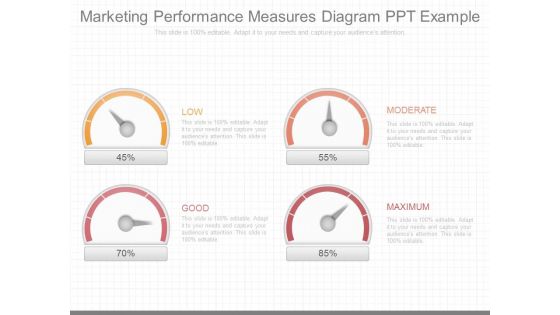
Marketing Performance Measures Diagram Ppt Example
This is a marketing performance measures diagram ppt example. This is a four stage process. The stages in this process are low, moderate, good, maximum.
Company Financials Performance Tracking Dashboard Brochure PDF
This slide illustrates KPI dashboard that can be used by organizations to track their financial performance on company basis. Kpis covered in the slide are contract status, revenue, cost of goods, overdue and task status. Showcasing this set of slides titled Company Financials Performance Tracking Dashboard Brochure PDF. The topics addressed in these templates are Report Shortcut, Revenue Cost, Overdue Task. All the content presented in this PPT design is completely editable. Download it and make adjustments in color, background, font etc. as per your unique business setting.
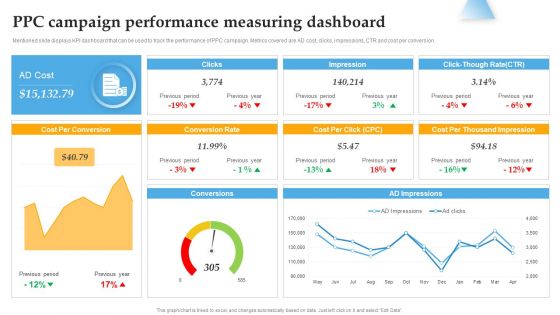
Ppc Campaign Performance Measuring Dashboard Background PDF
Mentioned slide displays KPI dashboard that can be used to track the performance of PPC campaign. Metrics covered are AD cost, clicks, impressions, CTR and cost per conversion.The best PPT templates are a great way to save time, energy, and resources. Slidegeeks have 100 precent editable powerpoint slides making them incredibly versatile. With these quality presentation templates, you can create a captivating and memorable presentation by combining visually appealing slides and effectively communicating your message. Download Ppc Campaign Performance Measuring Dashboard Background PDF from Slidegeeks and deliver a wonderful presentation.

Business Intelligence Performance Dashboard Ppt Powerpoint Slides
This is a business intelligence performance dashboard ppt powerpoint slides. This is a six stage process. The stages in this process are total revenue, detailed profit of top product line, part capacity allocation, market share, customer satisfaction, quality notification.

 Home
Home