Key Performance Indicators
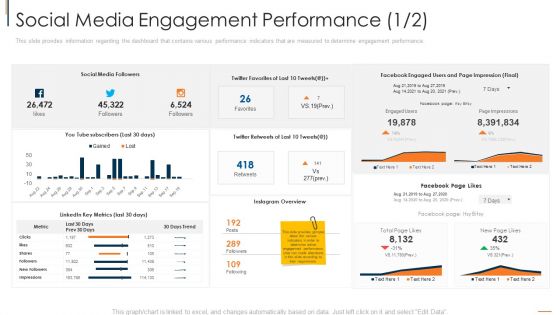
Social Media Engagement Performance Social Summary PDF
This slide provides information regarding the dashboard that contains various performance indicators that are measured to determine engagement performance. Deliver and pitch your topic in the best possible manner with this social media engagement performance social summary pdf. Use them to share invaluable insights on social media engagement performance and impress your audience. This template can be altered and modified as per your expectations. So, grab it now.

Social Media Engagement Performance Network Introduction PDF
This slide provides information regarding the dashboard that contains various performance indicators that are measured to determine engagement performance. Deliver an awe inspiring pitch with this creative social media engagement performance network introduction pdf bundle. Topics like purchase, social metrics, network, customers can be discussed with this completely editable template. It is available for immediate download depending on the needs and requirements of the user.

Software Application Development Performance Metrics Mockup PDF
This slide showcase software application metrics indicator to monitor software quantitative measure for achieving improvement in application and alignment with organization objectives. It includes indicators like CPU usage, memory usage, per minute and byte per requester rate, security exposure and latency and uptime Persuade your audience using this Software Application Development Performance Metrics Mockup PDF. This PPT design covers Six stages, thus making it a great tool to use. It also caters to a variety of topics including Latency And Uptime, Memory Usage, Security Exposure . Download this PPT design now to present a convincing pitch that not only emphasizes the topic but also showcases your presentation skills.
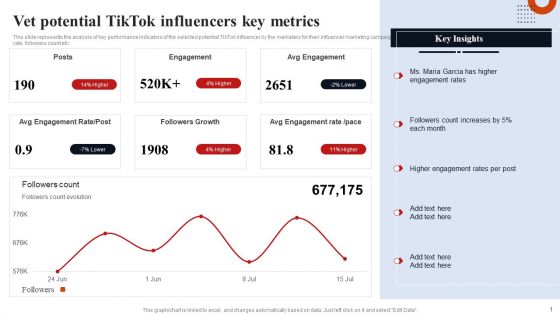
Vet Potential Tiktok Influencers Key Metrics Template PDF
This slide represents the analysis of key performance indicators of the selected potential TikTok influencer by the marketers for their influencer marketing campaign. It includes details related to key metrics such as engagement rate, followers count etc. Explore a selection of the finest Vet Potential Tiktok Influencers Key Metrics Template PDF here. With a plethora of professionally designed and pre made slide templates, you can quickly and easily find the right one for your upcoming presentation. You can use our Vet Potential Tiktok Influencers Key Metrics Template PDF to effectively convey your message to a wider audience. Slidegeeks has done a lot of research before preparing these presentation templates. The content can be personalized and the slides are highly editable. Grab templates today from Slidegeeks.
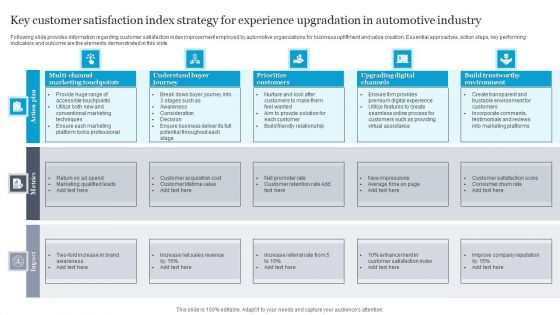
Key Customer Satisfaction Index Strategy For Experience Upgradation In Automotive Industry Download PDF
Following slide provides information regarding customer satisfaction index improvement employed by automotive organizations for business upliftment and value creation. Essential approaches, action steps, key performing indicators and outcome are the elements demonstrated in this slide. Showcasing this set of slides titled Key Customer Satisfaction Index Strategy For Experience Upgradation In Automotive Industry Download PDF. The topics addressed in these templates are Understand Buyer Journey, Prioritize Customers. All the content presented in this PPT design is completely editable. Download it and make adjustments in color, background, font etc. as per your unique business setting.
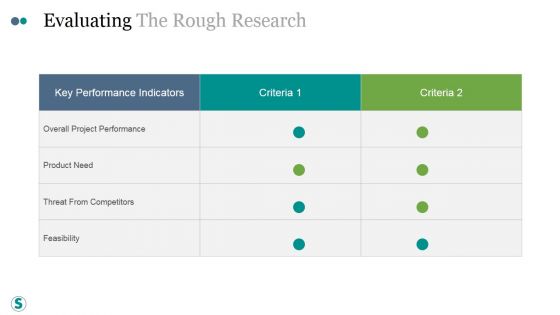
Evaluating The Rough Research Ppt PowerPoint Presentation Show
This is a evaluating the rough research ppt powerpoint presentation show. This is a two stage process. The stages in this process are overall project performance, product need, threat from competitors, feasibility, key performance indicators.
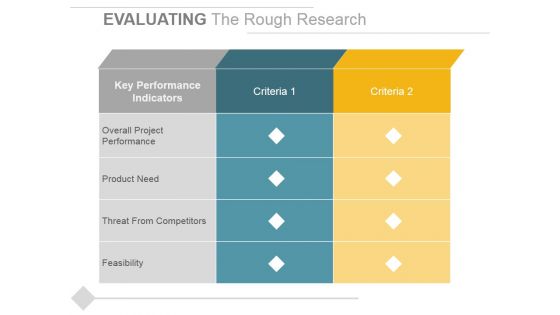
Evaluating The Rough Research Ppt PowerPoint Presentation Inspiration Brochure
This is a evaluating the rough research ppt powerpoint presentation inspiration brochure. This is a three stage process. The stages in this process are key performance indicators, overall project performance, product need, threat from competitors, feasibility.
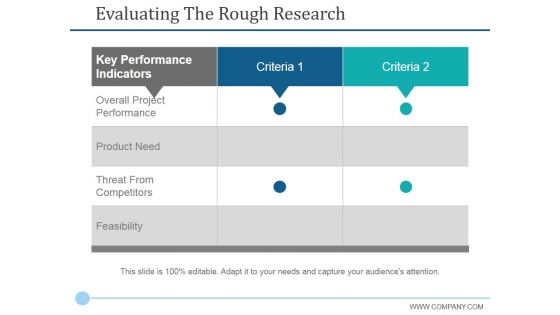
Evaluating The Rough Research Ppt PowerPoint Presentation Infographics Ideas
This is a evaluating the rough research ppt powerpoint presentation infographics ideas. This is a two stage process. The stages in this process are key performance indicators, overall project performance, product need.

Evaluating The Rough Research Ppt PowerPoint Presentation Inspiration
This is a evaluating the rough research ppt powerpoint presentation inspiration. This is a three stage process. The stages in this process are key performance indicators, overall project performance, product need, threat from competitors, feasibility.

Business Strategy Template Ppt PowerPoint Presentation Infographic Template Graphics Design
This is a business strategy template ppt powerpoint presentation infographic template graphics design. This is a four stage process. The stages in this process are purpose, key objectives, initiatives, key performance indicators.

Business Strategy Template Ppt PowerPoint Presentation File Slideshow
This is a business strategy template ppt powerpoint presentation file slideshow. This is a two stage process. The stages in this process are strategic plan, purpose, key objectives, key performance indicators.

Business Strategy Ppt PowerPoint Presentation File Topics
This is a business strategy ppt powerpoint presentation file topics. This is a four stage process. The stages in this process are strategic plan, purpose, key objectives, initiatives, key performance indicators.

Business Strategy Template Ppt PowerPoint Presentation Portfolio Sample
This is a business strategy template ppt powerpoint presentation portfolio sample. This is a two stage process. The stages in this process are strategic plan, purpose, key objectives, initiatives, key performance indicators.

Customer Satisfaction Template 1 Ppt PowerPoint Presentation Pictures Gridlines
This is a customer satisfaction template 1 ppt powerpoint presentation pictures gridlines. This is a three stage process. The stages in this process are key performance indicators, business, management, strategy, dashboard.
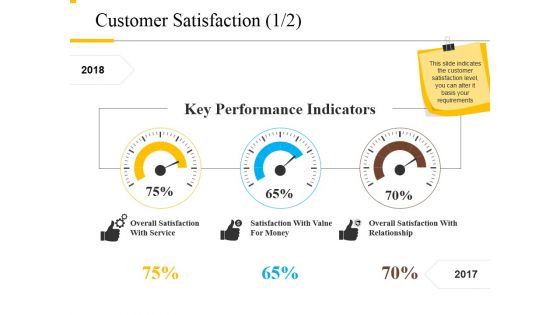
Customer Satisfaction Template 1 Ppt PowerPoint Presentation Infographics Outfit
This is a customer satisfaction template 1 ppt powerpoint presentation infographics outfit. This is a three stage process. The stages in this process are key performance indicators, overall satisfaction with service, satisfaction with value for money.

Customer Satisfaction Template 1 Ppt PowerPoint Presentation Ideas Tips
This is a customer satisfaction template 1 ppt powerpoint presentation ideas tips. This is a three stage process. The stages in this process are key performance indicators, overall satisfaction with service, satisfaction with value for money.
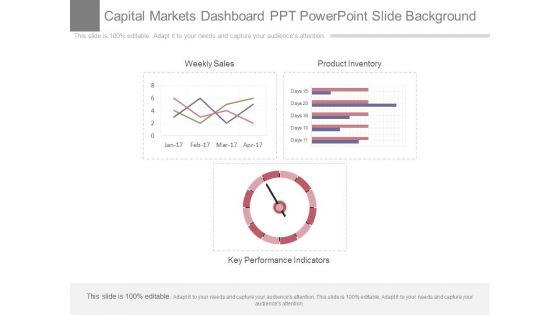
Capital Markets Dashboard Ppt Powerpoint Slide Background
This is a capital markets dashboard ppt powerpoint slide background. This is a three stage process. The stages in this process are weekly sales, product inventory, key performance indicators.
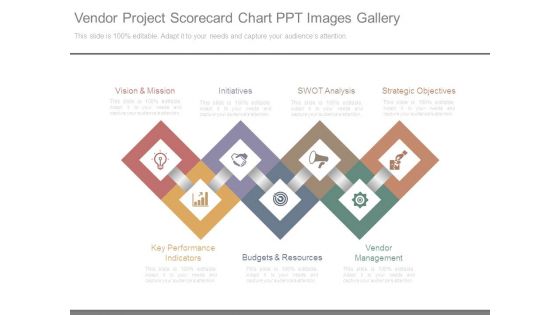
Vendor Project Scorecard Chart Ppt Images Gallery
This is a vendor project scorecard chart ppt images gallery. This is a seven stage process. The stages in this process are vision and mission, initiatives, swot analysis, strategic objectives, vendor management, budgets and resources, key performance indicators.
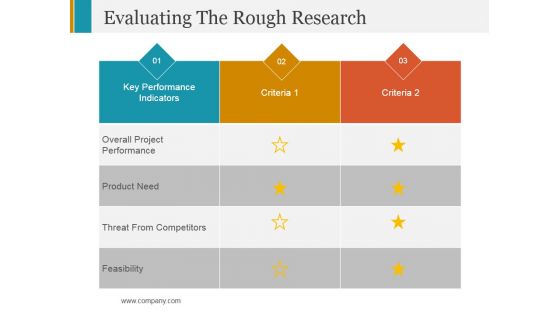
Evaluating The Rough Research Ppt PowerPoint Presentation Ideas Clipart Images
This is a evaluating the rough research ppt powerpoint presentation ideas clipart images. This is a two stage process. The stages in this process are key performance indicators, criteria, feasibility.

Key Process To Implement Big Data Practice In Manufacturing Industry Diagrams Pdf
The purpose of this slide is to represent procedure to establish big data techniques in manufacturing businesses. It includes various stages such as establishing business key performance indicators, assessing issues in manufacturing, carrying out cost benefit analysis of project and implementing big data in manufacturing process.Showcasing this set of slides titled Key Process To Implement Big Data Practice In Manufacturing Industry Diagrams Pdf The topics addressed in these templates are Expect Incorporating, Understand Performance, Manufacturing Plant All the content presented in this PPT design is completely editable. Download it and make adjustments in color, background, font etc. as per your unique business setting.
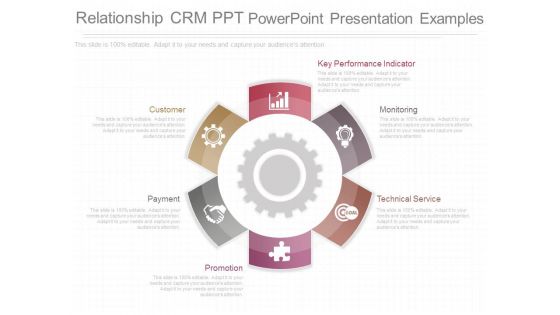
Relationship Crm Ppt Powerpoint Presentation Examples
This is a relationship crm ppt powerpoint presentation examples. This is a six stage process. The stages in this process are customer, payment, promotion, technical service, monitoring, key performance indicator.
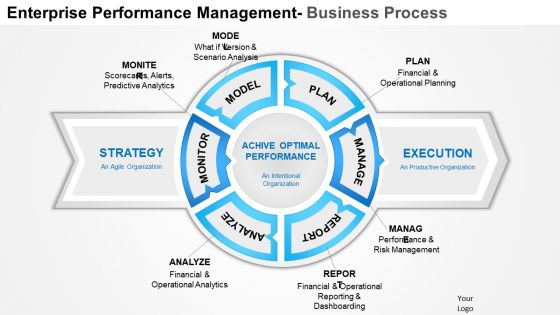
Business Framework Enterprise Performance Management PowerPoint Presentation
This image slide has been designed to depict enterprise performance management diagram. This image slide displays business planning and forecasting. This image slide may be used to exhibit business performance management in your presentations. This image slide will give edge to your presentations.
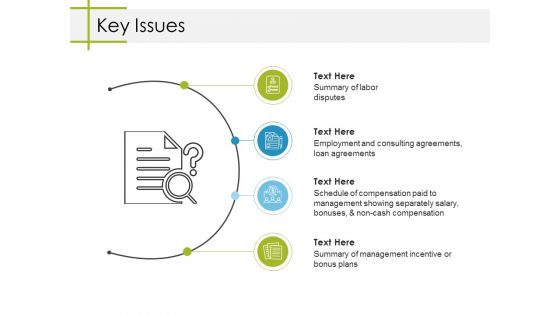
Key Issues Ppt PowerPoint Presentation Slides Deck
This is a key issues ppt powerpoint presentation slides deck. This is a four stage process. The stages in this process are key issues, business, marketing, icons, strategy.

Key Metrics For Finance Unit Presentation Images
This is a key metrics for finance unit presentation images. This is a three stage process. The stages in this process are business, management, strategy, finance unit, marketing.
Key Customer Service Metrics Powerpoint Slide Deck
This is a key customer service metrics powerpoint slide deck. This is a five stage process. The stages in this process are process, management, arrow, marketing, strategy.
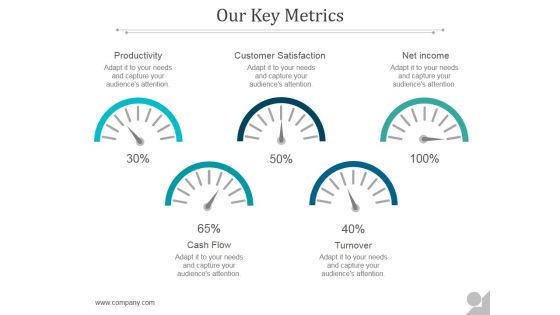
Our Key Metrics Ppt PowerPoint Presentation Examples
This is a our key metrics ppt powerpoint presentation examples. This is a five stage process. The stages in this process are productivity, customer satisfaction, net income, cash flow, turnover.
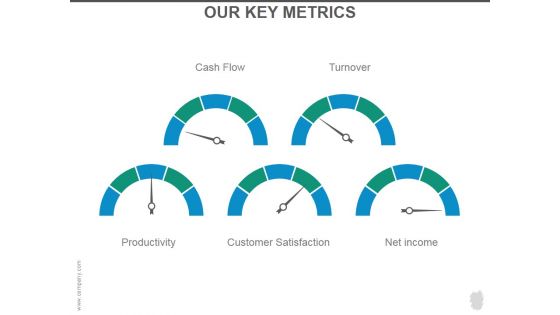
Our Key Metrics Ppt PowerPoint Presentation Portfolio
This is a our key metrics ppt powerpoint presentation portfolio. This is a five stage process. The stages in this process are cash flow, turnover, productivity, customer satisfaction, net income.
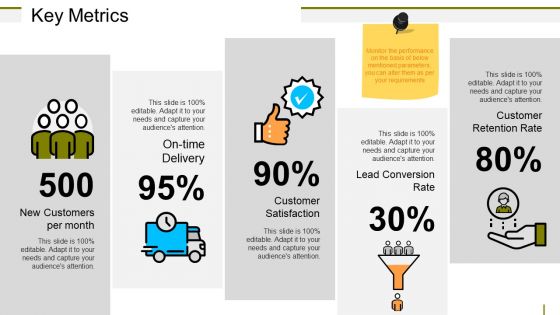
Key Metrics Ppt PowerPoint Presentation Model Portrait

Key Measures For Customer Satisfaction Powerpoint Templates
This is a key measures for customer satisfaction powerpoint templates. This is a one stage process. The stages in this process are excellent, very good, good, poor, bad.

Key Management Ppt PowerPoint Presentation Pictures Tips
This is a key management ppt powerpoint presentation pictures tips. This is a three stage process. The stages in this process are john carter, peter clark, elisabeth smith.
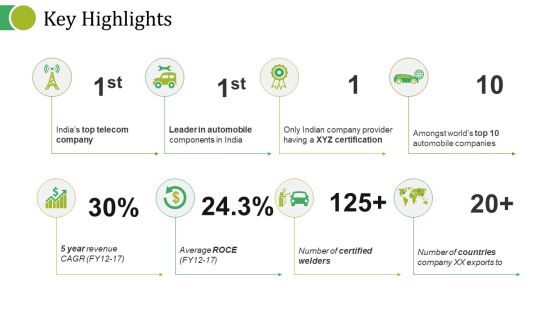
Key Highlights Ppt PowerPoint Presentation Summary Demonstration
This is a key highlights ppt powerpoint presentation summary demonstration. This is a eight stage process. The stages in this process are top telecom company, leader in automobile, xyz certification, automobile companies.

Key Metrics For Workforce Improvement Ppt Summary
This is a key metrics for workforce improvement ppt summary. This is a four stage process. The stages in this process are vision and strategy, metrics, targets, objectives, area of focus.
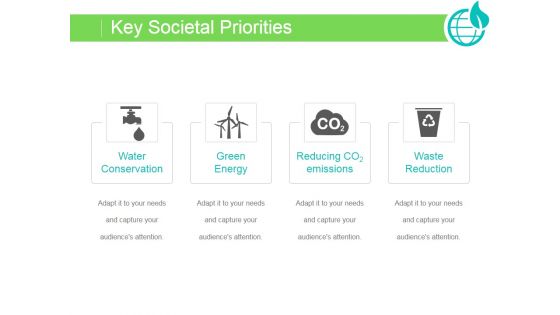
Key Societal Priorities Ppt PowerPoint Presentation Graphics
This is a key societal priorities ppt powerpoint presentation graphics. This is a four stage process. The stages in this process are water conservation, green energy, reducing co emissions, waste reduction.
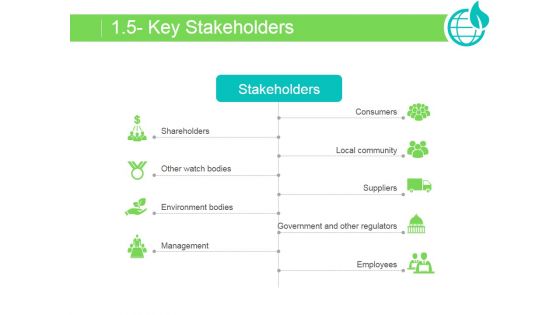
Key Stakeholders Ppt PowerPoint Presentation Example 2015
This is a key stakeholders ppt powerpoint presentation example 2015. This is a nine stage process. The stages in this process are shareholders, other watch bodies, environment bodies, management, consumers, local community, suppliers, government and other regulators, employees.
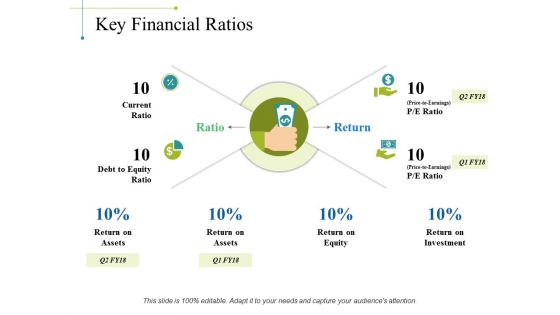
Key Financial Ratios Ppt PowerPoint Presentation Guidelines
This is a key financial ratios ppt powerpoint presentation guidelines. This is a four stage process. The stages in this process are current ratio, debt to equity ratio, ratio, return, return on assets.

Key Highlights Ppt PowerPoint Presentation Gallery Deck
This is a key highlights ppt powerpoint presentation gallery deck. This is a eight stage process. The stages in this process are indias top telecom company, leader in automobile components in india, only indian company provider having a xyz certification, amongst worlds top 10 automobile companies, number of certified welders.

Manufacturing Operations Management Process Manufacturing Performance Analysis Inspiration PDF
This slide represents manufacturing performance analysis with key strategies to improve production indicators. It includes production rate, product quality, downtime, scrap rate, etc. Retrieve professionally designed Manufacturing Operations Management Process Manufacturing Performance Analysis Inspiration PDF to effectively convey your message and captivate your listeners. Save time by selecting pre made slideshows that are appropriate for various topics, from business to educational purposes. These themes come in many different styles, from creative to corporate, and all of them are easily adjustable and can be edited quickly. Access them as PowerPoint templates or as Google Slides themes. You do not have to go on a hunt for the perfect presentation because Slidegeeks got you covered from everywhere.
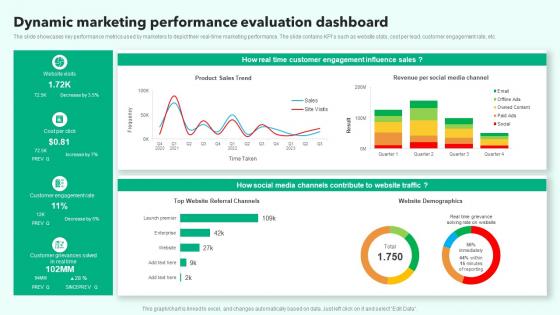
Dynamic Marketing Performance Evaluation Dashboard Microsoft Pdf
The slide showcases key performance metrics used by marketers to depict their real time marketing performance. The slide contains KPIs such as website stats, cost per lead, customer engagement rate, etc. Pitch your topic with ease and precision using this Dynamic Marketing Performance Evaluation Dashboard Microsoft Pdf. This layout presents information on Influence Sales, Customer Engagement, Customer Engagement Rate. It is also available for immediate download and adjustment. So, changes can be made in the color, design, graphics or any other component to create a unique layout.
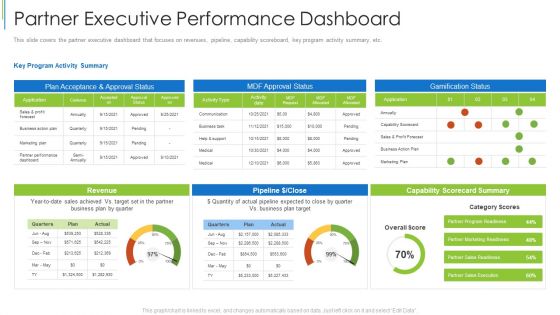
Partner Executive Performance Dashboard Ppt Styles PDF
This slide covers the partner executive dashboard that focuses on revenues, pipeline, capability scoreboard, key program activity summary, etc. Deliver an awe inspiring pitch with this creative partner executive performance dashboard ppt styles pdf bundle. Topics like business action plan, marketing plan, dashboard can be discussed with this completely editable template. It is available for immediate download depending on the needs and requirements of the user.

Employee Performance Management KPI Dashboard Structure PDF
The following slide depicts the overview of staff performance management system to achieve goals and evaluate business growth. It includes key elements such as absenteeism rate, overtime hours, training costs, labor effectiveness etc. Take your projects to the next level with our ultimate collection of Employee Performance Management KPI Dashboard Structure PDF. Slidegeeks has designed a range of layouts that are perfect for representing task or activity duration, keeping track of all your deadlines at a glance. Tailor these designs to your exact needs and give them a truly corporate look with your own brand colors they will make your projects stand out from the rest.
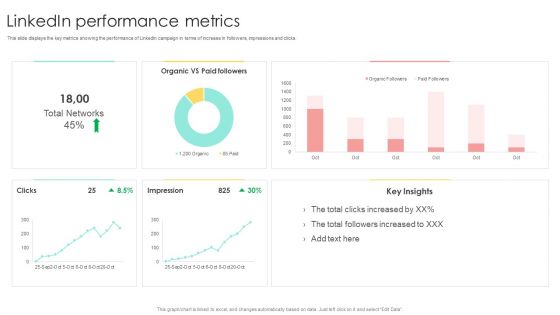
Media Advertising Linkedin Performance Metrics Mockup PDF
This slide displays the key metrics showing the performance of LinkedIn campaign in terms of increase in followers, impressions and clicks. Crafting an eye-catching presentation has never been more straightforward. Let your presentation shine with this tasteful yet straightforward Media Advertising Linkedin Performance Metrics Mockup PDF template. It offers a minimalistic and classy look that is great for making a statement. The colors have been employed intelligently to add a bit of playfulness while still remaining professional. Construct the ideal Media Advertising Linkedin Performance Metrics Mockup PDF that effortlessly grabs the attention of your audience Begin now and be certain to wow your customers

Merchant Performance Strategic Management System Inspiration PDF
The given slide depicts a vendor or supplier performance evaluation system in order to cultivate a long-term relationship with the vendor. The key components include vendor KPIs, rating methods, scorecard, performance dashboards etc. Persuade your audience using this Merchant Performance Strategic Management System Inspiration PDF. This PPT design covers six stages, thus making it a great tool to use. It also caters to a variety of topics including Vendor Scorecard, Performance Dashboards, Analyze Vendor Performance. Download this PPT design now to present a convincing pitch that not only emphasizes the topic but also showcases your presentation skills.
Sales Performance Monthly Strategy Dashboard Icons PDF
Below slide showcases the monthly dashboard of sales performance . Company can measure and evaluate their monthly sales performance using key factors that are sales comparison, monthly sales, planned vs actual sales and gross margin by Pitch your topic with ease and precision using this sales performance monthly strategy dashboard icons pdf. This layout presents information on sales performance monthly strategy dashboard. It is also available for immediate download and adjustment. So, changes can be made in the color, design, graphics or any other component to create a unique layout.
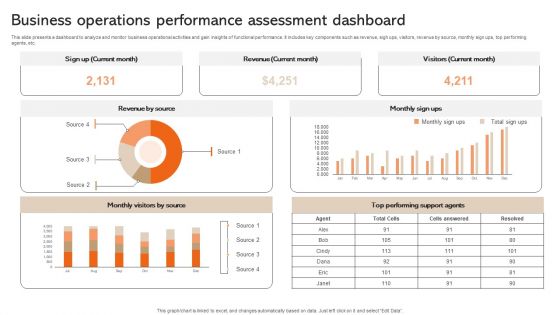
Business Operations Performance Assessment Dashboard Information PDF
This slide presents a dashboard to analyze and monitor business operational activities and gain insights of functional performance. It includes key components such as revenue, sigh ups, visitors, revenue by source, monthly sign ups, top performing agents, etc. Showcasing this set of slides titled Business Operations Performance Assessment Dashboard Information PDF. The topics addressed in these templates are Source, Monthly, Agents. All the content presented in this PPT design is completely editable. Download it and make adjustments in color, background, font etc. as per your unique business setting.
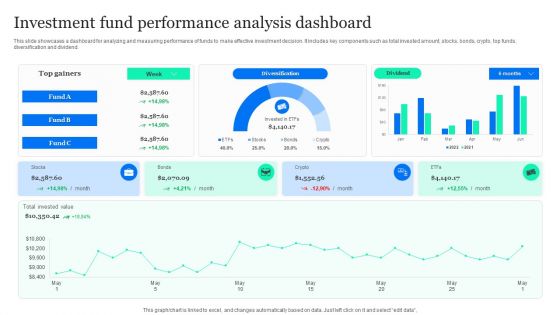
Investment Fund Performance Analysis Dashboard Professional PDF
This slide showcases a dashboard for analyzing and measuring performance of funds to make effective investment decision. It includes key components such as total invested amount, stocks, bonds, crypto, top funds, diversification and dividend. Pitch your topic with ease and precision using this Investment Fund Performance Analysis Dashboard Professional PDF. This layout presents information on Diversification, Invested Value, Bonds. It is also available for immediate download and adjustment. So, changes can be made in the color, design, graphics or any other component to create a unique layout.

Financial Performance Executive Summary Report Template PDF
The following slide presents the overview of current financial performance with future goals for firm decision making. It includes KPIs such as revenue, cost, net profit, operating expenses, cash flows etc. Presenting Financial Performance Executive Summary Report Template PDF to dispense important information. This template comprises one stages. It also presents valuable insights into the topics including Operating Expenditure, Revenue, Key Metrics. This is a completely customizable PowerPoint theme that can be put to use immediately. So, download it and address the topic impactfully.
Investment Fund Performance Tracking Dashboard Microsoft PDF
This slide showcases a dashboard to track and supervise funds performance for portfolio balancing . it includes key components such as amount invested in funds, number of invested funds, rate of return, annual investments and rating wise investments. Pitch your topic with ease and precision using this Investment Fund Performance Tracking Dashboard Microsoft PDF. This layout presents information on Amount Invented Funds, Rate Return, Rating Wise Investments. It is also available for immediate download and adjustment. So, changes can be made in the color, design, graphics or any other component to create a unique layout.
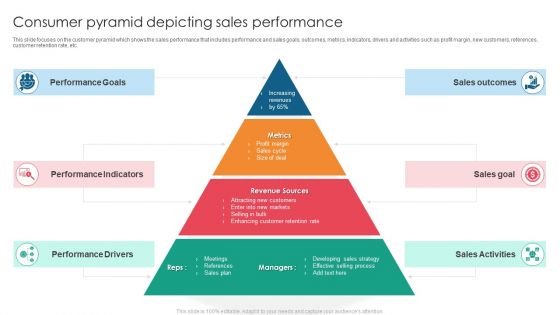
Consumer Pyramid Depicting Sales Performance Introduction PDF
This slide focuses on the customer pyramid which shows the sales performance that includes performance and sales goals, outcomes, metrics, indicators, drivers and activities such as profit margin, new customers, references, customer retention rate, etc. Presenting Consumer Pyramid Depicting Sales Performance Introduction PDF to dispense important information. This template comprises six stages. It also presents valuable insights into the topics including Performance Indicators, Performance Goals, Performance Drivers. This is a completely customizable PowerPoint theme that can be put to use immediately. So, download it and address the topic impactfully.
Investment Annual Returns Performance Report Icons PDF
This slide presents a report highlighting performance of returns from investments in multiple funds to analyze and measure portfolio. It includes key components such as annual returns of funds, corporate bonds, equity, cash and market mood index and G-sec. Pitch your topic with ease and precision using this Investment Annual Returns Performance Report Icons PDF. This layout presents information on Cash, Quity, Corporate Bonds. It is also available for immediate download and adjustment. So, changes can be made in the color, design, graphics or any other component to create a unique layout.
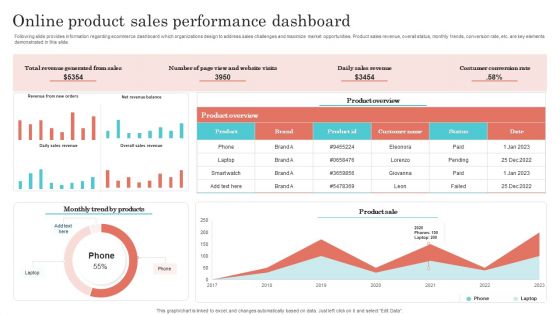
Online Product Sales Performance Dashboard Designs PDF
Following slide provides information regarding ecommerce dashboard which organizations design to address sales challenges and maximize market opportunities. Product sales revenue, overall status, monthly trends, conversion rate, etc. are key elements demonstrated in this slide. Showcasing this set of slides titled Online Product Sales Performance Dashboard Designs PDF. The topics addressed in these templates are Revenue Generated From Sales, Daily Sales Revenue, Costumer Conversion Rate. All the content presented in this PPT design is completely editable. Download it and make adjustments in color, background, font etc. as per your unique business setting.
Sustainable Green Cloud Computing Performance Tracking Dashboard
This slide depicts the performance tracking dashboard for green cloud computing. This slide aims to showcase the performance tracking report of green cloud computing by covering parameters such as Power Use Effectiveness PUE, high-density zone, history, consumption, and Average Propensity to Consume APC consumption. The Sustainable Green Cloud Computing Performance Tracking Dashboard is a compilation of the most recent design trends as a series of slides. It is suitable for any subject or industry presentation, containing attractive visuals and photo spots for businesses to clearly express their messages. This template contains a variety of slides for the user to input data, such as structures to contrast two elements, bullet points, and slides for written information. Slidegeeks is prepared to create an impression.
Cost Control Performance Dashboard Icon Themes Pdf
Showcasing this set of slides titled Cost Control Performance Dashboard Icon Themes Pdf. The topics addressed in these templates are Cost Control, Performance, Dashboard. All the content presented in this PPT design is completely editable. Download it and make adjustments in color, background, font etc. as per your unique business setting.
Circular Performance Measurement Metrics PowerPoint Templates
Communicate with your group through this slide of circles. It will facilitate understanding of your views. This diagram can be used to display performance measurement in business presentations.
Zero Trust Network Access Performance Tracking Dashboard
This slide represents the performance tracking dashboard for zero trust network access. The purpose of this slide is to showcase the level of request modes, connected users, daily usage of the network, security rating, device risk and threat flow. Want to ace your presentation in front of a live audience Our Zero Trust Network Access Performance Tracking Dashboard can help you do that by engaging all the users towards you. Slidegeeks experts have put their efforts and expertise into creating these impeccable powerpoint presentations so that you can communicate your ideas clearly. Moreover, all the templates are customizable, and easy-to-edit and downloadable. Use these for both personal and commercial use.

Cost Control Plan Performance Dashboard Pictures Pdf
This slide depicts a performance dashboard for a budgetary control plan that helps track and analyze the metrics related to achieving set goals. It includes revenue streams, revenue vs. income, etc. Pitch your topic with ease and precision using this Cost Control Plan Performance Dashboard Pictures Pdf. This layout presents information on Dashboard, Expenses, Income. It is also available for immediate download and adjustment. So, changes can be made in the color, design, graphics or any other component to create a unique layout.
Sales Performance Evaluation Summary Dashboard Icons Pdf
This slide showcase Product sales performance summary dashboard to measure insights to ensure product success in marketplace. It includes elements such as total revenue, product sold, store orders, online orders, sales distribution etc.Showcasing this set of slides titled Sales Performance Evaluation Summary Dashboard Icons Pdf The topics addressed in these templates are Sales Distribution, Inventory Turnover Ratio, Order Comparison All the content presented in this PPT design is completely editable. Download it and make adjustments in color, background, font etc. as per your unique business setting.
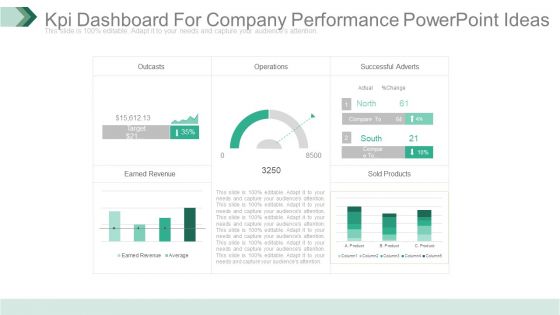
Kpi Dashboard For Company Performance Powerpoint Ideas
This is a kpi dashboard for company performance powerpoint ideas. This is a five stage process. The stages in this process are outcasts, operations, successful adverts, earned revenue, sold products.
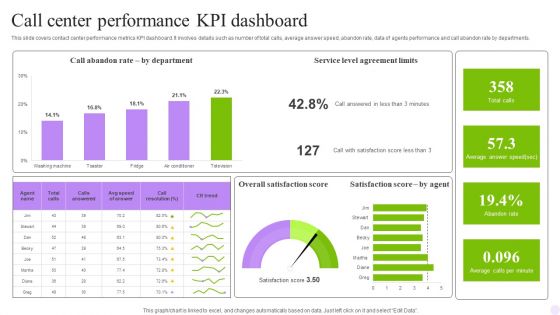
Call Center Performance KPI Dashboard Formats PDF
This slide covers contact center performance metrics KPI dashboard. It involves details such as number of total calls, average answer speed, abandon rate, data of agents performance and call abandon rate by departments. Showcasing this set of slides titled Call Center Performance KPI Dashboard Formats PDF. The topics addressed in these templates are Department, Dashboard, Agreement Limits. All the content presented in this PPT design is completely editable. Download it and make adjustments in color, background, font etc. as per your unique business setting.

Procurement KPI Performance Benchmark Graphics PDF
This slide covers the procurement performance benchmarks for the organizations such as spend under management, cost avoidance, vender performance etc. Deliver and pitch your topic in the best possible manner with this Procurement KPI Performance Benchmark Graphics PDF. Use them to share invaluable insights on Cost Savings, Vendor Performance, Total Cost and impress your audience. This template can be altered and modified as per your expectations. So, grab it now.
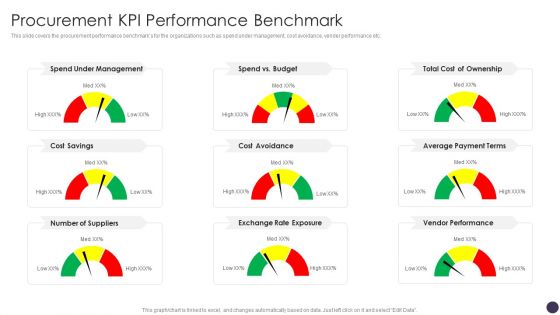
Procurement KPI Performance Benchmark Professional PDF
This slide covers the procurement performance benchmarks for the organizations such as spend under management, cost avoidance, vender performance etc. Deliver and pitch your topic in the best possible manner with this Procurement KPI Performance Benchmark Professional PDF. Use them to share invaluable insights on Under Management, Cost Of Ownership, Average Payment and impress your audience. This template can be altered and modified as per your expectations. So, grab it now.

 Home
Home