It Change Management Kpis
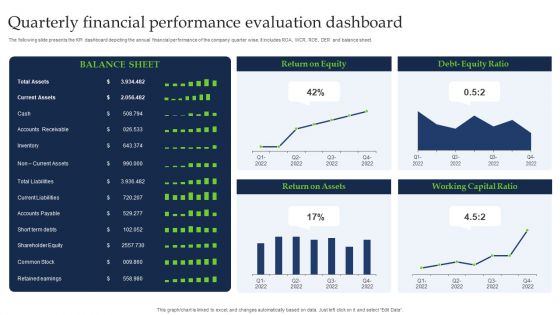
Quarterly Financial Performance Evaluation Dashboard Guidelines PDF
The following slide presents the KPI dashboard depicting the annual financial performance of the company quarter wise. It includes ROA, WCR, ROE, DER and balance sheet. Pitch your topic with ease and precision using this Quarterly Financial Performance Evaluation Dashboard Guidelines PDF. This layout presents information on Current Assets, Shareholder Equity, Common Stock. It is also available for immediate download and adjustment. So, changes can be made in the color, design, graphics or any other component to create a unique layout.
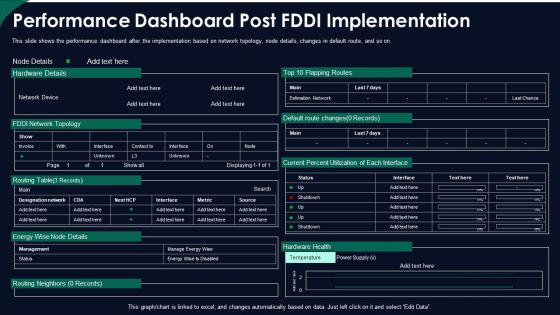
FDDI Network Standard IT Performance Dashboard Post Fddi Implementation Ppt Slides Background PDF
This slide shows the performance dashboard after the implementation based on network topology, node details, changes in default route, and so on. Deliver an awe inspiring pitch with this creative fddi network standard it performance dashboard post fddi implementation ppt slides background pdf bundle. Topics like performance dashboard post fddi implementation can be discussed with this completely editable template. It is available for immediate download depending on the needs and requirements of the user.
Tracking Pipeline Steps Using Sales Metrics Ppt PowerPoint Presentation File Outline PDF
Pitch your topic with ease and precision using this tracking pipeline steps using sales metrics ppt powerpoint presentation file outline pdf. This layout presents information on qualified leads every month, monthly sales cycle, number of leads at each stage of pipeline, win rate based on deal size. It is also available for immediate download and adjustment. So, changes can be made in the color, design, graphics or any other component to create a unique layout.

SEO Audit Report Dashboard With Thematic Score And Crawled Pages Download PDF
This graph or chart is linked to excel, and changes automatically based on data. Just left click on it and select Edit Data. Deliver and pitch your topic in the best possible manner with this SEO Audit Report Dashboard With Thematic Score And Crawled Pages Download PDF. Use them to share invaluable insights on Thematic Score Warnings, International SEO Performance, Total Score Healthy and impress your audience. This template can be altered and modified as per your expectations. So, grab it now.
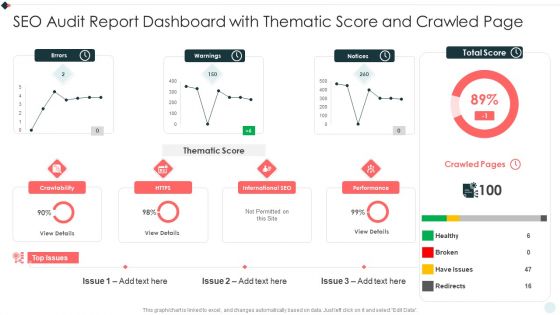
SEO Audit Summary To Increase SEO Audit Report Dashboard With Thematic Score Download PDF
This graph or chart is linked to excel, and changes automatically based on data. Just left click on it and select Edit Data. Deliver an awe inspiring pitch with this creative SEO Audit Summary To Increase SEO Audit Report Dashboard With Thematic Score Download PDF bundle. Topics like Total Score, Crawled Pages, Top Issues can be discussed with this completely editable template. It is available for immediate download depending on the needs and requirements of the user.

Playbook For Sales Growth Strategies Digital Marketing Dashboard For Organic Growth Designs PDF
This graph or chart is linked to excel, and changes automatically based on data. Just left click on it and select Edit Data. Deliver and pitch your topic in the best possible manner with this Playbook For Sales Growth Strategies Digital Marketing Dashboard For Organic Growth Designs PDF. Use them to share invaluable insights on Unique Visitors, Sessions, Bounce Rate and impress your audience. This template can be altered and modified as per your expectations. So, grab it now.
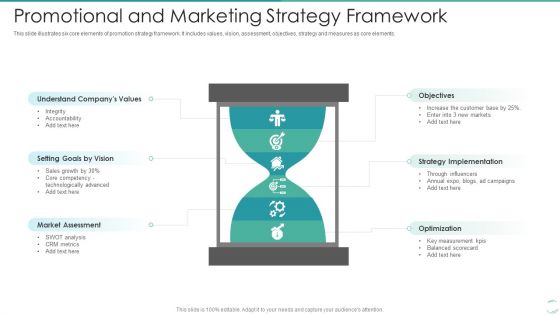
Promotional And Marketing Strategy Framework Infographics PDF
This slide illustrates six core elements of promotion strategy framework. It includes values, vision, assessment, objectives, strategy and measures as core elements. Pitch your topic with ease and precision using this Promotional And Marketing Strategy Framework Infographics PDF. This layout presents information on Strategy Implementation, Optimization, Market Assessment. It is also available for immediate download and adjustment. So, changes can be made in the color, design, graphics or any other component to create a unique layout.
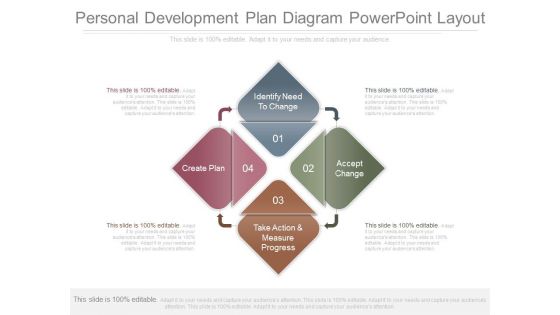
Personal Development Plan Diagram Powerpoint Layout
This is a personal development plan diagram powerpoint layout. This is a four stage process. The stages in this process are identify need to change, accept change, take action and measure progress, create plan.

SMART Objectives To Achieve Business Milestones Graphics PDF
Mentioned slide illustrates SMART Specific, Measurable, Achievable, Relevant and Timely objectives set by businesses to reach organisation goals. It includes objectives such as sales turnover, customer satisfaction and human resource management. Pitch your topic with ease and precision using this SMART Objectives To Achieve Business Milestones Graphics PDF. This layout presents information on Specific, Measurable, Achievable. It is also available for immediate download and adjustment. So, changes can be made in the color, design, graphics or any other component to create a unique layout.

Customer NPS Metric With Revenue Growth Impact Ppt Show Portrait PDF
This slide illustrates net promoter score with revenue growth impact. It provides information about market average NPS, respondents, promoter, detractor, passive, etc. Pitch your topic with ease and precision using this Customer NPS Metric With Revenue Growth Impact Ppt Show Portrait PDF. This layout presents information on Promoter, Detractor, Passive. It is also available for immediate download and adjustment. So, changes can be made in the color, design, graphics or any other component to create a unique layout.
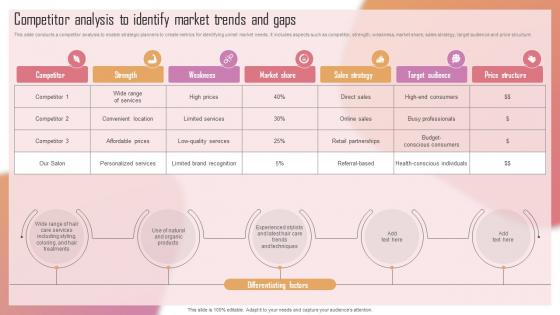
Customizing The Salon Experience Competitor Analysis To Identify Market Trends And Gaps Strategy SS V
This slide conducts a competitor analysis to enable strategic planners to create metrics for identifying unmet market needs. It includes aspects such as competitor, strength, weakness, market share, sales strategy, target audience and price structure. Present like a pro with Customizing The Salon Experience Competitor Analysis To Identify Market Trends And Gaps Strategy SS V. Create beautiful presentations together with your team, using our easy-to-use presentation slides. Share your ideas in real-time and make changes on the fly by downloading our templates. So whether you are in the office, on the go, or in a remote location, you can stay in sync with your team and present your ideas with confidence. With Slidegeeks presentation got a whole lot easier. Grab these presentations today.
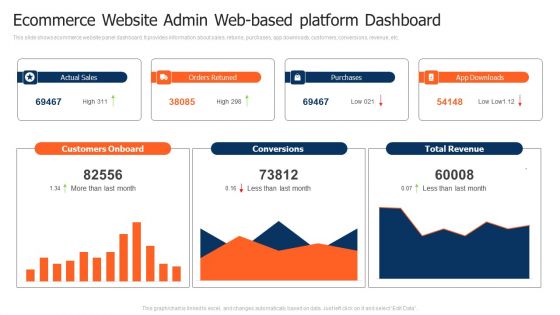
Ecommerce Website Admin Web Based Platform Dashboard Pictures PDF
This slide shows ecommerce website panel dashboard. It provides information about sales, returns, purchases, app downloads, customers, conversions, revenue, etc. Pitch your topic with ease and precision using this Ecommerce Website Admin Web Based Platform Dashboard Pictures PDF. This layout presents information on Customers Onboard, Purchases, Total Revenue. It is also available for immediate download and adjustment. So, changes can be made in the color, design, graphics or any other component to create a unique layout.

Information Technology Project Budget Evaluation Plan Pictures PDF
This slide signifies the project key performance indicator dashboard to evaluate financial budget evaluation. It covers information regarding to allocated and used budget. Pitch your topic with ease and precision using this Information Technology Project Budget Evaluation Plan Pictures PDF. This layout presents information on Develop Risk Assessment Report, Environment, Security. It is also available for immediate download and adjustment. So, changes can be made in the color, design, graphics or any other component to create a unique layout.
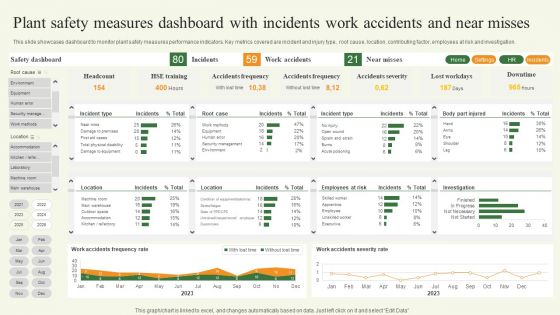
Plant Safety Measures Dashboard With Incidents Work Accidents And Near Misses Template PDF
This slide showcases dashboard to monitor plant safety measures performance indicators. Key metrics covered are incident and injury type, root cause, location, contributing factor, employees at risk and investigation. Pitch your topic with ease and precision using this Plant Safety Measures Dashboard With Incidents Work Accidents And Near Misses Template PDF. This layout presents information on Plant Safety Measures Dashboard, Incidents Work Accidents. It is also available for immediate download and adjustment. So, changes can be made in the color, design, graphics or any other component to create a unique layout.

Ten Steps Process For Measuring Progress Results Ppt PowerPoint Presentation Slides Inspiration
Presenting this set of slides with name ten steps process for measuring progress results ppt powerpoint presentation slides inspiration. This is a ten stage process. The stages in this process are define problem, overcoming obstacles, measuring results, changing mindset, measuring progress, meeting the deadline, implementing the best solution. This is a completely editable PowerPoint presentation and is available for immediate download. Download now and impress your audience.

Three Lines Of Defense Border Model For Internal Auditing Formats PDF
This slide represents the model representing the three lines of defense for internal auditing. It includes details related to the roles and responsibilities performed by key stakeholders in the lines of defense, external auditing, regulator etc. Pitch your topic with ease and precision using this Three Lines Of Defense Border Model For Internal Auditing Formats PDF. This layout presents information on Senior Management, Controlling, Control Measures. It is also available for immediate download and adjustment. So, changes can be made in the color, design, graphics or any other component to create a unique layout.
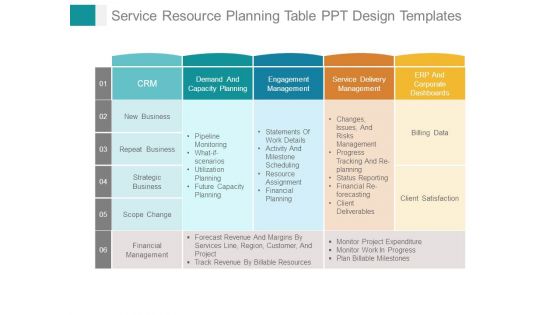
Service Resource Planning Table Ppt Design Templates
This is a service resource planning table ppt design templates. This is a six stage process. The stages in this process are demand and capacity planning, engagement management, service delivery management, erp and corporate dashboards, new business, repeat business, strategic business, scope change, financial management.
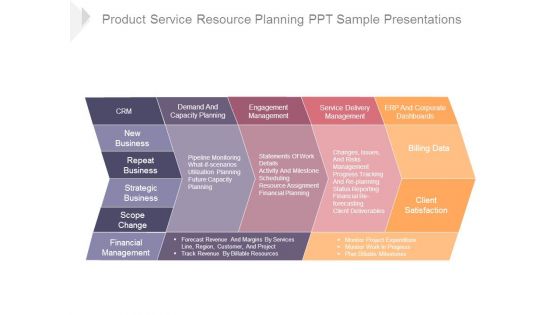
Product Service Resource Planning Ppt Sample Presentations
This is a product service resource planning ppt sample presentations. This is a five stage process. The stages in this process are scope change, strategic business, repeat business, new business, crm, demand and capacity planning, engagement management, service delivery management, erp and corporate dashboards, billing data, client satisfaction, financial management.

360 Degree Review For Employee Performance Improvement Professional PDF
This slide displays the staff performance evaluation report. It includes assessment qualities such as work consistency, productivity, concept, technical skills, etc. Pitch your topic with ease and precision using this 360 Degree Review For Employee Performance Improvement Professional PDF This layout presents information on Satisfactory, Work Consistency, Technical Skills It is also available for immediate download and adjustment. So, changes can be made in the color, design, graphics or any other component to create a unique layout.
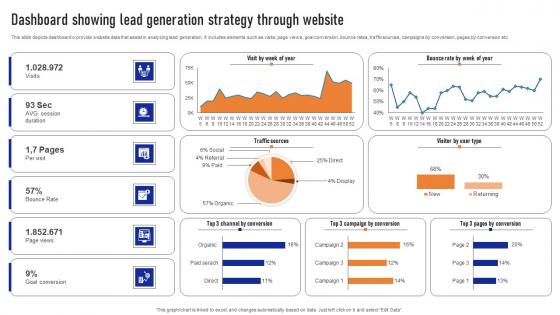
Dashboard Showing Lead Generation Strategy Through Website Ppt Infographic Template Rules Pdf
This slide depicts dashboard o provide website data that assist in analyzing lead generation. It includes elements such as visits, page views, goal conversion, bounce rates, traffic sources, campaigns by conversion, pages by conversion etc. Pitch your topic with ease and precision using this Dashboard Showing Lead Generation Strategy Through Website Ppt Infographic Template Rules Pdf. This layout presents information on Goal Conversion, Bounce Rates, Traffic Sources. It is also available for immediate download and adjustment. So, changes can be made in the color, design, graphics or any other component to create a unique layout.
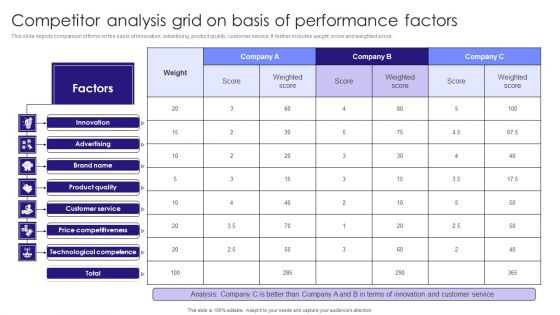
Competitor Analysis Grid On Basis Of Performance Factors Elements PDF
This slide depicts comparison of firms on the basis of innovation, advertising, product quality, customer service. It further includes weight, score and weighted score.Pitch your topic with ease and precision using this Competitor Analysis Grid On Basis Of Performance Factors Elements PDF. This layout presents information on Customer Service, Technological Competence, Product Quality. It is also available for immediate download and adjustment. So, changes can be made in the color, design, graphics or any other component to create a unique layout.

Determining Risks In Sales Administration Procedure Key Metrics To Assess Effectiveness Of Sales Pictures PDF
The following slide highlights some key performance indicators to measure the effectiveness of sales risk evaluation on revenue performance. It includes elements such as opportunities, win rate, average time to win, sales velocity along with key insights etc. This Determining Risks In Sales Administration Procedure Key Metrics To Assess Effectiveness Of Sales Pictures PDF from Slidegeeks makes it easy to present information on your topic with precision. It provides customization options, so you can make changes to the colors, design, graphics, or any other component to create a unique layout. It is also available for immediate download, so you can begin using it right away. Slidegeeks has done good research to ensure that you have everything you need to make your presentation stand out. Make a name out there for a brilliant performance.
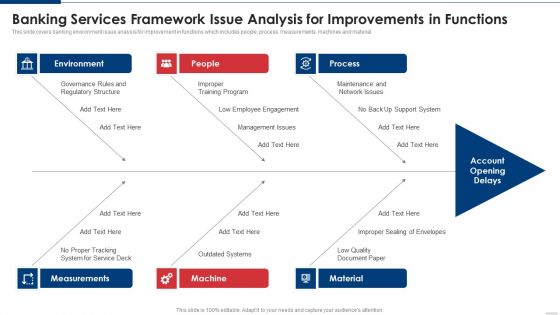
Banking Services Framework Issue Analysis For Improvements In Functions Mockup PDF
This slide covers banking environment issue analysis for improvement in functions which includes people, process, measurements, machines and material Pitch your topic with ease and precision using this Banking Services Framework Issue Analysis For Improvements In Functions Mockup PDF This layout presents information on Environment, Measurements, Employee Engagement It is also available for immediate download and adjustment. So, changes can be made in the color, design, graphics or any other component to create a unique layout.

New Software Release Roadmap Template Pdf
The following slide illustrates a roadmap for successfully launching a software product to positively influence company reputation and increase market share. It consists of various activities to be performed with a given timeline Pitch your topic with ease and precision using this New Software Release Roadmap Template Pdf This layout presents information on Business Objectives, Channel Management, Sales And Post It is also available for immediate download and adjustment. So, changes can be made in the color, design, graphics or any other component to create a unique layout.
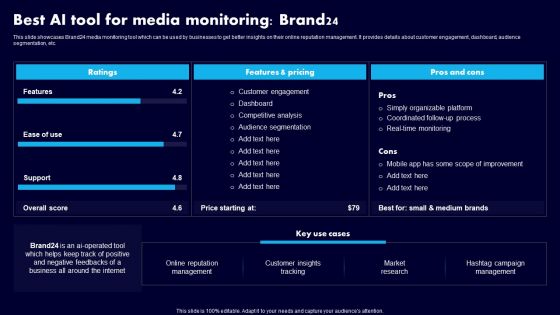
Best AI Tool For Media Monitoring Brand24 Ppt File Format PDF
This slide showcases Brand24 media monitoring tool which can be used by businesses to get better insights on their online reputation management. It provides details about customer engagement, dashboard, audience segmentation, etc. If your project calls for a presentation, then Slidegeeks is your go-to partner because we have professionally designed, easy-to-edit templates that are perfect for any presentation. After downloading, you can easily edit Best AI Tool For Media Monitoring Brand24 Ppt File Format PDF and make the changes accordingly. You can rearrange slides or fill them with different images. Check out all the handy templates

Best AI Tool For Media Monitoring Brand24 Ppt Styles Background Images PDF
This slide showcases Brand24 media monitoring tool which can be used by businesses to get better insights on their online reputation management. It provides details about customer engagement, dashboard, audience segmentation, etc. If your project calls for a presentation, then Slidegeeks is your go-to partner because we have professionally designed, easy-to-edit templates that are perfect for any presentation. After downloading, you can easily edit Best AI Tool For Media Monitoring Brand24 Ppt Styles Background Images PDF and make the changes accordingly. You can rearrange slides or fill them with different images. Check out all the handy templates

Online Advertisement Campaign Dashboard Representing Converted Lead And Costs Pictures PDF
The following slide highlights the campaign promotion dashboard which highlights the top campaigns, daily impression, click rate and total costs. Pitch your topic with ease and precision using this Online Advertisement Campaign Dashboard Representing Converted Lead And Costs Pictures PDF. This layout presents information on Campaign Funnel, Interaction Cost, Growth. It is also available for immediate download and adjustment. So, changes can be made in the color, design, graphics or any other component to create a unique layout.

3 Interconnected Circles To Measure Variance Ppt PowerPoint Presentation Clipart PDF
Persuade your audience using this 3 interconnected circles to measure variance ppt powerpoint presentation clipart pdf. This PPT design covers three stages, thus making it a great tool to use. It also caters to a variety of topics including run the process, measure variance, iterative changes in process. Download this PPT design now to present a convincing pitch that not only emphasizes the topic but also showcases your presentation skills.
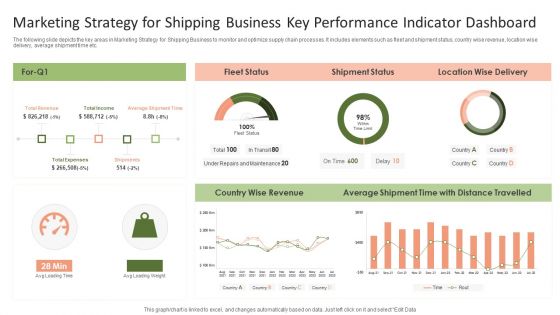
Marketing Strategy For Shipping Business Key Performance Indicator Dashboard Graphics PDF
The following slide depicts the key areas in Marketing Strategy for Shipping Business to monitor and optimize supply chain processes. It includes elements such as fleet and shipment status, country wise revenue, location wise delivery, average shipment time etc.Pitch your topic with ease and precision using this Marketing Strategy For Shipping Business Key Performance Indicator Dashboard Graphics PDF. This layout presents information on Shipment Status, Average Shipment, Wise Revenue. It is also available for immediate download and adjustment. So, changes can be made in the color, design, graphics or any other component to create a unique layout.
Business Event Return On Investment Tracking Tools And Metrics Portrait Pdf
The slide displays event ROI metrics and tools that aid in determining net value and costs contributing to an events success. It contains business goals such as brand awareness. Sales revenue, event engagement, recruitment etc. event goals, ROI metrics, ROI tools, etc. Pitch your topic with ease and precision using this Business Event Return On Investment Tracking Tools And Metrics Portrait Pdf This layout presents information on Building Brand Awareness, Driving Sales Revenue, Driving Recruitment It is also available for immediate download and adjustment. So, changes can be made in the color, design, graphics or any other component to create a unique layout.
Insurance Claim Procedure Tracking Dashboard Ppt PowerPoint Presentation Show Samples PDF
This slide showcases the insurance claim process tracking dashboard. It includes elements such as claim amount, payout and denied claims and status analysis.Pitch your topic with ease and precision using this Insurance Claim Procedure Tracking Dashboard Ppt PowerPoint Presentation Show Samples PDF. This layout presents information on Amount Comparison, Claim Expense, Assured Amount. It is also available for immediate download and adjustment. So, changes can be made in the color, design, graphics or any other component to create a unique layout.
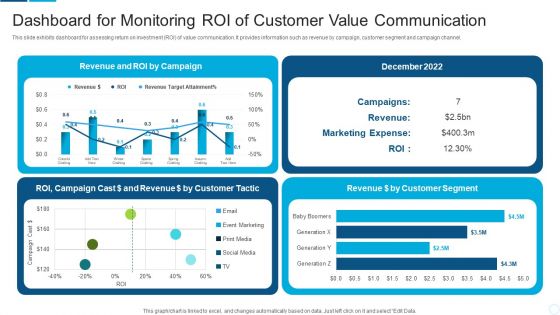
Dashboard For Monitoring Roi Of Customer Value Communication Portrait PDF
This slide exhibits dashboard for assessing return on investment ROI of value communication. It provides information such as revenue by campaign, customer segment and campaign channel. Pitch your topic with ease and precision using this dashboard for monitoring roi of customer value communication portrait pdf. This layout presents information on customer, revenue, marketing expense. It is also available for immediate download and adjustment. So, changes can be made in the color, design, graphics or any other component to create a unique layout.
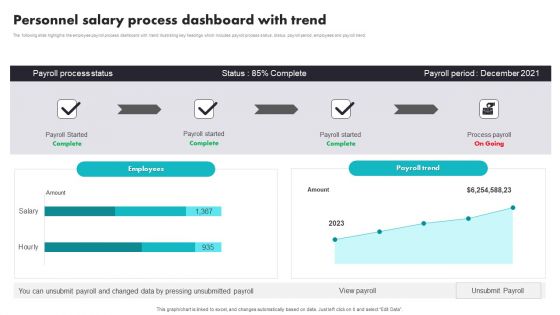
Personnel Salary Process Dashboard With Trend Brochure PDF
The following slide highlights the employee payroll process dashboard with trend illustrating key headings which includes payroll process status, status, payroll period, employees and payroll trend. Pitch your topic with ease and precision using this Personnel Salary Process Dashboard With Trend Brochure PDF. This layout presents information on Personnel Salary Process, Dashboard With Trend. It is also available for immediate download and adjustment. So, changes can be made in the color, design, graphics or any other component to create a unique layout.
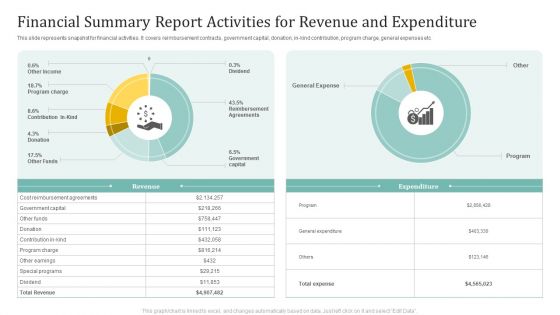
Financial Summary Report Activities For Revenue And Expenditure Ppt Inspiration Display PDF
This slide represents snapshot for financial activities. It covers reimbursement contracts, government capital, donation, in-kind contribution, program charge, general expenses etc. Pitch your topic with ease and precision using this Financial Summary Report Activities For Revenue And Expenditure Ppt Inspiration Display PDF. This layout presents information on Government Capital, Other Funds, Program Charge. It is also available for immediate download and adjustment. So, changes can be made in the color, design, graphics or any other component to create a unique layout.
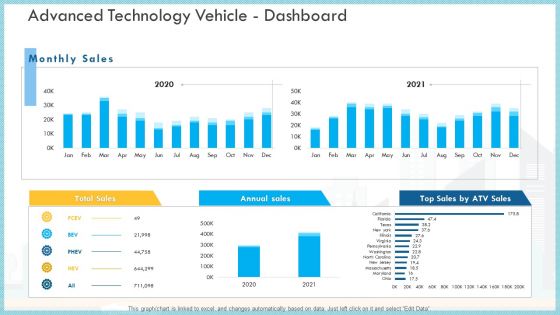
Loss Of Income And Financials Decline In An Automobile Organization Case Study Advanced Technology Vehicle Dashboard Infographics PDF
This graph or chart is linked to excel, and changes automatically based on data. Just left click on it and select Edit Data.Deliver an awe inspiring pitch with this creative loss of income and financials decline in an automobile organization case study advanced technology vehicle dashboard infographics pdf bundle. Topics like total sales, annual sales, monthly sales can be discussed with this completely editable template. It is available for immediate download depending on the needs and requirements of the user.

Talent Acquisition And Multinational Hiring KPI Dashboard Mockup PDF
The slide highlights the talent acquisition and multinational recruitment dash board depicting number of positions, open positions by location, candidate pipeline, interview and compliance.Pitch your topic with ease and precision using this Talent Acquisition And Multinational Hiring KPI Dashboard Mockup PDF This layout presents information on Candidate Ranking, Positions, Contingent It is also available for immediate download and adjustment. So, changes can be made in the color, design, graphics or any other component to create a unique layout.
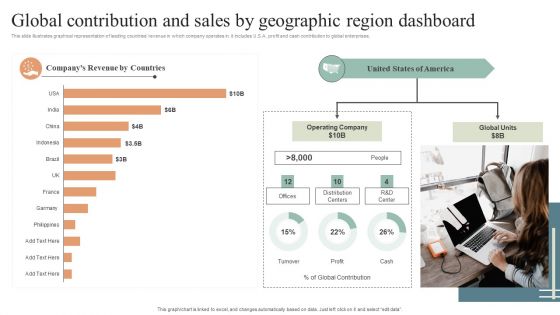
Global Contribution And Sales By Geographic Region Dashboard Diagrams PDF
This slide illustrates graphical representation of leading countries revenue in which company operates in. it includes U.S.A. profit and cash contribution to global enterprises. Pitch your topic with ease and precision using this Global Contribution And Sales By Geographic Region Dashboard Diagrams PDF. This layout presents information on Global Contribution, Sales By Geographic, Region Dashboard. It is also available for immediate download and adjustment. So, changes can be made in the color, design, graphics or any other component to create a unique layout.
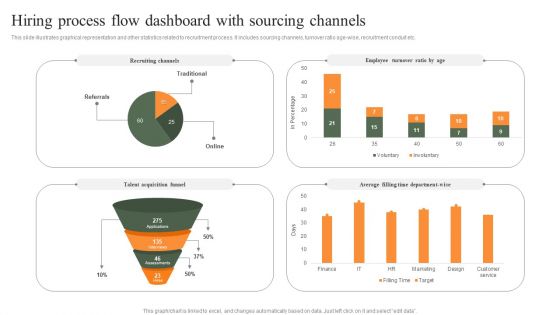
Hiring Process Flow Dashboard With Sourcing Channels Professional PDF
This slide illustrates graphical representation and other statistics related to recruitment process. It includes sourcing channels, turnover ratio age-wise, recruitment conduit etc. Pitch your topic with ease and precision using this Hiring Process Flow Dashboard With Sourcing Channels Professional PDF. This layout presents information on Employee Turnover Ratio, Recruiting Channels, Average. It is also available for immediate download and adjustment. So, changes can be made in the color, design, graphics or any other component to create a unique layout.
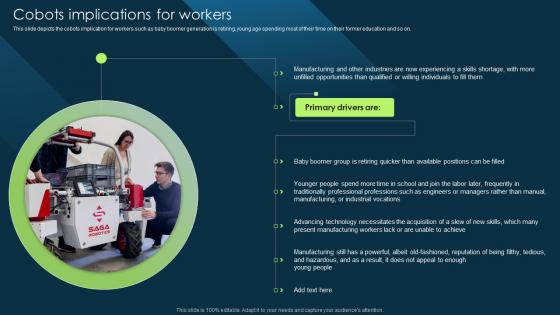
Cobots Implications For Workers Cobot Safety Measures And Risk Elements PDF
This slide depicts the cobots implication for workers such as baby boomer generation is retiring, young age spending most of their time on their former education and so on. Present like a pro with Cobots Implications For Workers Cobot Safety Measures And Risk Elements PDF Create beautiful presentations together with your team, using our easy-to-use presentation slides. Share your ideas in real-time and make changes on the fly by downloading our templates. So whether you are in the office, on the go, or in a remote location, you can stay in sync with your team and present your ideas with confidence. With Slidegeeks presentation got a whole lot easier. Grab these presentations today.
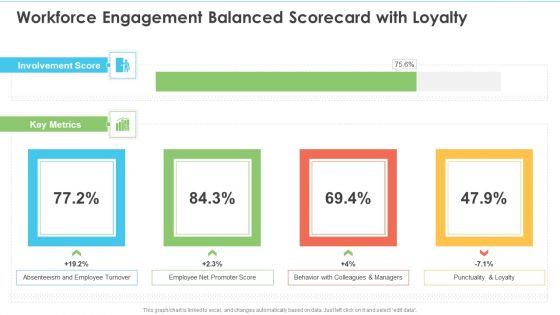
Workforce Engagement Balanced Scorecard With Loyalty Ppt Styles Good PDF
This graph or chart is linked to excel, and changes automatically based on data. Just left click on it and select edit data. Deliver an awe inspiring pitch with this creative Workforce Engagement Balanced Scorecard With Loyalty Ppt Styles Good PDF bundle. Topics like Involvement Score, Key Metrics, Employee Turnover can be discussed with this completely editable template. It is available for immediate download depending on the needs and requirements of the user.

Infrastructure As A Service Dashboard To Configure Incidents By Compliance Standards Rules Pdf
This slide depicts IaaS dashboard to configure incidents by compliance standards. It includes various factors such as resource compliance alignment, non compliant resource accounts, policies with high incidents, unsolved security configuration incidents etc. Pitch your topic with ease and precision using this Infrastructure As A Service Dashboard To Configure Incidents By Compliance Standards Rules Pdf. This layout presents information on Resource Compliance Alignment, Across Providers, Top Non Compliant, Resource Accounts. It is also available for immediate download and adjustment. So, changes can be made in the color, design, graphics or any other component to create a unique layout.
Kaizen Process Report With Improvement Metrics Ppt PowerPoint Presentation File Icons PDF
This slide focuses on the kaizen event report which covers process owner, key performance indicators, summary, problem description, improvement metrics, goals, daily milestones, team members and other considerations, etc. Pitch your topic with ease and precision using this Kaizen Process Report With Improvement Metrics Ppt PowerPoint Presentation File Icons PDF. This layout presents information on Key Performance Indoctrinator, Improvement Goal, Improvement Metric. It is also available for immediate download and adjustment. So, changes can be made in the color, design, graphics or any other component to create a unique layout.
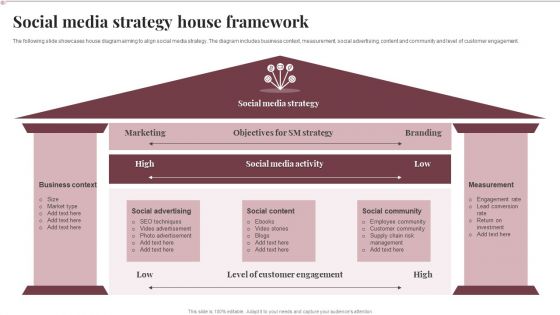
Social Media Strategy House Framework Graphics PDF
The following slide showcases house diagram aiming to align social media strategy. The diagram includes business context, measurement, social advertising, content and community and level of customer engagement. Pitch your topic with ease and precision using this Social Media Strategy House Framework Graphics PDF. This layout presents information on Social Advertising, Social Content, Social Community. It is also available for immediate download and adjustment. So, changes can be made in the color, design, graphics or any other component to create a unique layout.
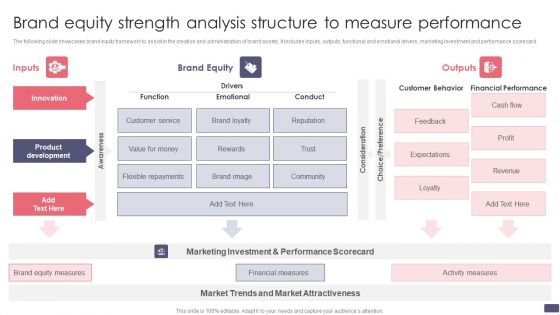
Brand Equity Strength Analysis Structure To Measure Performance Sample PDF
The following slide showcases brand equity framework to assist in the creation and administration of brand assets. It includes inputs, outputs, functional and emotional drivers, marketing investment and performance scorecard. Pitch your topic with ease and precision using this Brand Equity Strength Analysis Structure To Measure Performance Sample PDF. This layout presents information on Product Development, Innovation, Brand Loyalty. It is also available for immediate download and adjustment. So, changes can be made in the color, design, graphics or any other component to create a unique layout.
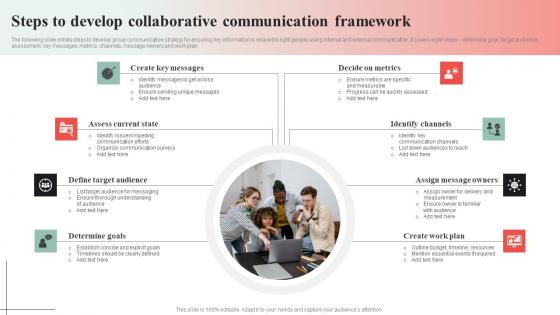
Steps To Develop Collaborative Communication Framework Guidelines Pdf
The following slide enlists steps to develop group communication strategy for ensuring key information is relayed to right people using internal and external communication. It covers eight steps determine goal, target audience, assessment, key messages, metrics, channels, message owners and work plan Pitch your topic with ease and precision using this Steps To Develop Collaborative Communication Framework Guidelines Pdf This layout presents information on Assess Current State, Decide On Metrics, Identify Channels It is also available for immediate download and adjustment. So, changes can be made in the color, design, graphics or any other component to create a unique layout.

Firm Task Status Dashboard With Milestones Ppt Show Sample PDF
This graph or chart is linked to excel, and changes automatically based on data. Just left click on it and select Edit Data. Showcasing this set of slides titled Firm Task Status Dashboard With Milestones Ppt Show Sample PDF. The topics addressed in these templates are Tasks Completed, Planned, Work Progress, Overall Project ROI. All the content presented in this PPT design is completely editable. Download it and make adjustments in color, background, font etc. as per your unique business setting.

KPI Metrics To Track Effectiveness Of Sourcing Raw Material Process Portrait PDF
Following slide shows the multiple key performance indicators KPI which will assist firms to evaluate the success of procurement process. The metrics outlined in the slide are compliance rate, purchase order cycle time, supplier quality rating, supplier defect rate, and procurement return on investment ROI. Pitch your topic with ease and precision using this KPI Metrics To Track Effectiveness Of Sourcing Raw Material Process Portrait PDF. This layout presents information on Purchase Order Cycle Time, Supplier Defect Rate, Procurement Roi. It is also available for immediate download and adjustment. So, changes can be made in the color, design, graphics or any other component to create a unique layout.

Guide To Healthcare Services Administration KPI Metrics Dashboard To Measure Effectiveness Healthcare Information PDF
The following slide showcases key performance indicator KPI metrics dashboard which can be used to evaluate the success rate of healthcare recruitment. It covers information about technical and non-technical hiring, recruitment costs, current hiring pipeline etc. This Guide To Healthcare Services Administration KPI Metrics Dashboard To Measure Effectiveness Healthcare Information PDF from Slidegeeks makes it easy to present information on your topic with precision. It provides customization options, so you can make changes to the colors, design, graphics, or any other component to create a unique layout. It is also available for immediate download, so you can begin using it right away. Slidegeeks has done good research to ensure that you have everything you need to make your presentation stand out. Make a name out there for a brilliant performance.
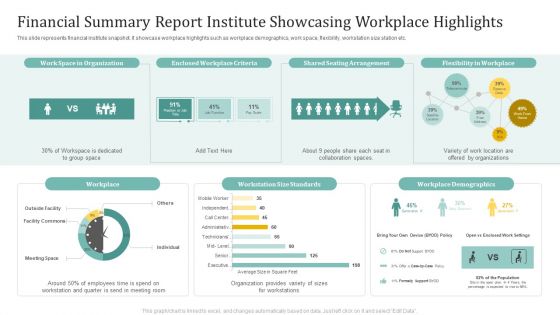
Financial Summary Report Institute Showcasing Workplace Highlights Ppt Infographics Inspiration PDF
This slide represents financial institute snapshot. It showcase workplace highlights such as workplace demographics, work space, flexibility, workstation size station etc. Pitch your topic with ease and precision using this Financial Summary Report Institute Showcasing Workplace Highlights Ppt Infographics Inspiration PDF. This layout presents information on Shared Seating Arrangement, Flexibility Workplace, Workplace. It is also available for immediate download and adjustment. So, changes can be made in the color, design, graphics or any other component to create a unique layout.

Multiplayer Startup Online Business Simulation Dashboard Demonstration PDF
This slide showcases multiplier startup business simulation dashboard. It provides information about individuals, statistics, team processes, adoption, effectiveness, meetings, alignment, communication, etc. Pitch your topic with ease and precision using this Multiplayer Startup Online Business Simulation Dashboard Demonstration PDF. This layout presents information on Individuals, Team Processes, Statistics. It is also available for immediate download and adjustment. So, changes can be made in the color, design, graphics or any other component to create a unique layout.
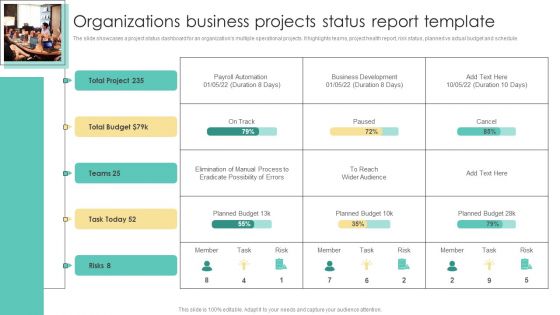
Organizations Business Projects Status Report Template Diagrams PDF
The slide showcases a project status dashboard for an organizations multiple operational projects. It highlights teams, project health report, risk status, planned vs actual budget and schedule. Pitch your topic with ease and precision using this Organizations Business Projects Status Report Template Diagrams PDF. This layout presents information on Organizations Business, Projects Status, Report. It is also available for immediate download and adjustment. So, changes can be made in the color, design, graphics or any other component to create a unique layout.
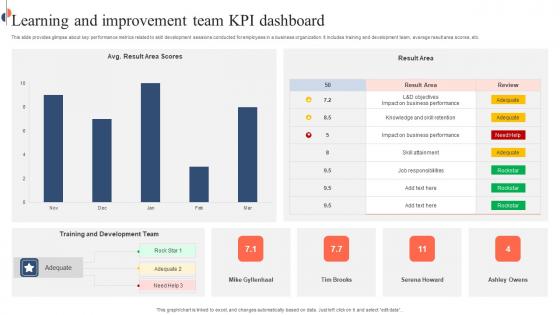
Learning And Improvement Team KPI Dashboard Slides Pdf
This slide provides glimpse about key performance metrics related to skill development sessions conducted for employees in a business organization. It includes training and development team, average result area scores, etc. Pitch your topic with ease and precision using this Learning And Improvement Team KPI Dashboard Slides Pdf. This layout presents information on Learning And Improvement Team, KPI Dashboard, Development Team. It is also available for immediate download and adjustment. So, changes can be made in the color, design, graphics or any other component to create a unique layout.
Naas Integrated Solution IT Network As A Service Performance Tracking Dashboard Formats PDF
This slide represents the performance tracking dashboard for Naas, covering service availability, inventory details, software compliance status, service level agreement, alert notifications, number of changes and incidents. Deliver an awe inspiring pitch with this creative Naas Integrated Solution IT Network As A Service Performance Tracking Dashboard Formats PDF bundle. Topics like Network As A Service, Performance Tracking Dashboard can be discussed with this completely editable template. It is available for immediate download depending on the needs and requirements of the user.
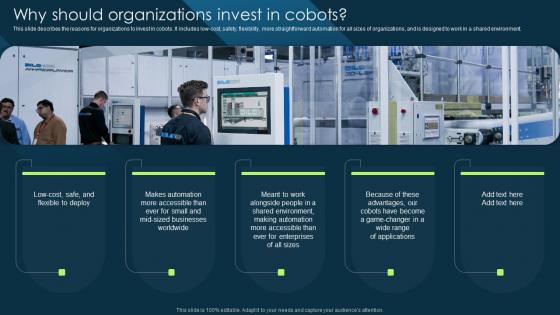
Why Should Organizations Invest In Cobots Cobot Safety Measures And Risk Formats PDF
This slide describes the reasons for organizations to invest in cobots. It includes low-cost, safety, flexibility, more straightforward automation for all sizes of organizations, and is designed to work in a shared environment. This Why Should Organizations Invest In Cobots Cobot Safety Measures And Risk Formats PDF from Slidegeeks makes it easy to present information on your topic with precision. It provides customization options, so you can make changes to the colors, design, graphics, or any other component to create a unique layout. It is also available for immediate download, so you can begin using it right away. Slidegeeks has done good research to ensure that you have everything you need to make your presentation stand out. Make a name out there for a brilliant performance.
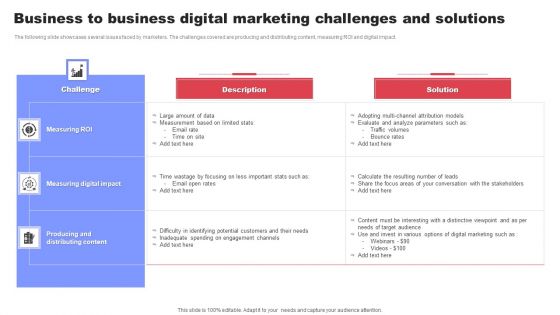
Business To Business Digital Marketing Challenges And Solutions Ppt Styles Templates PDF
The following slide showcases several issues faced by marketers. The challenges covered are producing and distributing content, measuring ROI and digital impact. Pitch your topic with ease and precision using this Business To Business Digital Marketing Challenges And Solutions Ppt Styles Templates PDF. This layout presents information on Challenge, Measuring ROI, Measuring Digital Impact. It is also available for immediate download and adjustment. So, changes can be made in the color, design, graphics or any other component to create a unique layout.
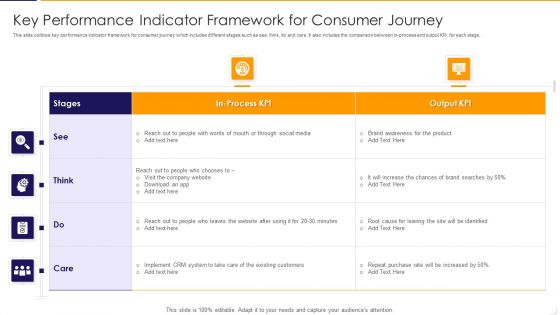
Key Performance Indicator Framework For Consumer Journey Ppt PowerPoint Presentation Gallery Good PDF
This slide outlines key performance indicator framework for consumer journey which includes different stages such as see, think, do and care. It also includes the comparison between in process and output KPI for each stage. Pitch your topic with ease and precision using this key performance indicator framework for consumer journey ppt powerpoint presentation gallery good pdf This layout presents information on social media, system, implement. It is also available for immediate download and adjustment. So, changes can be made in the color, design, graphics or any other component to create a unique layout.
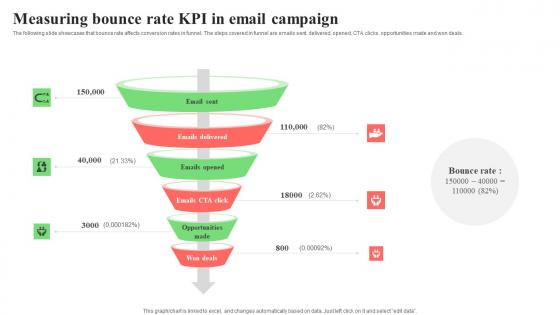
Measuring Bounce Rate KPI In Email Campaign Designs Pdf
The following slide showcases that bounce rate affects conversion rates in funnel. The steps covered in funnel are emails sent, delivered, opened, CTA clicks, opportunities made and won deals. Pitch your topic with ease and precision using this Measuring Bounce Rate KPI In Email Campaign Designs Pdf. This layout presents information on Delivered, Opened, CTA Clicks, Opportunities. It is also available for immediate download and adjustment. So, changes can be made in the color, design, graphics or any other component to create a unique layout.

Facial Coding Technology Used To Measure Customer Driven Digital Marketing Guidelines Pdf
This slide represents facial coding technology is used in neuromarketing with aim to gather insights regarding customer emotions. It includes details such as advertisement effectiveness, product packaging etc. Present like a pro with Facial Coding Technology Used To Measure Customer Driven Digital Marketing Guidelines Pdf Create beautiful presentations together with your team, using our easy-to-use presentation slides. Share your ideas in real-time and make changes on the fly by downloading our templates. So whether you are in the office, on the go, or in a remote location, you can stay in sync with your team and present your ideas with confidence. With Slidegeeks presentation got a whole lot easier. Grab these presentations today.

Summary Financial Accounting Statement Profit And Loss Analysis Dashboard Elements PDF
This graph or chart is linked to excel, and changes automatically based on data. Just left click on it and select Edit Data. Deliver an awe inspiring pitch with this creative Summary Financial Accounting Statement Profit And Loss Analysis Dashboard Elements PDF bundle. Topics like P And L Structure Dynamics, Dupont Rations, Debt Coverage Ratios, Creditworthiness Assessment can be discussed with this completely editable template. It is available for immediate download depending on the needs and requirements of the user.

Comparative Analysis Of Web Application Performance Assessment Tools Diagrams PDF
This slide displays performance inspection tools used by businesses for web application to optimize user experience. It includes elements such as tools, prices, features, competences, platforms and comments. Pitch your topic with ease and precision using this Comparative Analysis Of Web Application Performance Assessment Tools Diagrams PDF. This layout presents information on Devices, Optimize, Metrics. It is also available for immediate download and adjustment. So, changes can be made in the color, design, graphics or any other component to create a unique layout.

 Home
Home