It Change Management Kpis
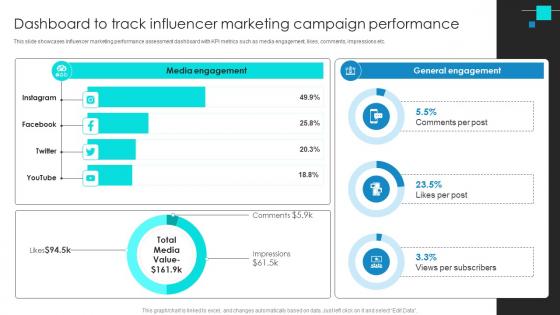
Project Benchmarking Process Dashboard To Track Influencer Marketing Campaign CRP DK SS V
This slide showcases influencer marketing performance assessment dashboard with KPI metrics such as media engagement, likes, comments, impressions etc. If your project calls for a presentation, then Slidegeeks is your go-to partner because we have professionally designed, easy-to-edit templates that are perfect for any presentation. After downloading, you can easily edit Project Benchmarking Process Dashboard To Track Influencer Marketing Campaign CRP DK SS V and make the changes accordingly. You can rearrange slides or fill them with different images. Check out all the handy templates
Agile Product Development Tracking User Stories Across Agile Project Development Icons PDF
This slide provides information regarding dashboard for tracking user stories across agile project development including work items, etc. If your project calls for a presentation, then Slidegeeks is your go-to partner because we have professionally designed, easy-to-edit templates that are perfect for any presentation. After downloading, you can easily edit Agile Product Development Tracking User Stories Across Agile Project Development Icons PDF and make the changes accordingly. You can rearrange slides or fill them with different images. Check out all the handy templates.
Building Construction Project Progress Report Map Icon Professional PDF
This slide defines the dashboard for analyzing the status of a building constructing project. It includes information related to progress, cost breakdown, budget and work schedule. Pitch your topic with ease and precision using this Building Construction Project Progress Report Map Icon Professional PDF. This layout presents information on Design Build, Project Start, Project End. It is also available for immediate download and adjustment. So, changes can be made in the color, design, graphics or any other component to create a unique layout.

Manufactured Products Sales Performance Monitoring Dashboard Information PDF
This slide shows the dashboard the data related to the sales performance of the products manufactured by the organization in order to effectively measure and monitor the performance of the sales team. It shows details related to revenue generated and units sold etc.Pitch your topic with ease and precision using this Manufactured Products Sales Performance Monitoring Dashboard Information PDF. This layout presents information on Monthly Revenue, Manufactured Products, Sales Performance Monitoring. It is also available for immediate download and adjustment. So, changes can be made in the color, design, graphics or any other component to create a unique layout.
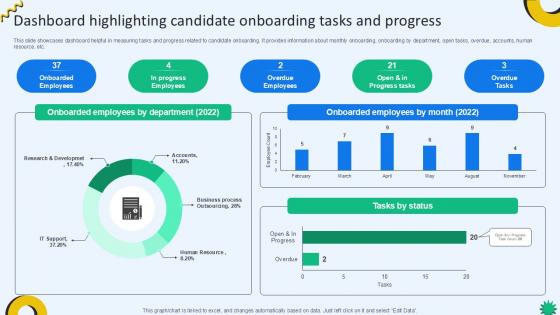
Dashboard Highlighting Candidate Cloud Recruiting Technologies PPT Sample
This slide showcases dashboard helpful in measuring tasks and progress related to candidate onboarding. It provides information about monthly onboarding, onboarding by department, open tasks, overdue, accounts, human resource, etc. Present like a pro with Dashboard Highlighting Candidate Cloud Recruiting Technologies PPT Sample. Create beautiful presentations together with your team, using our easy-to-use presentation slides. Share your ideas in real-time and make changes on the fly by downloading our templates. So whether you are in the office, on the go, or in a remote location, you can stay in sync with your team and present your ideas with confidence. With Slidegeeks presentation got a whole lot easier. Grab these presentations today.

Table Of Contents Manufacturing Quality Assurance And Control Measures Graphics PDF
Present like a pro with Table Of Contents Manufacturing Quality Assurance And Control Measures Graphics PDF Create beautiful presentations together with your team, using our easy-to-use presentation slides. Share your ideas in real-time and make changes on the fly by downloading our templates. So whether you are in the office, on the go, or in a remote location, you can stay in sync with your team and present your ideas with confidence. With Slidegeeks presentation got a whole lot easier. Grab these presentations today.
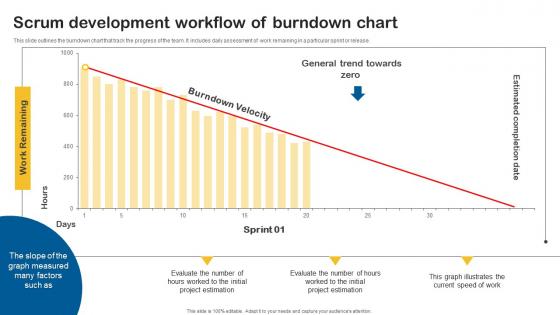
Scrum Development Workflow Of Burndown Chart Designs Pdf
This slide outlines the burndown chart that track the progress of the team. It includes daily assessment of work remaining in a particular sprint or release.Pitch your topic with ease and precision using this Scrum Development Workflow Of Burndown Chart Designs Pdf This layout presents information on Project Estimation, General Trend Towards, Graph Measured It is also available for immediate download and adjustment. So, changes can be made in the color, design, graphics or any other component to create a unique layout.
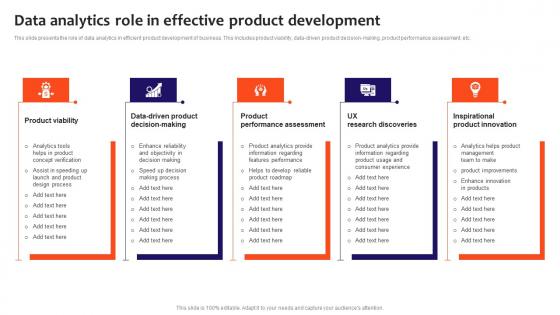
Data Analytics Role In Effective Product Development Slides Pdf
This slide presents the role of data analytics in efficient product development of business. This includes product viability, data driven product decision making, product performance assessment, etc. Pitch your topic with ease and precision using this Data Analytics Role In Effective Product Development Slides Pdf. This layout presents information on Product Viability, Product Performance, Inspirational Product Innovation. It is also available for immediate download and adjustment. So, changes can be made in the color, design, graphics or any other component to create a unique layout.

Introducing Product Demonstrations For Consumer Trial Phase Analyzing Customer Elements Pdf
This slide provides glimpse about a plan to introduce product demos to help our business organization for product trial run to check how the product is going to perform in the market. It includes strategies, tasks, lead, duration, etc.If your project calls for a presentation, then Slidegeeks is your go-to partner because we have professionally designed, easy-to-edit templates that are perfect for any presentation. After downloading, you can easily edit Introducing Product Demonstrations For Consumer Trial Phase Analyzing Customer Elements Pdf and make the changes accordingly. You can rearrange slides or fill them with different images. Check out all the handy templates

Training Action Plan For Enhancing Leadership Skills Rules Pdf
This slide presents coaching action plan for leadership skills development, helpful in guiding employees professionally through authoritative path. It includes setting goals, determining training needs, recognizing opportunities and measuring success. Pitch your topic with ease and precision using this Training Action Plan For Enhancing Leadership Skills Rules Pdf. This layout presents information on Determine Skill Gaps, Recognize Opportunities. It is also available for immediate download and adjustment. So, changes can be made in the color, design, graphics or any other component to create a unique layout.
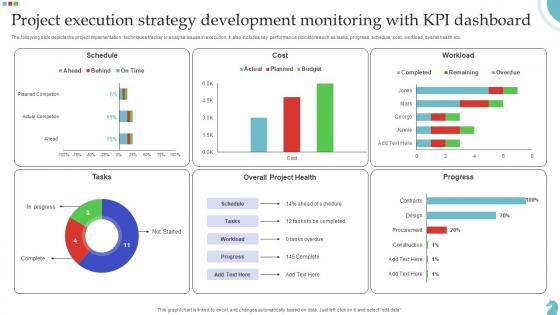
Project Execution Strategy Development Monitoring With Kpi Dashboard Download Pdf
The following slide depicts the project implementation techniques tracker to analyse issues in execution. It also includes key performance indicators such as tasks, progress, schedule, cost, workload, overall health etc. Pitch your topic with ease and precision using this Project Execution Strategy Development Monitoring With Kpi Dashboard Download Pdf. This layout presents information on Project Execution, Strategy Development, Monitoring Kpi Dashboard. It is also available for immediate download and adjustment. So, changes can be made in the color, design, graphics or any other component to create a unique layout.
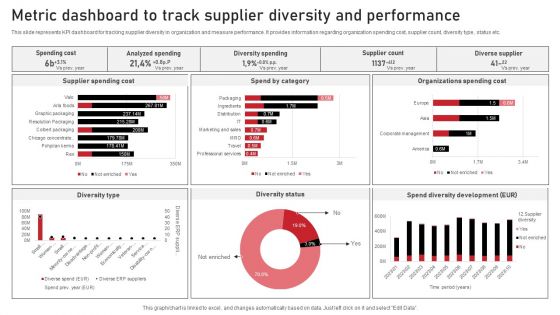
Metric Dashboard To Track Supplier Diversity And Performance Designs PDF
This slide represents KPI dashboard for tracking supplier diversity in organization and measure performance. It provides information regarding organization spending cost, supplier count, diversity type, status etc. Pitch your topic with ease and precision using this Metric Dashboard To Track Supplier Diversity And Performance Designs PDF. This layout presents information on Diversity Type, Diversity Status, Diverse Supplier. It is also available for immediate download and adjustment. So, changes can be made in the color, design, graphics or any other component to create a unique layout.
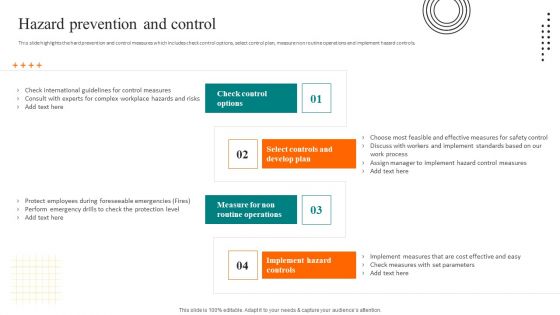
Workplace Safety Best Practices Hazard Prevention And Control Infographics PDF
This slide highlights the hard prevention and control measures which includes check control options, select control plan, measure non routine operations and implement hazard controls. If your project calls for a presentation, then Slidegeeks is your go to partner because we have professionally designed, easy to edit templates that are perfect for any presentation. After downloading, you can easily edit Workplace Safety Best Practices Hazard Prevention And Control Infographics PDF and make the changes accordingly. You can rearrange slides or fill them with different images. Check out all the handy templates
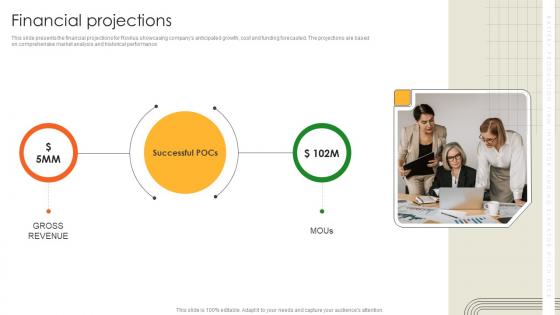
Financial Projections Battery Production Firm Investor Funding Elevator Pitch Deck
This slide presents the financial projections for Rovilus showcasing companys anticipated growth, cost and funding forecasted. The projections are based on comprehensive market analysis and historical performance. Present like a pro with Financial Projections Battery Production Firm Investor Funding Elevator Pitch Deck Create beautiful presentations together with your team, using our easy-to-use presentation slides. Share your ideas in real-time and make changes on the fly by downloading our templates. So whether you are in the office, on the go, or in a remote location, you can stay in sync with your team and present your ideas with confidence. With Slidegeeks presentation got a whole lot easier. Grab these presentations today.

Strategic Supplier Evaluation Supplier Product Quality Testing And Assessment
Mentioned slide demonstrates supplier production process and material inspection on various parameters providing points, weights for each parameter and final score. This Strategic Supplier Evaluation Supplier Product Quality Testing And Assessment from Slidegeeks makes it easy to present information on your topic with precision. It provides customization options, so you can make changes to the colors, design, graphics, or any other component to create a unique layout. It is also available for immediate download, so you can begin using it right away. Slidegeeks has done good research to ensure that you have everything you need to make your presentation stand out. Make a name out there for a brilliant performance.
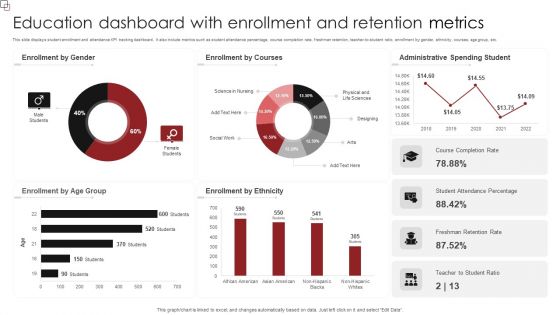
Education Dashboard With Enrollment And Retention Metrics Sample PDF
This slide displays student enrollment and attendance KPI tracking dashboard. It also include metrics such as student attendance percentage, course completion rate, freshman retention, teacher-to-student ratio, enrollment by gender, ethnicity, courses, age group, etc. Pitch your topic with ease and precision using this Education Dashboard With Enrollment And Retention Metrics Sample PDF. This layout presents information on Enrollment Gender, Enrollment Courses, Administrative Spending Student. It is also available for immediate download and adjustment. So, changes can be made in the color, design, graphics or any other component to create a unique layout.
Performance Measurement And Tracking For Sales Incentive Strategy Introduction Pdf
The following slide highlights points like role specific sales incentives, split sales, presales, omnichannel and analytics based incentives to show multiple types of sales incentive plan. It helps organizations to tailor incentive structures to align with specific roles, drive desired sales behaviors, and optimize sales performance across various channels.Pitch your topic with ease and precision using this Performance Measurement And Tracking For Sales Incentive Strategy Introduction Pdf This layout presents information on Performance Reviews, Implement Regular, Reporting Tools It is also available for immediate download and adjustment. So, changes can be made in the color, design, graphics or any other component to create a unique layout.
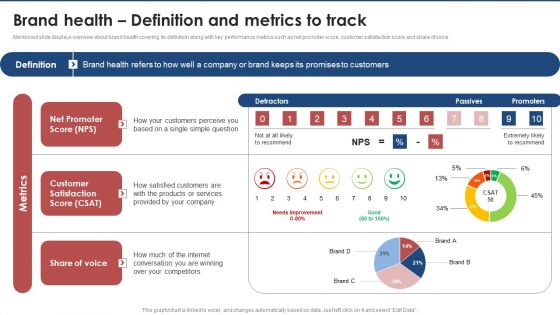
Brand Health Definition And Metrics To Track Brand Value Estimation Guide Mockup PDF
Following slide provides an overview about brand equity by covering its definition and key components such as brand loyalty, awareness, quality, association and experience.Present like a pro with Brand Health Definition And Metrics To Track Brand Value Estimation Guide Mockup PDF Create beautiful presentations together with your team, using our easy-to-use presentation slides. Share your ideas in real-time and make changes on the fly by downloading our templates. So whether you are in the office, on the go, or in a remote location, you can stay in sync with your team and present your ideas with confidence. With Slidegeeks presentation got a whole lot easier. Grab these presentations today.

Employee Incentive Strategy Based On Product Sales And Targets Rules Pdf
The following slide highlights points like motivate right sales behavior, sales commission structure , tailor incentives, benchmark against industry data, focus on plan and use technology to show developing sales incentive compensation plan. It helps organizations to optimize sales incentive programs, drive desired sales outcomes, and enhance overall sales performance.Pitch your topic with ease and precision using this Employee Incentive Strategy Based On Product Sales And Targets Rules Pdf This layout presents information on Employee Incentive, Strategy Based, Product Sales It is also available for immediate download and adjustment. So, changes can be made in the color, design, graphics or any other component to create a unique layout.
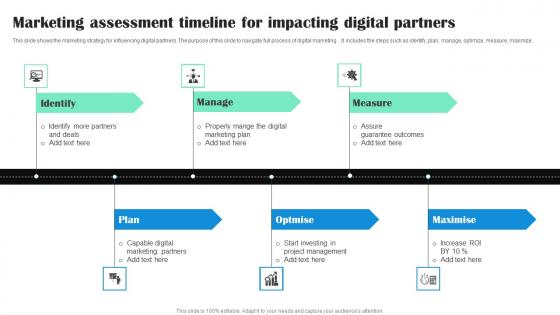
Marketing Assessment Timeline For Impacting Digital Partners Rules Pdf
This slide shows the marketing strategy for influencing digital partners .The purpose of this slide to navigate full process of digital marketing. It includes the steps such as identify, plan, manage, optimize, measure, maximize. Pitch your topic with ease and precision using this Marketing Assessment Timeline For Impacting Digital Partners Rules Pdf This layout presents information on Identify, Manage, Measure, Plan, Optmise It is also available for immediate download and adjustment. So, changes can be made in the color, design, graphics or any other component to create a unique layout.

Dashboard To Measure Robotic Process Automation Bots Performance Structure PDF
This slide presents a dashboard to measure RPA bots performance in an organization. It includes utilization hours, bot types, average daily utilization, percentage of errors that occurred by bots, and occupied bots by business operations. If your project calls for a presentation, then Slidegeeks is your go-to partner because we have professionally designed, easy-to-edit templates that are perfect for any presentation. After downloading, you can easily edit Dashboard To Measure Robotic Process Automation Bots Performance Structure PDF and make the changes accordingly. You can rearrange slides or fill them with different images. Check out all the handy templates
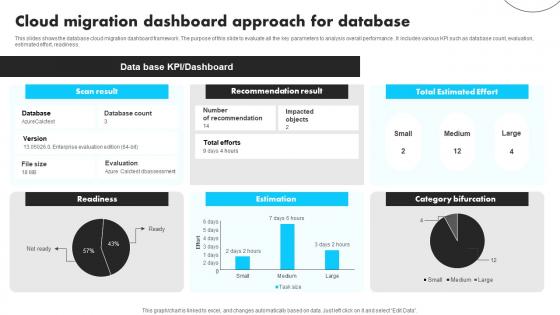
Cloud Migration Dashboard Approach For Database Guidelines Pdf
This slides shows the database cloud migration dashboard framework. The purpose of this slide to evaluate all the key parameters to analysis overall performance . It includes various KPI such as database count, evaluation, estimated effort, readiness. Pitch your topic with ease and precision using this Cloud Migration Dashboard Approach For Database Guidelines Pdf This layout presents information on Recommendation Result, Total Estimated Effort, Estimation It is also available for immediate download and adjustment. So, changes can be made in the color, design, graphics or any other component to create a unique layout.
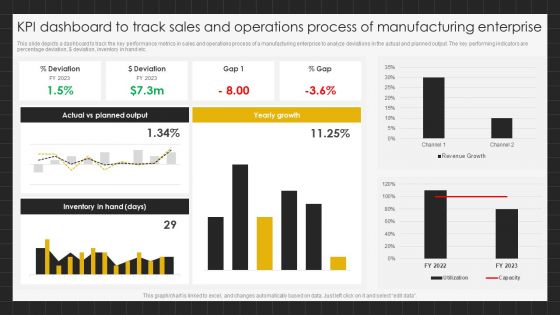
KPI Dashboard To Track Sales And Operations Process Of Manufacturing Enterprise Brochure PDF
This slide depicts a dashboard to track the key performance metrics in sales and operations process of a manufacturing enterprise to analyze deviations in the actual and planned output. The key performing indicators are percentage deviation, dollar deviation, inventory in hand etc.Pitch your topic with ease and precision using this KPI Dashboard To Track Sales And Operations Process Of Manufacturing Enterprise Brochure PDF. This layout presents information on Planned Output, Yearly Growth, Inventory Hand. It is also available for immediate download and adjustment. So, changes can be made in the color, design, graphics or any other component to create a unique layout.

Balanced Scorecard Product Leadership Strategy Mapping Inspiration PDF
The slide showcases a product leadership strategy map adopted by Kaplan and Norten strategic map that organizations opt for product leadership value proposition emphasizing on specific features. It covers four major aspects such as financial, customer, internal , learning and growth. Pitch your topic with ease and precision using this Balanced Scorecard Product Leadership Strategy Mapping Inspiration PDF. This layout presents information on Customer Perspective, Financial Perspective, Internal Perspective. It is also available for immediate download and adjustment. So, changes can be made in the color, design, graphics or any other component to create a unique layout.
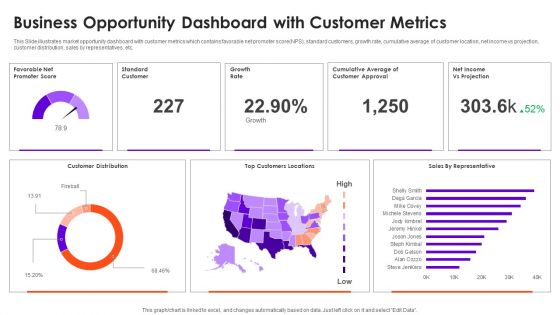
Business Opportunity Dashboard With Customer Metrics Information PDF
This Slide illustrates market opportunity dashboard with customer metrics which contains favorable net promoter score NPS, standard customers, growth rate, cumulative average of customer location, net income vs projection, customer distribution, sales by representatives, etc. Pitch your topic with ease and precision using this Business Opportunity Dashboard With Customer Metrics Information PDF. This layout presents information on Customer Distribution, Growth Rate, Top Customers Locations. It is also available for immediate download and adjustment. So, changes can be made in the color, design, graphics or any other component to create a unique layout.

Hotel Property Administration Software Dashboard Guidelines PDF
This slide showcases HPMS dashboard. The purpose of this dashboard is to access plan and performance. It includes key elements such as current in house, expected arrivals, expected departures, current status and room status. Pitch your topic with ease and precision using this Hotel Property Administration Software Dashboard Guidelines PDF. This layout presents information on Current Status, Room Status, Exchange Rates. It is also available for immediate download and adjustment. So, changes can be made in the color, design, graphics or any other component to create a unique layout.

Consumer Segmentation Dashboard For Business Intelligence Reporting Topics Pdf
This slide presents a customer segmentation dashboard for reporting real time data. It includes key components such as delighted NPS score, standard customers, growth rate, CA customer location, net income vs. projection, customer distribution, etc. Pitch your topic with ease and precision using this Consumer Segmentation Dashboard For Business Intelligence Reporting Topics Pdf. This layout presents information on Consumer Segmentation Dashboard, Business Intelligence Reporting, Growth Rate. It is also available for immediate download and adjustment. So, changes can be made in the color, design, graphics or any other component to create a unique layout.
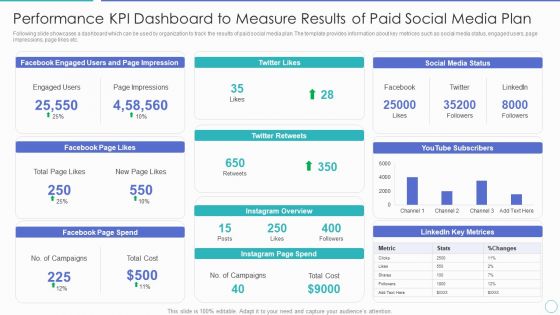
Performance KPI Dashboard To Measure Results Of Paid Social Media Plan Ppt PowerPoint Presentation Gallery Format Ideas PDF
Following slide showcases a dashboard which can be used by organization to track the results of paid social media plan. The template provides information about key metrices such as social media status, engaged users, page impressions, page likes etc. Pitch your topic with ease and precision using this performance kpi dashboard to measure results of paid social media plan ppt powerpoint presentation gallery format ideas pdf. This layout presents information on social media status, instagram page spend, facebook page spend, facebook page likes. It is also available for immediate download and adjustment. So, changes can be made in the color, design, graphics or any other component to create a unique layout.

Monthly Financial Metrics Graph With Operating Profit And Cost Of Goods Sold Pictures PDF
This slide showcases monthly analytics for to keep company finances organized and identify problem areas. It further includes details about marketing, professional fees, COGS and other operations. Pitch your topic with ease and precision using this Monthly Financial Metrics Graph With Operating Profit And Cost Of Goods Sold Pictures PDF. This layout presents information on Key Insights, Operating Profit, Total Revenue. It is also available for immediate download and adjustment. So, changes can be made in the color, design, graphics or any other component to create a unique layout.

Digital Marketing Project Weekly Status Update Summary Document Mockup PDF
This slide represents the dashboard showing the weekly status of the digital marketing project of the organization. It shows details related to project status, manager, sponsor, schedule, execution timeline, key risks and issues of the project. Pitch your topic with ease and precision using this Digital Marketing Project Weekly Status Update Summary Document Mockup PDF. This layout presents information on Project Status, Project Manager, Execution Timeline. It is also available for immediate download and adjustment. So, changes can be made in the color, design, graphics or any other component to create a unique layout.
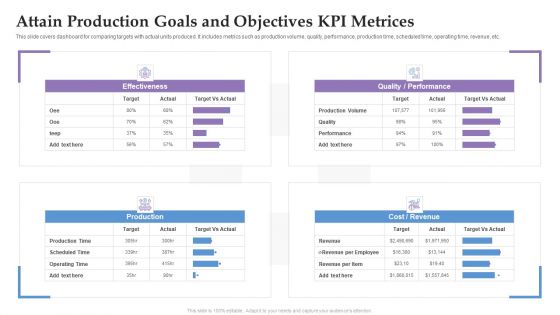
Attain Production Goals And Objectives KPI Metrices Ppt Summary Format Ideas PDF
This slide covers dashboard for comparing targets with actual units produced. It includes metrics such as production volume, quality, performance, production time, scheduled time, operating time, revenue, etc. Pitch your topic with ease and precision using this Attain Production Goals And Objectives KPI Metrices Ppt Summary Format Ideas PDF. This layout presents information on Production, Cost, Revenue, Performance. It is also available for immediate download and adjustment. So, changes can be made in the color, design, graphics or any other component to create a unique layout.

Production To Increase Operational Techniques Efficiency With Smart Manufacturing Designs Pdf
This slide consists of strategies to increase operational efficiency by integrating smart technologies in manufacturing enterprise. The key elements covered are business goals, strategy, tools and benefits Pitch your topic with ease and precision using this Production To Increase Operational Techniques Efficiency With Smart Manufacturing Designs Pdf This layout presents information on Equipment Performance, Workforce Productivity, Business Process It is also available for immediate download and adjustment. So, changes can be made in the color, design, graphics or any other component to create a unique layout.

Organization Structure Hero Bike Company Profile CP SS V
Following slides demonstrate company organisation structure comprising departments such as engineering, production, quality, finance warehouse, purchasing, business, etc. This Organization Structure Hero Bike Company Profile CP SS V from Slidegeeks makes it easy to present information on your topic with precision. It provides customization options, so you can make changes to the colors, design, graphics, or any other component to create a unique layout. It is also available for immediate download, so you can begin using it right away. Slidegeeks has done good research to ensure that you have everything you need to make your presentation stand out. Make a name out there for a brilliant performance.

Metrics To Track Amazon Marketing Techniques Performance Ideas PDF
The slides show current year results and objectives for next years for various product awareness metrics such as brand impression, website traffic, social media engagement, new lead generation, number of product sold, etc. Pitch your topic with ease and precision using this Metrics To Track Amazon Marketing Techniques Performance Ideas PDF. This layout presents information on Metrics, Performance, Techniques. It is also available for immediate download and adjustment. So, changes can be made in the color, design, graphics or any other component to create a unique layout.
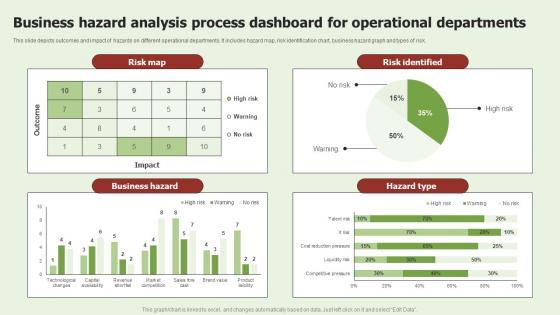
Business Hazard Analysis Process Dashboard For Operational Departments Microsoft Pdf
This slide depicts outcomes and impact of hazards on different operational departments. It includes hazard map, risk identification chart, business hazard graph and types of risk. Pitch your topic with ease and precision using this Business Hazard Analysis Process Dashboard For Operational Departments Microsoft Pdf. This layout presents information on Risk Map, Business Hazard, Hazard Type. It is also available for immediate download and adjustment. So, changes can be made in the color, design, graphics or any other component to create a unique layout.
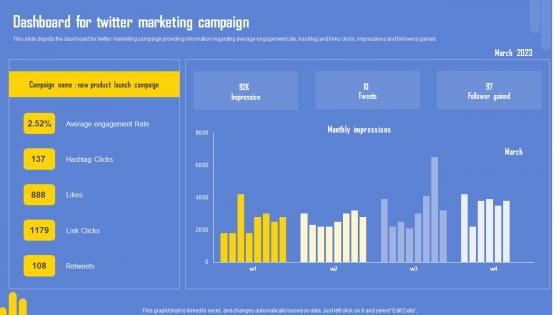
Optimizing Twitter For Online Dashboard For Twitter Marketing Campaign Download Pdf
This slide depicts the dashboard for twitter marketing campaign providing information regarding average engagement rate, hashtag and links clicks, impressions and followers gained. Present like a pro with Optimizing Twitter For Online Dashboard For Twitter Marketing Campaign Download Pdf Create beautiful presentations together with your team, using our easy-to-use presentation slides. Share your ideas in real-time and make changes on the fly by downloading our templates. So whether you are in the office, on the go, or in a remote location, you can stay in sync with your team and present your ideas with confidence. With Slidegeeks presentation got a whole lot easier. Grab these presentations today.

Dashboards Track Diversity Inclusion Administering Diversity And Inclusion At Workplace Template Pdf
The performance tracker includes parameters to check diversion and inclusion through gender distribution ratio, hires by gender percentage, turnover by gender, ethnicity distribution etc. Present like a pro with Dashboards Track Diversity Inclusion Administering Diversity And Inclusion At Workplace Template Pdf Create beautiful presentations together with your team, using our easy to use presentation slides. Share your ideas in real time and make changes on the fly by downloading our templates. So whether you are in the office, on the go, or in a remote location, you can stay in sync with your team and present your ideas with confidence. With Slidegeeks presentation got a whole lot easier. Grab these presentations today.
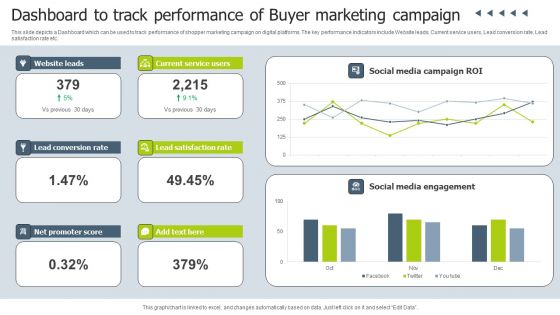
Dashboard To Track Performance Of Buyer Marketing Campaign Infographics PDF
This slide depicts a Dashboard which can be used to track performance of shopper marketing campaign on digital platforms. The key performance indicators include Website leads, Current service users, Lead conversion rate, Lead satisfaction rate etc. Pitch your topic with ease and precision using this Dashboard To Track Performance Of Buyer Marketing Campaign Infographics PDF. This layout presents information on Social Media Campaign, Social Media Engagement, Current Service Users. It is also available for immediate download and adjustment. So, changes can be made in the color, design, graphics or any other component to create a unique layout.
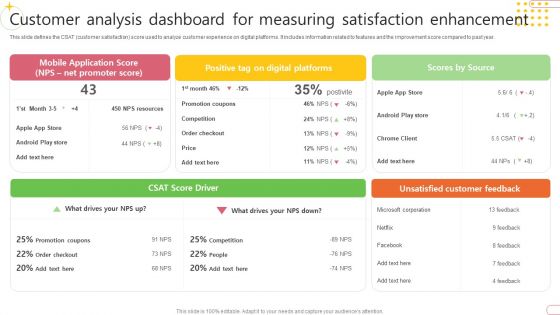
Customer Analysis Dashboard For Measuring Satisfaction Enhancement Microsoft PDF
This slide defines the CSAT customer satisfaction score used to analyze customer experience on digital platforms. It includes information related to features and the improvement score compared to past year. Pitch your topic with ease and precision using this Customer Analysis Dashboard For Measuring Satisfaction Enhancement Microsoft PDF. This layout presents information on Net Promoter, Customer Satisfaction, Very Unsatisfied. It is also available for immediate download and adjustment. So, changes can be made in the color, design, graphics or any other component to create a unique layout.
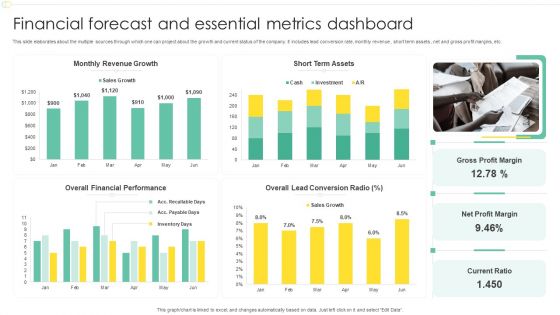
Financial Forecast And Essential Metrics Dashboard Ppt File Show PDF
This slide elaborates about the multiple sources through which one can project about the growth and current status of the company. It includes lead conversion rate, monthly revenue , short term assets , net and gross profit margins, etc. Pitch your topic with ease and precision using this Financial Forecast And Essential Metrics Dashboard Ppt File Show PDF. This layout presents information on Monthly Revenue Growth, Short Term Assets, Overall Financial Performance, Net Profit Margin. It is also available for immediate download and adjustment. So, changes can be made in the color, design, graphics or any other component to create a unique layout.
Cloud Computing Scalability Cloud Performance Tracking Dashboard Clipart PDF
This slide covers the Key performance indicators for tracking performance of the cloud such as violations break down, sources, rules and severity Present like a pro with Cloud Computing Scalability Cloud Performance Tracking Dashboard Clipart PDF Create beautiful presentations together with your team, using our easy-to-use presentation slides. Share your ideas in real-time and make changes on the fly by downloading our templates. So whether youre in the office, on the go, or in a remote location, you can stay in sync with your team and present your ideas with confidence. With Slidegeeks presentation got a whole lot easier. Grab these presentations today.
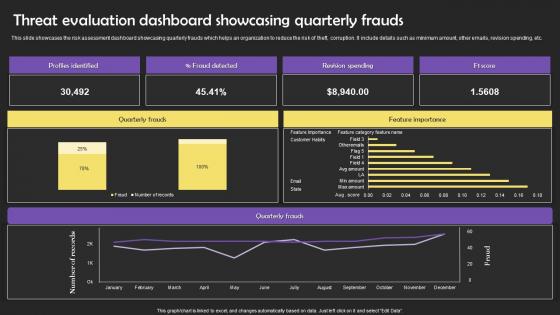
Threat Evaluation Dashboard Showcasing Quarterly Frauds Slides Pdf
This slide showcases the risk assessment dashboard showcasing quarterly frauds which helps an organization to reduce the risk of theft, corruption. It include details such as minimum amount, other emails, revision spending, etc. Pitch your topic with ease and precision using this Threat Evaluation Dashboard Showcasing Quarterly Frauds Slides Pdf This layout presents information on Threat Evaluation Dashboard Showcasing Quarterly Frauds Slides Pdf It is also available for immediate download and adjustment. So, changes can be made in the color, design, graphics or any other component to create a unique layout.
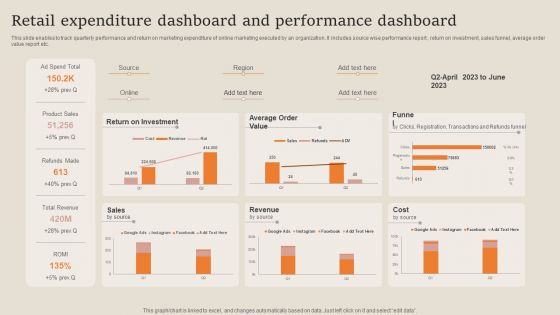
Retail Expenditure Dashboard And Performance Dashboard Formats PDF
This slide enables to track quarterly performance and return on marketing expenditure of online marketing executed by an organization. It includes source wise performance report , return on investment, sales funnel, average order value report etc. Pitch your topic with ease and precision using this Retail Expenditure Dashboard And Performance Dashboard Formats PDF. This layout presents information on Return On Investment, Product Sales, Revenue. It is also available for immediate download and adjustment. So, changes can be made in the color, design, graphics or any other component to create a unique layout.
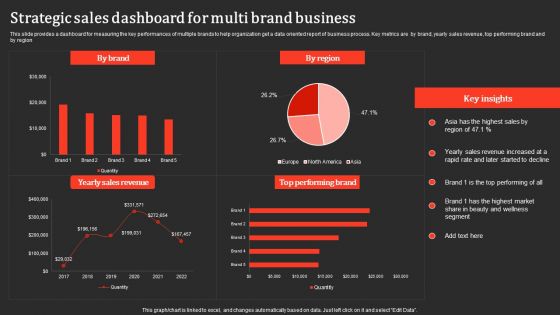
Strategic Sales Dashboard For Multi Brand Business Professional PDF
This slide provides a dashboard for measuring the key performances of multiple brands to help organization get a data oriented report of business process. Key metrics are by brand, yearly sales revenue, top performing brand and by region. Pitch your topic with ease and precision using this Strategic Sales Dashboard For Multi Brand Business Professional PDF. This layout presents information on Yearly Sales Revenue, Performing Brand. It is also available for immediate download and adjustment. So, changes can be made in the color, design, graphics or any other component to create a unique layout.

Competency Skill Mapping Dashboard Of Employees Formats Pdf
This slide shows the employee competency skill mapping dashboard .The purpose of this slides to analyze the employee skill gaps which hamper the organization targets .It includes various KPI such as specialization, employee count, head count, etc. Pitch your topic with ease and precision using this Competency Skill Mapping Dashboard Of Employees Formats Pdf This layout presents information on Employee Specialization, Building Specializations, Specialization It is also available for immediate download and adjustment. So, changes can be made in the color, design, graphics or any other component to create a unique layout.

Financial Projecting Dashboard With Various KPI Themes Pdf
Following slide showcasing the dashboard on financial planning of an organization to generate maximum of revenue by reducing their cost. The KPI such as waterfall statement , income and expenditure, payable accounts , etc . Pitch your topic with ease and precision using this Financial Projecting Dashboard With Various KPI Themes Pdf. This layout presents information on Income Budget, Expenses Budget, Net Profit Margin. It is also available for immediate download and adjustment. So, changes can be made in the color, design, graphics or any other component to create a unique layout.

Kpi Dashboard For Human Resource Ultimate Guide To Employee Succession Planning Topics PDF
Mentioned slide shows key performance indicator dashboard for human resource. Metrics covered in the dashboard are headcount by seniority and gender, open positions, headcount, termination, hires and turnover.Present like a pro with Kpi Dashboard For Human Resource Ultimate Guide To Employee Succession Planning Topics PDF Create beautiful presentations together with your team, using our easy-to-use presentation slides. Share your ideas in real-time and make changes on the fly by downloading our templates. So whether you are in the office, on the go, or in a remote location, you can stay in sync with your team and present your ideas with confidence. With Slidegeeks presentation got a whole lot easier. Grab these presentations today.

Future B2B Saas Product Data Analytics Trends Background Pdf
This slide presents the future product analytic trends to enhance mobile app performance and B2B SaaS verticals. This includes algorithmic data analytics, opinionated analytics development, enhanced data accuracy, etc. Pitch your topic with ease and precision using this Future B2B Saas Product Data Analytics Trends Background Pdf. This layout presents information on Algorithmic Data Analytics, Opinionated Analytics Development, Enhanced Data Accuracy. It is also available for immediate download and adjustment. So, changes can be made in the color, design, graphics or any other component to create a unique layout.
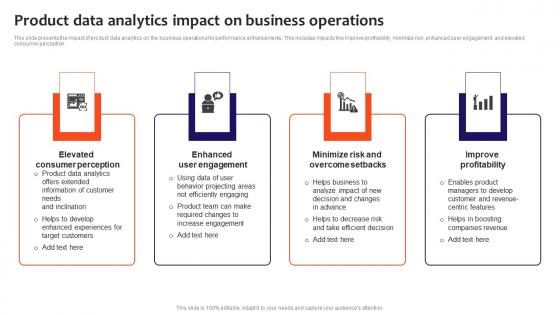
Product Data Analytics Impact On Business Operations Elements Pdf
This slide presents the impact of product data analytics on the business operations for performance enhancements. This includes impacts like improve profitability, minimize risk, enhanced user engagement, and elevated consumer perception. Pitch your topic with ease and precision using this Product Data Analytics Impact On Business Operations Elements Pdf. This layout presents information on Elevated Consumer Perception, Enhanced User Engagement, Improve Profitability. It is also available for immediate download and adjustment. So, changes can be made in the color, design, graphics or any other component to create a unique layout.

Industry Statistics Of IOT In Manufacturing Streamlining Production Ppt Sample
The following slide represents statistics pertaining to IoT manufacturing to determine new trends in industry. It includes statistics related to operations, workflows, etc. This Industry Statistics Of IOT In Manufacturing Streamlining Production Ppt Sample from Slidegeeks makes it easy to present information on your topic with precision. It provides customization options, so you can make changes to the colors, design, graphics, or any other component to create a unique layout. It is also available for immediate download, so you can begin using it right away. Slidegeeks has done good research to ensure that you have everything you need to make your presentation stand out. Make a name out there for a brilliant performance.

Performance Monitoring Dashboard Automated Regression Testing And Achieving PPT Example
This slide showcases the performance tracking dashboard for regression testing. The purpose of this slide is to highlight the performance of regression testing by including components such as execution test outcomes overall, in progress and so on. If your project calls for a presentation, then Slidegeeks is your go-to partner because we have professionally designed, easy-to-edit templates that are perfect for any presentation. After downloading, you can easily edit Performance Monitoring Dashboard Automated Regression Testing And Achieving PPT Example and make the changes accordingly. You can rearrange slides or fill them with different images. Check out all the handy templates
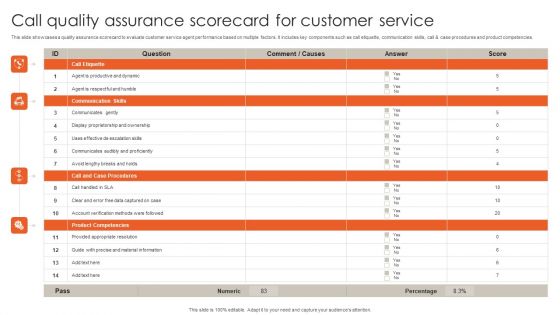
Call Quality Assurance Scorecard For Customer Service Information PDF

Four Ms For Effective Influencer Advertising Campaign Brochure Pdf
This slide highlights four Ms for effective influencer marketing to increase business profitability, productivity and competitive edge. It includes 4 stages which are identify brand audience, campaign research, develop structured framework and assess content network. Pitch your topic with ease and precision using this Four Ms For Effective Influencer Advertising Campaign Brochure Pdf. This layout presents information on Manage, Monitor, Measure. It is also available for immediate download and adjustment. So, changes can be made in the color, design, graphics or any other component to create a unique layout.

KPI Framework For Measuring Organizational Growth Ppt PowerPoint Presentation Gallery Template PDF
This slide outlines major key performance indicator framework for measuring organization growth. It includes kips such as return on investment, customer churn rate, employee satisfaction index, project efficiency and client retention rate. Pitch your topic with ease and precision using this kpi framework for measuring organizational growth ppt powerpoint presentation gallery template pdf This layout presents information on customer, investment, rate It is also available for immediate download and adjustment. So, changes can be made in the color, design, graphics or any other component to create a unique layout.

Budget Vs Actual Cost Comparison Dashboard Ppt PowerPoint Presentation Professional Format Ideas PDF
This slide illustrates fact and figures relating to various project budgets of a company. It includes monthly budget graph, project budget meter and budget vs. Actual costs chart.Pitch your topic with ease and precision using this Budget Vs Actual Cost Comparison Dashboard Ppt PowerPoint Presentation Professional Format Ideas PDF. This layout presents information on Milestones, Budget Graph, Manager. It is also available for immediate download and adjustment. So, changes can be made in the color, design, graphics or any other component to create a unique layout.
Executive Dashboards For Tracking Financial Health Of Enterprise Diagrams PDF
This slide represents the CEO dashboard to track the financial health of an organization. It includes key performance indicators such as revenue, expenses, activity ratio, gross profit margin, EBIT etc. Pitch your topic with ease and precision using this Executive Dashboards For Tracking Financial Health Of Enterprise Diagrams PDF. This layout presents information on Revenue, Expense, Activity Ratio. It is also available for immediate download and adjustment. So, changes can be made in the color, design, graphics or any other component to create a unique layout.

Real Time Analytics Dashboard To Measure Marketing Campaign Performance Information PDF
The purpose of this slide is to outline analytics dashboard to evaluate the success rate of marketing campaign performance. It provides information about metrics such as clicks, impressions, spend, conversions, site audit score, audience growth, etc. Pitch your topic with ease and precision using this Real Time Analytics Dashboard To Measure Marketing Campaign Performance Information PDF. This layout presents information on Real Time Analytics Dashboard To Measure Marketing Campaign Performance. It is also available for immediate download and adjustment. So, changes can be made in the color, design, graphics or any other component to create a unique layout.

Developing Market Leading Businesses Leadership Matrix To Track And Measure Brand Health Mockup PDF
This template covers the leadership grid to analyze brand health. It includes brand categories such as ex-champ, leader, underdog, and challenger. Present like a pro with Developing Market Leading Businesses Leadership Matrix To Track And Measure Brand Health Mockup PDF Create beautiful presentations together with your team, using our easy to use presentation slides. Share your ideas in real time and make changes on the fly by downloading our templates. So whether you are in the office, on the go, or in a remote location, you can stay in sync with your team and present your ideas with confidence. With Slidegeeks presentation got a whole lot easier. Grab these presentations today.
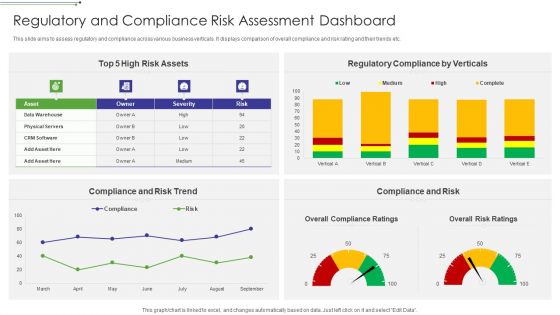
Regulatory And Compliance Risk Assessment Dashboard Designs PDF
This slide aims to assess regulatory and compliance across various business verticals. It displays comparison of overall compliance and risk rating and their trends etc.Pitch your topic with ease and precision using this Regulatory And Compliance Risk Assessment Dashboard Designs PDF This layout presents information on Risk Assets, Regulatory Compliance By Verticals, Compliance And Risk Trend It is also available for immediate download and adjustment. So, changes can be made in the color, design, graphics or any other component to create a unique layout.
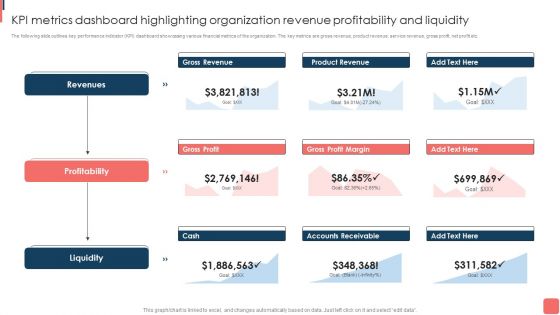
KPI Metrics Dashboard Highlighting Organization Revenue Profitability And Liquidity Template PDF
The following slide outlines key performance indicator KPI dashboard showcasing various financial metrics of the organization. The key metrics are gross revenue, product revenue, service revenue, gross profit, net profit etc. This KPI Metrics Dashboard Highlighting Organization Revenue Profitability And Liquidity Template PDF from Slidegeeks makes it easy to present information on your topic with precision. It provides customization options, so you can make changes to the colors, design, graphics, or any other component to create a unique layout. It is also available for immediate download, so you can begin using it right away. Slidegeeks has done good research to ensure that you have everything you need to make your presentation stand out. Make a name out there for a brilliant performance.

 Home
Home