Gauge Chart

Implementing Successful Strategic Marketing Plan To Increase ROI Email Marketing Dashboard Microsoft PDF
This slide provides information regarding the dashboard that contains various performance indicators that are measured to determine customer engagement performance. Deliver an awe inspiring pitch with this creative implementing successful strategic marketing plan to increase roi email marketing dashboard microsoft pdf bundle. Topics like email marketing dashboard can be discussed with this completely editable template. It is available for immediate download depending on the needs and requirements of the user.

Implementing Successful Strategic Marketing Plan To Increase ROI Social Media Engagement Performance Infographics PDF
This slide provides information regarding the dashboard that contains various social media performance indicators that determine customer engagement performance. Deliver an awe inspiring pitch with this creative implementing successful strategic marketing plan to increase roi social media engagement performance infographics pdf bundle. Topics like social media engagement performance can be discussed with this completely editable template. It is available for immediate download depending on the needs and requirements of the user.

Successful Brand Development Plan Domestic Market Share Of The Firm Rules PDF
This slide demonstrates companys market share in domestic market along with its competitors. It indicates that there is a decline of 5persent in the total share of the company in domestic market.Deliver an awe inspiring pitch with this creative successful brand development plan domestic market share of the firm rules pdf bundle. Topics like domestic market share of the firm can be discussed with this completely editable template. It is available for immediate download depending on the needs and requirements of the user.

Establishing Social Media Hiring Plan Kpis To Measure Social Media Recruitment Success Designs PDF
This slide focuses on key performance indicators to measure social media recruitment success which includes time to hire, recruitment costs, age of applicants, recruitment funnel, ratio of male and female.Deliver an awe inspiring pitch with this creative Establishing Social Media Hiring Plan Kpis To Measure Social Media Recruitment Success Designs PDF bundle. Topics like Recruitment Cost, Female Ratio, Recruitment Funnel can be discussed with this completely editable template. It is available for immediate download depending on the needs and requirements of the user.
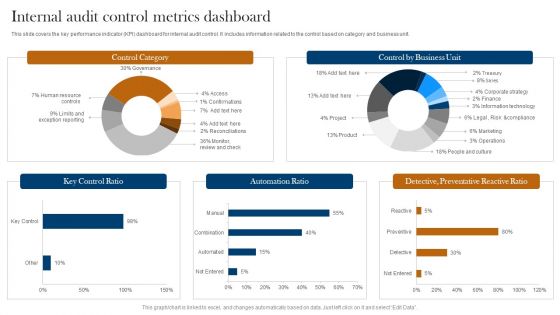
Internal Audit Control Metrics Dashboard Ppt Professional Design Templates PDF
This slide covers the key performance indicator KPI dashboard for internal audit control. It includes information related to the control based on category and business unit. Showcasing this set of slides titled Internal Audit Control Metrics Dashboard Ppt Professional Design Templates PDF. The topics addressed in these templates are Control Category, Key Control Ratio, Automation Ratio. All the content presented in this PPT design is completely editable. Download it and make adjustments in color, background, font etc. as per your unique business setting.

Risk Metrics Dashboard With Exposure Levels Template PDF
This slide illustrates graphical representation of risk key performance indicators. It includes risk levels, risk exposure and impact of risks on business. Pitch your topic with ease and precision using this Risk Metrics Dashboard With Exposure Levels Template PDF. This layout presents information on Risk Metrics Dashboard With Exposure Levels. It is also available for immediate download and adjustment. So, changes can be made in the color, design, graphics or any other component to create a unique layout.
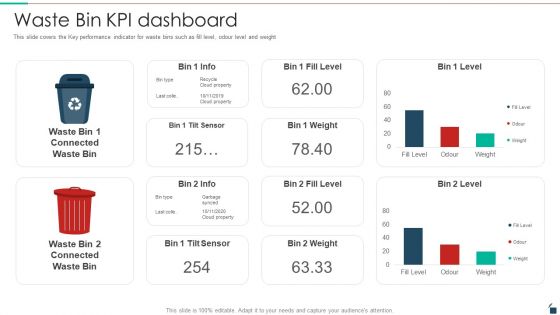
Waste Bin KPI Dashboard Resources Recycling And Waste Management Template PDF
This slide covers the Key performance indicator for waste bins such as fill level, odour level and weight. Deliver an awe inspiring pitch with this creative waste bin kpi dashboard resources recycling and waste management template pdf bundle. Topics like waste bin kpi dashboard can be discussed with this completely editable template. It is available for immediate download depending on the needs and requirements of the user.
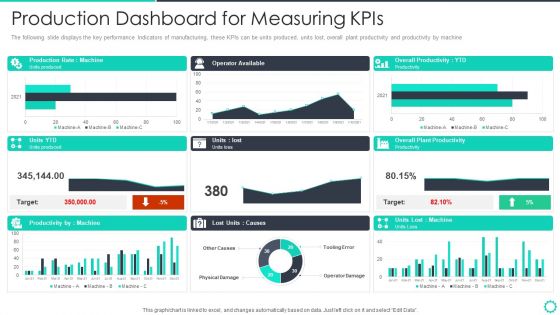
Manufacturing Operation Quality Improvement Practices Tools Templates Production Dashboard For Mockup PDF
The following slide displays the key performance Indicators of manufacturing, these KPIs can be units produced, units lost, overall plant productivity and productivity by machine. Deliver an awe inspiring pitch with this creative manufacturing operation quality improvement practices tools templates production dashboard for mockup pdf bundle. Topics like production dashboard for measuring kpis can be discussed with this completely editable template. It is available for immediate download depending on the needs and requirements of the user.
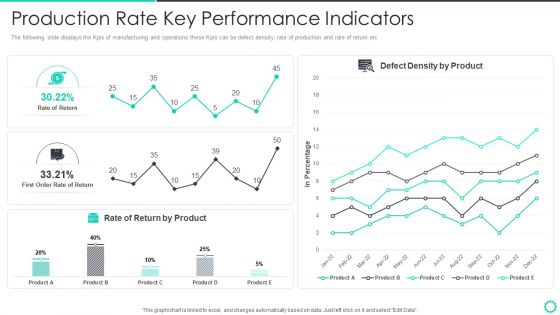
Manufacturing Operation Quality Improvement Practices Tools Templates Production Rate Key Performance Portrait PDF
The following slide displays the Kpis of manufacturing and operations these Kpis can be defect density, rate of production and rate of return etc. Deliver and pitch your topic in the best possible manner with this manufacturing operation quality improvement practices tools templates production rate key performance portrait pdf. Use them to share invaluable insights on production rate key performance indicators and impress your audience. This template can be altered and modified as per your expectations. So, grab it now.

Performance KPI Dashboard To Measure Strategic Business Management Performance Pictures PDF
This slide shows dashboard which can be used to track strategic business Management operations. It includes key performance indicators planning, design, development, testing, workload, etc.Showcasing this set of slides titled Performance KPI Dashboard To Measure Strategic Business Management Performance Pictures PDF The topics addressed in these templates are Development, Projected Launch, Planning All the content presented in this PPT design is completely editable. Download it and make adjustments in color, background, font etc. as per your unique business setting.
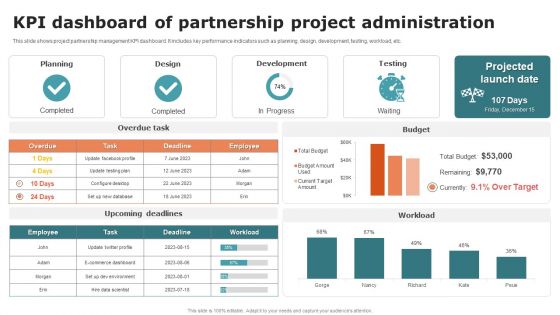
KPI Dashboard Of Partnership Project Administration Ideas PDF
This slide shows project partnership management KPI dashboard. It includes key performance indicators such as planning, design, development, testing, workload, etc. Showcasing this set of slides titled KPI Dashboard Of Partnership Project Administration Ideas PDF. The topics addressed in these templates are Planning, Design, Development. All the content presented in this PPT design is completely editable. Download it and make adjustments in color, background, font etc. as per your unique business setting.
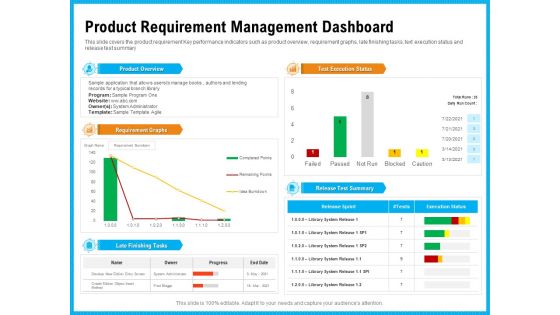
Requirement Gathering Techniques Product Requirement Management Dashboard Sample PDF
This slide covers the product requirement Key performance indicators such as product overview, requirement graphs, late finishing tasks, text execution status and release test summary. Deliver an awe inspiring pitch with this creative requirement gathering techniques product requirement management dashboard sample pdf bundle. Topics like product overview, requirement graphs, late finishing tasks, test execution status, release test summary can be discussed with this completely editable template. It is available for immediate download depending on the needs and requirements of the user.

Analyzing Requirement Management Process Product Requirement Management Dashboard Download PDF
This slide covers the product requirement Key performance indicators such as product overview, requirement graphs, late finishing tasks, text execution status and release test summary. Deliver an awe inspiring pitch with this creative analyzing requirement management process product requirement management dashboard download pdf bundle. Topics like product overview, requirement graphs, late finishing tasks, test execution status, release test summary can be discussed with this completely editable template. It is available for immediate download depending on the needs and requirements of the user.
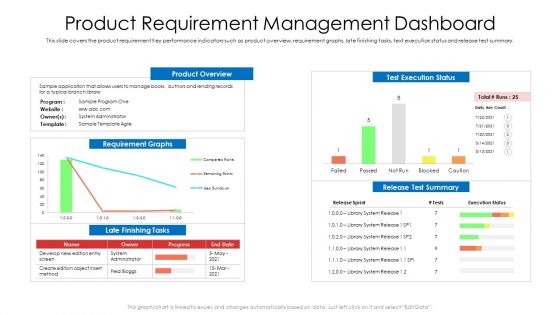
Product Requirement Management Dashboard Ppt Portfolio Clipart PDF
This slide covers the product requirement Key performance indicators such as product overview, requirement graphs, late finishing tasks, text execution status and release test summary. Deliver an awe-inspiring pitch with this creative product requirement management dashboard ppt portfolio clipart pdf bundle. Topics like product overview, requirement graphs, develop can be discussed with this completely editable template. It is available for immediate download depending on the needs and requirements of the user.

Machine Learning Development And Operations Cycle IT Impact Of Mlops On Product Sample PDF
Following slide illustrates information about the impact of introducing MLOps on product improvement. Here the graph shows that organization will observe rapid iteration in its product improvement.Deliver an awe inspiring pitch with this creative machine learning development and operations cycle it impact of mlops on product sample pdf bundle. Topics like graph indicates, iteration in product, product improvement can be discussed with this completely editable template. It is available for immediate download depending on the needs and requirements of the user.

Real Estate Development Project Financing Global Real Estate Investment Volume In 2022 Sample PDF
This slide portrays informational stats about global real estate investment volume for 2022. Here the graph shows that real estate investment volume will fall by 38percent. Deliver an awe inspiring pitch with this creative Real Estate Development Project Financing Global Real Estate Investment Volume In 2022 Sample PDF bundle. Topics like Graph Indicates, Estate Investment, Key Takeaways can be discussed with this completely editable template. It is available for immediate download depending on the needs and requirements of the user.

Determining The Ransom Payment Paid By Organizations Over Time Professional PDF
Following graphical slide shows the amount of ransom paid by organizations over the last two years. Graph indicates that ransom payments appear to have stabilized as a result of effective incident response approaches.Deliver an awe inspiring pitch with this creative Determining The Ransom Payment Paid By Organizations Over Time Professional PDF bundle. Topics like According Graph, Payments Appear, Response Approaches can be discussed with this completely editable template. It is available for immediate download depending on the needs and requirements of the user.

Capital Investment Options Global Real Estate Investment Volume In 2022 Slides PDF
This slide portrays informational stats about global real estate investment volume for 2022. Here the graph shows that real estate investment volume will fall by 38 percent. Deliver an awe inspiring pitch with this creative Capital Investment Options Global Real Estate Investment Volume In 2022 Slides PDF bundle. Topics like Graph Indicates, Real Estate Investment, 2008 To 2023 can be discussed with this completely editable template. It is available for immediate download depending on the needs and requirements of the user.

Global Real Estate Investment Volume In 2022 Real Estate Project Funding Introduction PDF
This slide portrays informational stats about global real estate investment volume for 2022. Here the graph shows that real estate investment volume will fall by 38persent. Deliver and pitch your topic in the best possible manner with this Global Real Estate Investment Volume In 2022 Real Estate Project Funding Introduction PDF. Use them to share invaluable insights on Graph Indicates, Estate Investment, Predicts Real and impress your audience. This template can be altered and modified as per your expectations. So, grab it now.
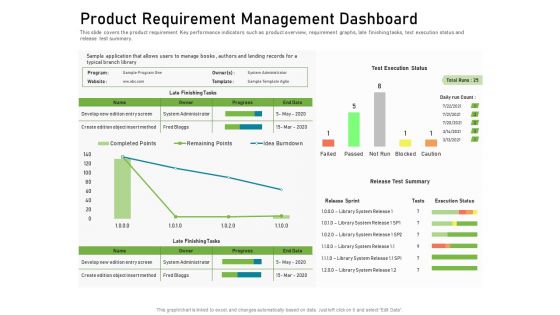
Product Requirement Management Dashboard Graphics PDF
This slide covers the product requirement Key performance indicators such as product overview, requirement graphs, late finishing tasks, text execution status and release test summary. Deliver and pitch your topic in the best possible manner with this product requirement management dashboard graphics pdf. Use them to share invaluable insights on product requirement management dashboard and impress your audience. This template can be altered and modified as per your expectations. So, grab it now.

Product Requirement Management Dashboard Ppt File Slide PDF
This slide covers the product requirement Key performance indicators such as product overview, requirement graphs, late finishing tasks, text execution status and release test summary. Deliver an awe-inspiring pitch with this creative product requirement management dashboard ppt file slide pdf bundle. Topics like product requirement management dashboard can be discussed with this completely editable template. It is available for immediate download depending on the needs and requirements of the user.
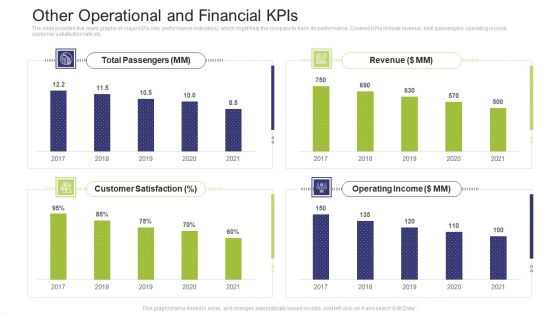
Other Operational And Financial Kpis Inspiration PDF
The slide provides five years graphs of major KPIs key performance indicators, which might help the company to track its performance. Covered KPIs include revenue, total passengers, operating income, customer satisfaction rate etc.Deliver an awe-inspiring pitch with this creative other operational and financial KPIs inspiration pdf. bundle. Topics like total passengers, operating income, revenue, 2017 to 2021 can be discussed with this completely editable template. It is available for immediate download depending on the needs and requirements of the user.
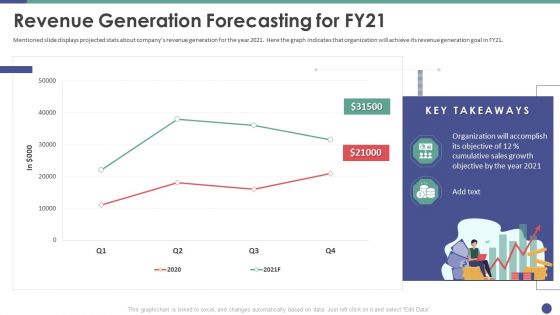
QC Engineering Revenue Generation Forecasting For FY21 Ppt Layouts Show PDF
Mentioned slide displays projected stats about companys revenue generation for the year 2021. Here the graph indicates that organization will achieve its revenue generation goal in FY21. Deliver and pitch your topic in the best possible manner with this qc engineering revenue generation forecasting for fy21 ppt layouts show pdf. Use them to share invaluable insights on organization, cumulative, sales, growth, objective and impress your audience. This template can be altered and modified as per your expectations. So, grab it now.

QC Engineering Sales Performance Forecasting For FY21 Ppt Styles Graphics Download PDF
This slide illustrates forecasted sales performance stats of the firm in the year 2021. Here the graph indicates that organization will achieve its sales performance goal in FY21. Deliver and pitch your topic in the best possible manner with this qc engineering sales performance forecasting for fy21 ppt styles graphics download pdf. Use them to share invaluable insights on organization, cumulative, sales, growth, objective and impress your audience. This template can be altered and modified as per your expectations. So, grab it now.
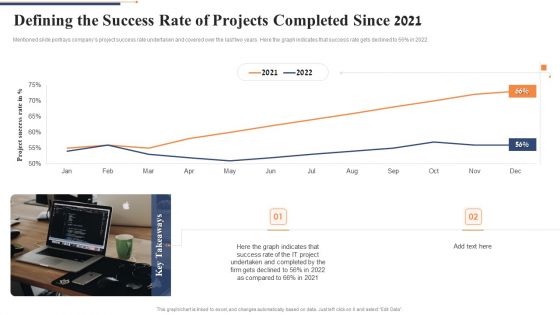
Defining The Success Rate Of Projects Completed Since 2021 Pictures PDF
Mentioned slide portrays companys project success rate undertaken and covered over the last two years. Here the graph indicates that success rate gets declined to 56percentsge in 2022. Deliver an awe inspiring pitch with this creative defining the success rate of projects completed since 2021 pictures pdf bundle. Topics like project success rate can be discussed with this completely editable template. It is available for immediate download depending on the needs and requirements of the user.

Forecasted Impact Of Adopting Agile Model On The Success Rate Of Projects Inspiration PDF
Mentioned slide portrays forecasted companys project success rate after adopting agile mode. Here the graph indicates that success rate will get increased to 73percentage in 2023. Deliver an awe inspiring pitch with this creative forecasted impact of adopting agile model on the success rate of projects inspiration pdf bundle. Topics like project success rate can be discussed with this completely editable template. It is available for immediate download depending on the needs and requirements of the user.

Global Consumer Packaged Goods Market Share By Leading Brands Ppt Portfolio Aids PDF
This slide illustrates the market share statistics of global consumer packaged goods CPG. Here the graph indicates region-wise statistics of leading brands. Deliver an awe inspiring pitch with this creative global consumer packaged goods market share by leading brands ppt portfolio aids pdf bundle. Topics like global consumer packaged goods market share by leading brands can be discussed with this completely editable template. It is available for immediate download depending on the needs and requirements of the user.
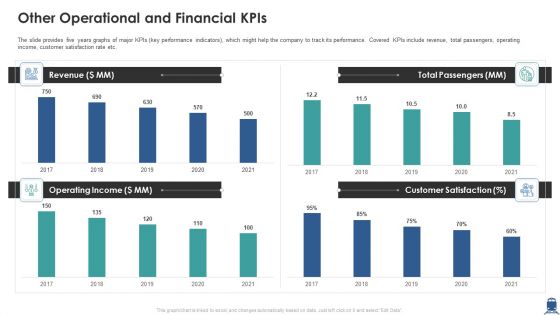
Other Operational And Financial Kpis Information PDF
The slide provides five years graphs of major KPIs key performance indicators, which might help the company to track its performance. Covered KPIs include revenue, total passengers, operating income, customer satisfaction rate etc. Deliver an awe inspiring pitch with this creative other operational and financial kpis information pdf bundle. Topics like revenue, operating income, customer satisfaction can be discussed with this completely editable template. It is available for immediate download depending on the needs and requirements of the user.
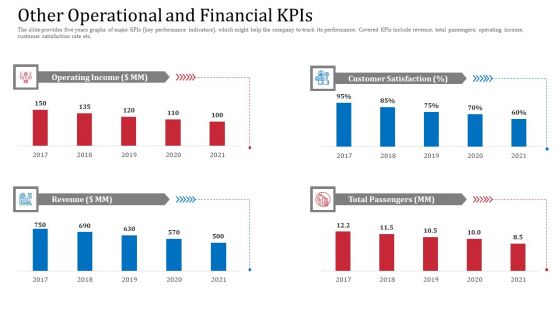
Other Operational And Financial Kpis Demonstration PDF
The slide provides five years graphs of major KPIs key performance indicators, which might help the company to track its performance. Covered KPIs include revenue, total passengers, operating income, customer satisfaction rate etc.Deliver and pitch your topic in the best possible manner with this other operational and financial kpis demonstration pdf. Use them to share invaluable insights on customer satisfaction, operating income, total passengers and impress your audience. This template can be altered and modified as per your expectations. So, grab it now.

Agile SDLC IT Reasons Why Organizations Are Adopting Agile Demonstration PDF
This slide illustrates informational stats about the major reasons behind adopting agile methodologies. Here the graph indicates that most of the organization prefer agile methodology to accelerate software delivery. Deliver an awe inspiring pitch with this creative agile sdlc it reasons why organizations are adopting agile demonstration pdf bundle. Topics like organizations, methodology, collaboration can be discussed with this completely editable template. It is available for immediate download depending on the needs and requirements of the user.
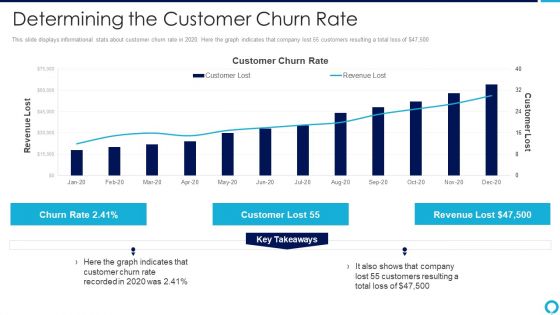
Partnership Management Strategies Determining The Customer Churn Rate Guidelines PDF
This slide displays informational stats about customer churn rate in 2020. Here the graph indicates that company lost 55 customers resulting a total loss of dollar47,500 Deliver and pitch your topic in the best possible manner with this partnership management strategies determining the customer churn rate guidelines pdf Use them to share invaluable insights on determining the customer churn rate and impress your audience. This template can be altered and modified as per your expectations. So, grab it now.

Investor Pitch Presentation For Beauty Product Brands Global Consumer Packaged Goods Market Share By Leading Brands Structure PDF
This slide illustrates the market share statistics of global consumer packaged goods CPG. Here the graph indicates region-wise statistics of leading brands. Deliver an awe inspiring pitch with this creative investor pitch presentation for beauty product brands global consumer packaged goods market share by leading brands structure pdf bundle. Topics like global consumer packaged goods market share by leading brands can be discussed with this completely editable template. It is available for immediate download depending on the needs and requirements of the user.
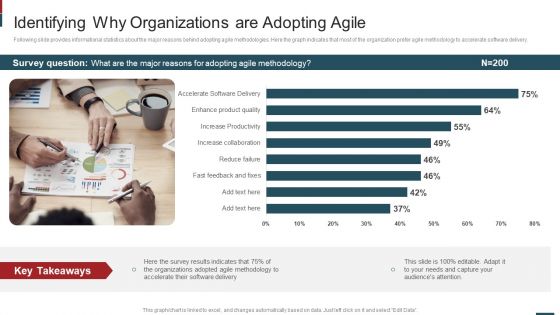
Cost Saving With Agile Methodology IT Identifying Why Organizations Elements PDF
Following slide provides informational statistics about the major reasons behind adopting agile methodologies. Here the graph indicates that most of the organization prefer agile methodology to accelerate software delivery.Deliver an awe inspiring pitch with this creative cost saving with agile methodology it identifying why organizations elements pdf bundle. Topics like reduce failure, increase collaboration, enhance product quality can be discussed with this completely editable template. It is available for immediate download depending on the needs and requirements of the user.
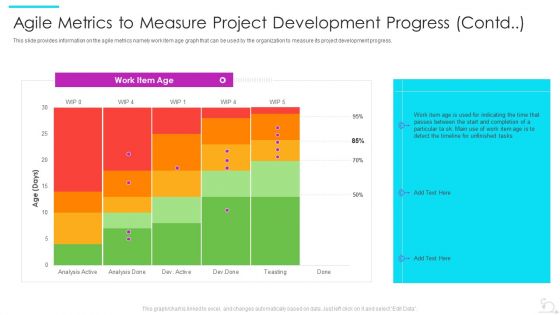
Agile Software Development Lifecycle IT Agile Metrics To Measure Project Development Progress Contd Topics PDF
This slide provides information on the agile metrics namely work item age graph that can be used by the organization to measure its project development progress.Deliver an awe inspiring pitch with this creative agile software development lifecycle it agile metrics to measure project development progress contd topics pdf bundle. Topics like unfinished tasks, passes between, indicating the time that can be discussed with this completely editable template. It is available for immediate download depending on the needs and requirements of the user.

Determining The Most Used Agile Scaling Methods And Approaches Sample PDF
This slide portrays informational statistics about most used agile scaling methods and approaches. Here the graph indicates that most of the organization prefers SAFe agile scaling methods and approaches. Deliver and pitch your topic in the best possible manner with this determining the most used agile scaling methods and approaches sample pdf. Use them to share invaluable insights on organizations, methods and impress your audience. This template can be altered and modified as per your expectations. So, grab it now.
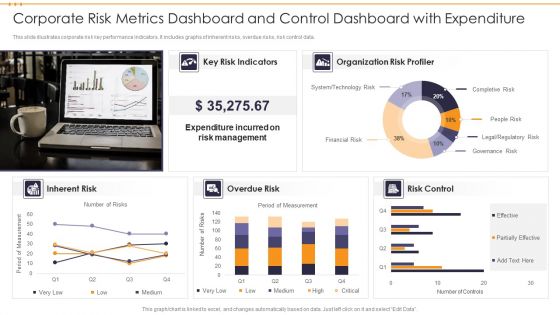
Corporate Risk Metrics Dashboard And Control Dashboard With Expenditure Inspiration PDF
This slide illustrates corporate risk key performance indicators. It includes graphs of inherent risks, overdue risks, risk control data. Showcasing this set of slides titled Corporate Risk Metrics Dashboard And Control Dashboard With Expenditure Inspiration PDF. The topics addressed in these templates are Expenditure, Risk Management, Organization Risk. All the content presented in this PPT design is completely editable. Download it and make adjustments in color, background, font etc. as per your unique business setting.
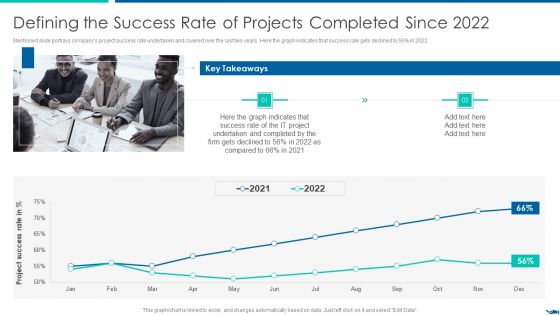
Project QA Through Agile Methodology IT Defining The Success Rate Infographics PDF
Mentioned slide portrays companys project success rate undertaken and covered over the last two years. Here the graph indicates that success rate gets declined to 56percent in 2022.Deliver an awe inspiring pitch with this creative Project QA Through Agile Methodology IT Defining The Success Rate Infographics PDF bundle. Topics like Defining The Success Rate Of Projects Completed Since 2022 can be discussed with this completely editable template. It is available for immediate download depending on the needs and requirements of the user.
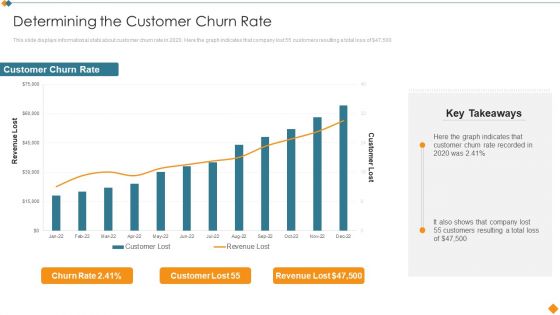
Maintaining Partner Relationships Determining The Customer Churn Rate Portrait PDF
This slide displays informational stats about customer churn rate in 2020. Here the graph indicates that company lost 55 customers resulting a total loss of dollar 47,500. Deliver and pitch your topic in the best possible manner with this Maintaining Partner Relationships Determining The Customer Churn Rate Portrait PDF. Use them to share invaluable insights on Customer Churn Rate, Revenue Lost and impress your audience. This template can be altered and modified as per your expectations. So, grab it now.
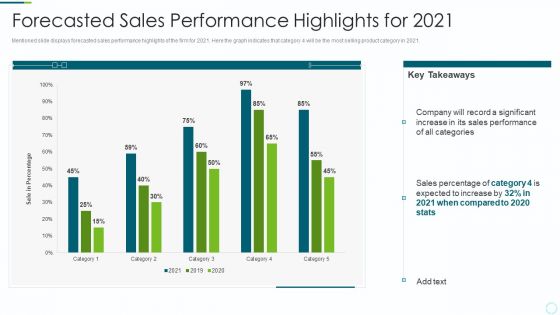
Implementing BPM Techniques Forecasted Sales Performance Highlights For 2021 Information PDF
Mentioned slide displays forecasted sales performance highlights of the firm for 2021. Here the graph indicates that category 4 will be the most selling product category in 2021. Deliver an awe inspiring pitch with this creative Implementing BPM Techniques Forecasted Sales Performance Highlights For 2021 Information PDF bundle. Topics like Company, Category, Sales Performance can be discussed with this completely editable template. It is available for immediate download depending on the needs and requirements of the user.
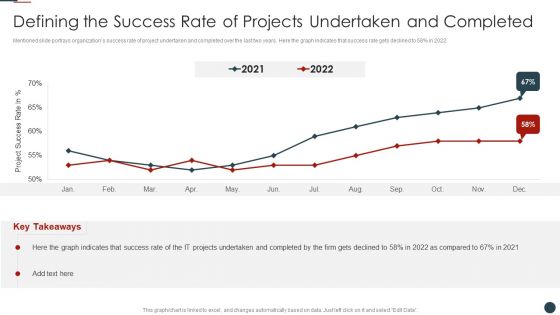
Implementing Agile Software Development Methodology For Cost Cutting IT Defining The Success Rate Introduction PDF
Mentioned slide portrays organizations success rate of project undertaken and completed over the last two years. Here the graph indicates that success rate gets declined to 58percent in 2022.Deliver an awe inspiring pitch with this creative Implementing Agile Software Development Methodology For Cost Cutting IT Defining The Success Rate Introduction PDF bundle. Topics like Defining Success, Rate Projects, Undertaken Completed can be discussed with this completely editable template. It is available for immediate download depending on the needs and requirements of the user.

Adult Population That Are Actively Paying Customers Of Dating Service Ideas PDF
Mentioned slide portrays worldwide informational stats of adult population that are actively paying customers of dating service. Here the graph indicates that country with the largest share is the United States. Deliver an awe inspiring pitch with this creative Adult Population That Are Actively Paying Customers Of Dating Service Ideas PDF bundle. Topics like Dating Service, Actively Paying Customers can be discussed with this completely editable template. It is available for immediate download depending on the needs and requirements of the user.
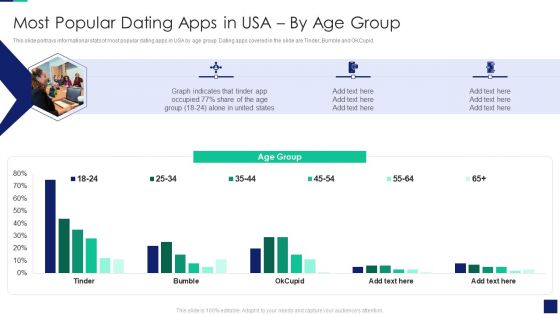
Online Dating Business Investor Capital Financing Most Popular Dating Apps In Usa By Age Group Structure PDF
This slide portrays informational stats of most popular dating apps in USA by age group. Dating apps covered in the slide are Tinder, Bumble and OKCupid. Deliver an awe inspiring pitch with this creative Online Dating Business Investor Capital Financing Most Popular Dating Apps In Usa By Age Group Structure PDF bundle. Topics like Graph Indicates can be discussed with this completely editable template. It is available for immediate download depending on the needs and requirements of the user.
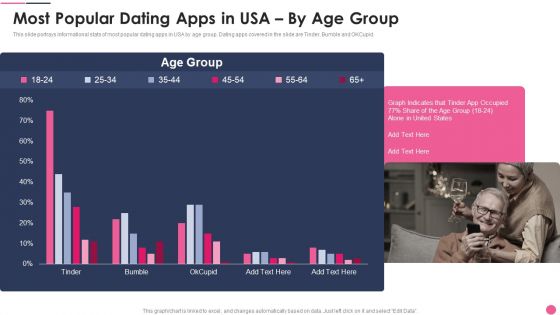
Most Popular Dating Apps In USA By Age Group Inspiration PDF
This slide portrays informational stats of most popular dating apps in USA by age group. Dating apps covered in the slide are Tinder, Bumble and OKCupid.Deliver and pitch your topic in the best possible manner with this Most Popular Dating Apps In USA By Age Group Inspiration PDF Use them to share invaluable insights on Graph Indicates, United States, Tinder Occupied and impress your audience. This template can be altered and modified as per your expectations. So, grab it now.
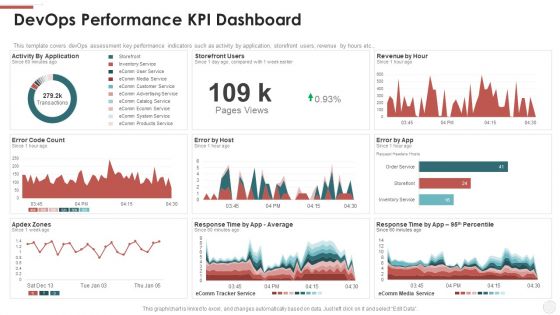
Devops Performance KPI Dashboard Ppt File Example Topics PDF
This template covers devOps assessment key performance indicators such as activity by application, storefront users, revenue by hours etc. Deliver and pitch your topic in the best possible manner with this devops performance kpi dashboard ppt file example topics pdf. Use them to share invaluable insights on revenue, application and impress your audience. This template can be altered and modified as per your expectations. So, grab it now.
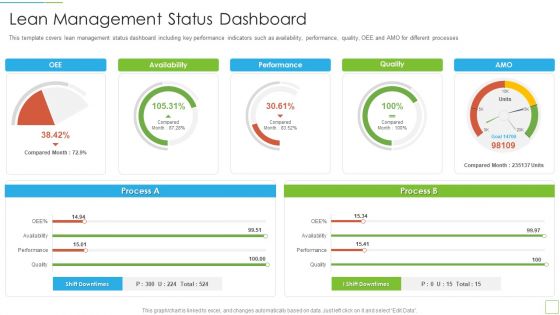
Hoshin Kanri Pitch Deck Lean Management Status Dashboard Designs PDF
This template covers lean management status dashboard including key performance indicators such as availability, performance, quality, OEE and AMO for different processes Deliver an awe inspiring pitch with this creative hoshin kanri pitch deck lean management status dashboard designs pdf bundle. Topics like lean management status dashboard can be discussed with this completely editable template. It is available for immediate download depending on the needs and requirements of the user.

Commercial Marketing KPI With Accumulated Sales And Profit Portrait PDF
This slide template covers about key performing indicators like number of sales with revenue and profit generated in comparison with cost input and breakdown.Showcasing this set of slides titled Commercial Marketing KPI With Accumulated Sales And Profit Portrait PDF. The topics addressed in these templates are Cost Breakdown, Accumulated Revenue, Incremental Sales. All the content presented in this PPT design is completely editable. Download it and make adjustments in color, background, font etc. as per your unique business setting.

Content Advertising Campaign Measuring Campaign Results Background PDF
This slide provides an overview of the dashboard depicting performance indicators used to measure success of the campaign. Metrics covered are page views, new visitors, social shares, CTR, blog subscribers, conversion, new blog subscribers, etc. There are so many reasons you need a Content Advertising Campaign Measuring Campaign Results Background PDF. The first reason is you cannot spend time making everything from scratch, Thus, Slidegeeks has made presentation templates for you too. You can easily download these templates from our website easily.
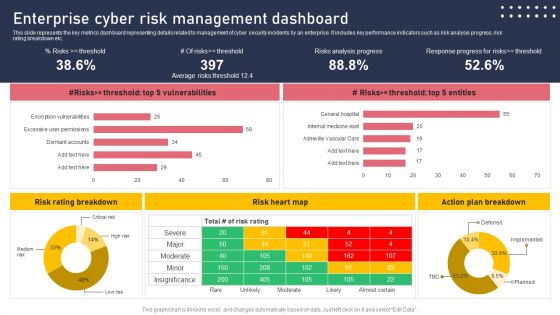
Enterprise Cyber Risk Management Dashboard Sample PDF
This slide represents the key metrics dashboard representing details related to management of cyber security incidents by an enterprise. It includes key performance indicators such as risk analysis progress, risk rating breakdown etc. There are so many reasons you need a Enterprise Cyber Risk Management Dashboard Sample PDF. The first reason is you cannot spend time making everything from scratch, Thus, Slidegeeks has made presentation templates for you too. You can easily download these templates from our website easily.

Implementing Cyber Security Incident Cyber Security Incident Response KPI Dashboard Clipart PDF
This slide represents dashboard showing the key metrics of cyber security incident response. It includes key performance indicators such as risk score, compliance status, threat level etc. There are so many reasons you need a Implementing Cyber Security Incident Cyber Security Incident Response KPI Dashboard Clipart PDF. The first reason is you cannot spend time making everything from scratch, Thus, Slidegeeks has made presentation templates for you too. You can easily download these templates from our website easily.

KPI Dashboard To Measure Digital Brand Element Performance Professional PDF
This slide signifies the key performance indicator dashboard to evaluate digital brand asset performance. It includes user click rate, no of downloads, breakdown of workflow by types. Showcasing this set of slides titled KPI Dashboard To Measure Digital Brand Element Performance Professional PDF. The topics addressed in these templates are Template Performance, Breakdown Workflows, Executed Workflows. All the content presented in this PPT design is completely editable. Download it and make adjustments in color, background, font etc. as per your unique business setting.
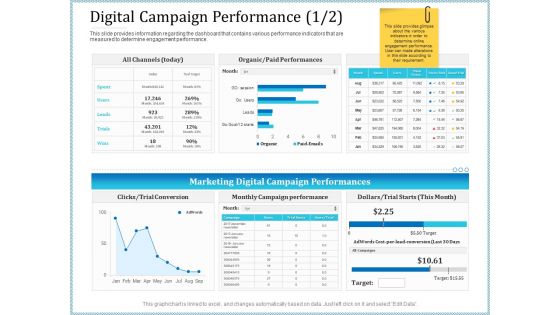
Leveraged Client Engagement Digital Campaign Performance Cost Structure PDF
This slide provides information regarding the dashboard that contains various performance indicators that are measured to determine engagement performance. Deliver and pitch your topic in the best possible manner with this leveraged client engagement digital campaign performance cost structure pdf. Use them to share invaluable insights on campaign, optimization, target, cost and impress your audience. This template can be altered and modified as per your expectations. So, grab it now.

Leveraged Client Engagement Digital Campaign Performance Trend Formats PDF
This slide provides information regarding the dashboard that contains various performance indicators that are measured to determine engagement performance. Deliver an awe inspiring pitch with this creative leveraged client engagement digital campaign performance trend formats pdf bundle. Topics like growth, cost, funnel, optimization can be discussed with this completely editable template. It is available for immediate download depending on the needs and requirements of the user.

Leveraged Client Engagement Email Marketing Dashboard Click Professional PDF
This slide provides information regarding the dashboard that contains various performance indicators that are measured to determine engagement performance. Deliver and pitch your topic in the best possible manner with this leveraged client engagement email marketing dashboard click professional pdf. Use them to share invaluable insights on campaign, traffic status, social, organic, paid search and impress your audience. This template can be altered and modified as per your expectations. So, grab it now.

Leveraged Client Engagement Social Media Engagement Performance Clicks Pictures PDF
This slide provides information regarding the dashboard that contains various performance indicators that are measured to determine engagement performance. Deliver an awe inspiring pitch with this creative leveraged client engagement social media engagement performance clicks pictures pdf bundle. Topics like social media, metrics can be discussed with this completely editable template. It is available for immediate download depending on the needs and requirements of the user.
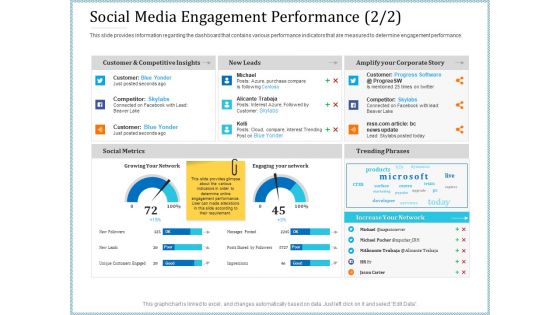
Leveraged Client Engagement Social Media Engagement Performance Leads Sample PDF
This slide provides information regarding the dashboard that contains various performance indicators that are measured to determine engagement performance. Deliver and pitch your topic in the best possible manner with this leveraged client engagement social media engagement performance leads sample pdf. Use them to share invaluable insights on performance, analysis, growing, social metrics and impress your audience. This template can be altered and modified as per your expectations. So, grab it now.

Leveraged Client Engagement Website Traffic Performance Cities Download PDF
This slide provides information regarding the dashboard that contains various performance indicators that are measured to determine engagement performance. Deliver an awe inspiring pitch with this creative leveraged client engagement website traffic performance cities download pdf bundle. Topics like traffic, geographic, business, syndicators, demographics can be discussed with this completely editable template. It is available for immediate download depending on the needs and requirements of the user.
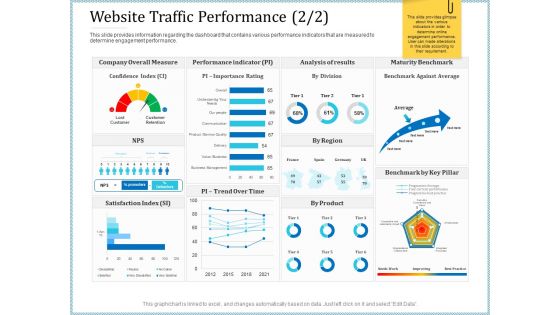
Leveraged Client Engagement Website Traffic Performance Time Inspiration PDF
This slide provides information regarding the dashboard that contains various performance indicators that are measured to determine engagement performance. Deliver and pitch your topic in the best possible manner with this leveraged client engagement website traffic performance time inspiration pdf. Use them to share invaluable insights on measure, performance, analysis, maturity and impress your audience. This template can be altered and modified as per your expectations. So, grab it now.

Cross Border Integration In Multinational Corporation Global Coordination Dashboard Cloud Formats PDF
This slide provides information regarding the dashboard that contains indicators to determine the coordination activities in various dispersed facilities in different regions across the globe. Deliver an awe-inspiring pitch with this creative cross border integration in multinational corporation global coordination dashboard cloud formats pdf bundle. Topics like project, cloud space, philip armstrong, cloud storage, upgrade storage can be discussed with this completely editable template. It is available for immediate download depending on the needs and requirements of the user.
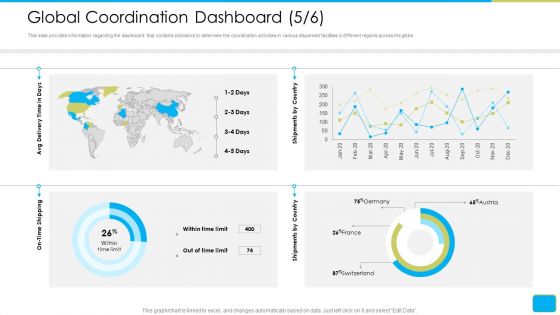
Cross Border Integration In Multinational Corporation Global Coordination Dashboard Limit Ideas PDF
This slide provides information regarding the dashboard that contains indicators to determine the coordination activities in various dispersed facilities in different regions across the globe. Deliver an awe-inspiring pitch with this creative cross border integration in multinational corporation global coordination dashboard limit ideas pdf bundle. Topics like avg delivery time days, on time shipping , shipments country can be discussed with this completely editable template. It is available for immediate download depending on the needs and requirements of the user.
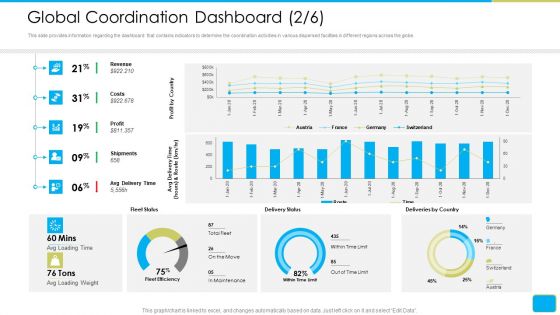
Cross Border Integration In Multinational Corporation Global Coordination Dashboard Revenue Information PDF
This slide provides information regarding the dashboard that contains indicators to determine the coordination activities in various dispersed facilities in different regions across the globe. Deliver and pitch your topic in the best possible manner with this cross border integration in multinational corporation global coordination dashboard revenue information pdf. Use them to share invaluable insights on revenue, costs, profit, shipments, avg delivery time and impress your audience. This template can be altered and modified as per your expectations. So, grab it now.

 Home
Home