Gauge Chart
E Commerce Operations In B2b B2b Sales Performance Tracking Dashboard Icons PDF
This slide represents metric dashboard to track sales performance on e-commerce website. It cover performance indicators such as sales breakdown, order breakdown, recurring sales etc. Slidegeeks is one of the best resources for PowerPoint templates. You can download easily and regulate E Commerce Operations In B2b B2b Sales Performance Tracking Dashboard Icons PDF for your personal presentations from our wonderful collection. A few clicks is all it takes to discover and get the most relevant and appropriate templates. Use our Templates to add a unique zing and appeal to your presentation and meetings. All the slides are easy to edit and you can use them even for advertisement purposes.

Strategic Ecommerce Plan For B2B Enterprises B2b Sales Performance Tracking Dashboard Demonstration PDF
This slide represents metric dashboard to track sales performance on e-commerce website. It cover performance indicators such as sales breakdown, order breakdown, recurring sales etc. Slidegeeks has constructed Strategic Ecommerce Plan For B2B Enterprises B2b Sales Performance Tracking Dashboard Demonstration PDF after conducting extensive research and examination. These presentation templates are constantly being generated and modified based on user preferences and critiques from editors. Here, you will find the most attractive templates for a range of purposes while taking into account ratings and remarks from users regarding the content. This is an excellent jumping-off point to explore our content and will give new users an insight into our top-notch PowerPoint Templates.

Staff Succession Planning And Development Strategy Kpi Dashboard For Human Clipart PDF
Mentioned slide shows key performance indicator dashboard for human resource. Metrics covered in the dashboard are headcount by seniority and gender, open positions, headcount, termination, hires and turnover.If your project calls for a presentation, then Slidegeeks is your go-to partner because we have professionally designed, easy-to-edit templates that are perfect for any presentation. After downloading, you can easily edit Staff Succession Planning And Development Strategy Kpi Dashboard For Human Clipart PDF and make the changes accordingly. You can rearrange slides or fill them with different images. Check out all the handy templates.

Effective Financial Planning Assessment Techniques Performance Kpi Dashboard To Measure Financial Graphics PDF
The following slide outlines a comprehensive key performance indicator KPI dashboard highlighting different financial metrics. The KPIs are quick and current ratio, cash balance, days sales outstanding etc. The best PPT templates are a great way to save time, energy, and resources. Slidegeeks have 100 precent editable powerpoint slides making them incredibly versatile. With these quality presentation templates, you can create a captivating and memorable presentation by combining visually appealing slides and effectively communicating your message. Download Effective Financial Planning Assessment Techniques Performance Kpi Dashboard To Measure Financial Graphics PDF from Slidegeeks and deliver a wonderful presentation.
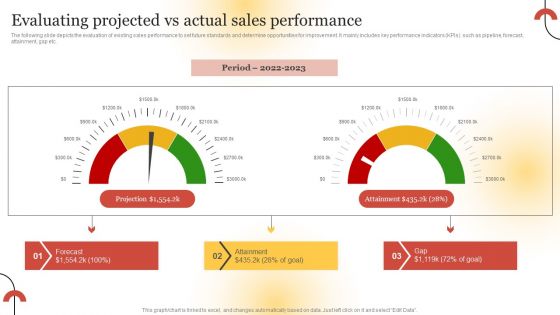
Executing Sales Risk Reduction Plan Evaluating Projected Vs Actual Sales Performance Portrait PDF
The following slide depicts the evaluation of existing sales performance to set future standards and determine opportunities for improvement. It mainly includes key performance indicators KPIs such as pipeline, forecast, attainment, gap etc. There are so many reasons you need a Executing Sales Risk Reduction Plan Evaluating Projected Vs Actual Sales Performance Portrait PDF. The first reason is you can not spend time making everything from scratch, Thus, Slidegeeks has made presentation templates for you too. You can easily download these templates from our website easily.
Tracking Sheet To Planning Multiples Projects With Task Status Information PDF
Mentioned slide outlines a key performance indicator KPI dashboard to plan and measure project progress . Information covered in this slide is related to project names, start and end date, progress details, planned vs actual hours, and issues and risks involved. Showcasing this set of slides titled Tracking Sheet To Planning Multiples Projects With Task Status Information PDF. The topics addressed in these templates are Progress, Issues And Risks, Project. All the content presented in this PPT design is completely editable. Download it and make adjustments in color, background, font etc. as per your unique business setting.
BANT Sales Lead Qualification Model Analyzing And Understanding The Performance Icons PDF
Purpose of the following slide is to show the key performance indicators of the current sales process, the provided displays KPIs such as customer acquired, CAC, volume per customer etc. Deliver and pitch your topic in the best possible manner with this BANT Sales Lead Qualification Model Analyzing And Understanding The Performance Icons PDF. Use them to share invaluable insights on New Customer, Weekly Sales, Revenues Sales and impress your audience. This template can be altered and modified as per your expectations. So, grab it now.
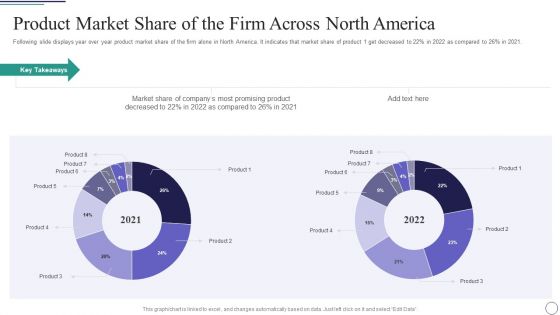
Successful Brand Development Plan Product Market Share Of The Firm Across North America Background PDF
Following slide displays year over year product market share of the firm alone in North America. It indicates that market share of product 1 get decreased to 22persent in 2022 as compared to 26persent in 2021.Deliver an awe inspiring pitch with this creative successful brand development plan product market share of the firm across north america background pdf bundle. Topics like product market share of the firm across north america can be discussed with this completely editable template. It is available for immediate download depending on the needs and requirements of the user.
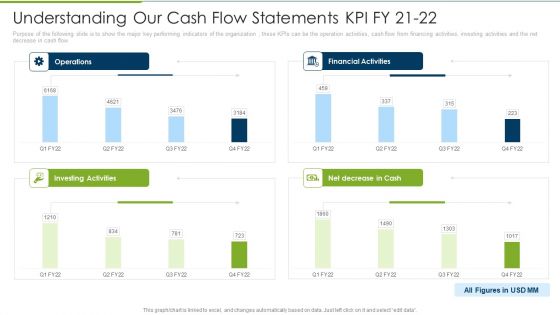
Debt Collection Improvement Plan Understanding Our Cash Flow Statements KPI Fy 21 To 22 Elements PDF
Purpose of the following slide is to show the major key performing indicators of the organization , these KPIs can be the operation activities, cash flow from financing activities, investing activities and the net decrease in cash flow. Deliver and pitch your topic in the best possible manner with this debt collection improvement plan understanding our cash flow statements kpi fy 21 to 22 elements pdf. Use them to share invaluable insights on operations, financial activities, investing activities, net decrease cash and impress your audience. This template can be altered and modified as per your expectations. So, grab it now.
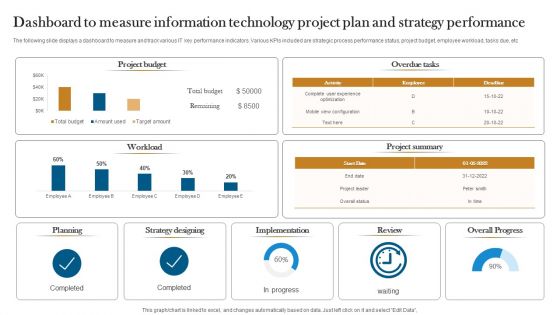
Dashboard To Measure Information Technology Project Plan And Strategy Performance Designs PDF
The following slide displays a dashboard to measure and track various IT key performance indicators. Various KPIs included are strategic process performance status, project budget, employee workload, tasks due, etc. Showcasing this set of slides titled Dashboard To Measure Information Technology Project Plan And Strategy Performance Designs PDF. The topics addressed in these templates are Strategy Designing, Implementation, Overall Progress. All the content presented in this PPT design is completely editable. Download it and make adjustments in color, background, font etc. as per your unique business setting.

Kpi Dashboard For Human Resource Ultimate Guide To Employee Succession Planning Topics PDF
Mentioned slide shows key performance indicator dashboard for human resource. Metrics covered in the dashboard are headcount by seniority and gender, open positions, headcount, termination, hires and turnover.Present like a pro with Kpi Dashboard For Human Resource Ultimate Guide To Employee Succession Planning Topics PDF Create beautiful presentations together with your team, using our easy-to-use presentation slides. Share your ideas in real-time and make changes on the fly by downloading our templates. So whether you are in the office, on the go, or in a remote location, you can stay in sync with your team and present your ideas with confidence. With Slidegeeks presentation got a whole lot easier. Grab these presentations today.
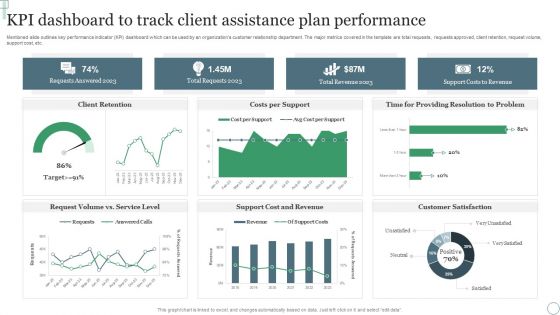
KPI Dashboard To Track Client Assistance Plan Performance Ppt Professional Outfit PDF
Mentioned slide outlines key performance indicator KPI dashboard which can be used by an organizations customer relationship department. The major metrics covered in the template are total requests, requests approved, client retention, request volume, support cost, etc. Pitch your topic with ease and precision using this KPI Dashboard To Track Client Assistance Plan Performance Ppt Professional Outfit PDF. This layout presents information on Requests Answered 2023, Total Requests 2023, Total Revenue 2023. It is also available for immediate download and adjustment. So, changes can be made in the color, design, graphics or any other component to create a unique layout.

Dashboard To Depict Strategic B2B Communication Rollout Plan Success Portrait PDF
This slide consists of a dashboard that can be used to depict the success of a B2B communication rollout. Key performing indicators included in the slide are products sold, total revenue, client satisfaction, net profit, etc. Showcasing this set of slides titled Dashboard To Depict Strategic B2B Communication Rollout Plan Success Portrait PDF. The topics addressed in these templates are Product Sold, Total Revenue, B2b Client Satisfication. All the content presented in this PPT design is completely editable. Download it and make adjustments in color, background, font etc. as per your unique business setting.

Strategic Marketing Analysis And Planning Dashboard To Track Campaign Effectiveness Summary PDF
Following slide presents a marketing intelligence dashboard, which can be used to track the effectiveness of advertisement campaign and take necessary actions for improvement. The key performance indicators were total revenue, marketing spend etc. Showcasing this set of slides titled Strategic Marketing Analysis And Planning Dashboard To Track Campaign Effectiveness Summary PDF. The topics addressed in these templates are Marketing Spend, Conversion Rate, Return Investment. All the content presented in this PPT design is completely editable. Download it and make adjustments in color, background, font etc. as per your unique business setting.

Improvement Of Safety Performance At Construction Site Kpi Dashboard To Track Safety Program Microsoft PDF
This slide reflects the key performance indicator dashboard to track the performance of safety program. It includes information regarding the total manpower, manhours, unsafe conditions, lost time injuries frequency, injuries severity rate, along with the training hours. Make sure to capture your audiences attention in your business displays with our gratis customizable Improvement Of Safety Performance At Construction Site Kpi Dashboard To Track Safety Program Microsoft PDF. These are great for business strategies, office conferences, capital raising or task suggestions. If you desire to acquire more customers for your tech business and ensure they stay satisfied, create your own sales presentation with these plain slides.
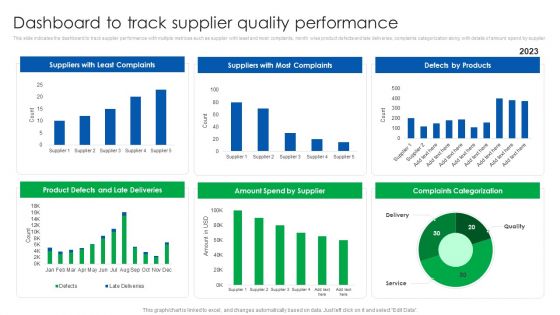
Vendor Relationship Management Strategic Plan Dashboard To Track Supplier Quality Performance Portrait PDF
This slide indicates the dashboard to track supplier performance with multiple metrices such as supplier with least and most complaints, month wise product defects and late deliveries, complaints categorization along with details of amount spend by supplier. Make sure to capture your audiences attention in your business displays with our gratis customizable Vendor Relationship Management Strategic Plan Dashboard To Track Supplier Quality Performance Portrait PDF. These are great for business strategies, office conferences, capital raising or task suggestions. If you desire to acquire more customers for your tech business and ensure they stay satisfied, create your own sales presentation with these plain slides.
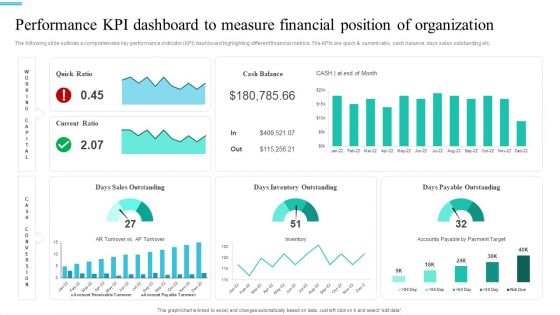
Monetary Planning And Evaluation Guide Performance KPI Dashboard To Measure Financial Position Of Organization Ppt File Slides PDF
The following slide outlines a comprehensive key performance indicator KPI dashboard highlighting different financial metrics. The KPIs are quick and current ratio, cash balance, days sales outstanding etc. The best PPT templates are a great way to save time, energy, and resources. Slidegeeks have 100 percent editable powerpoint slides making them incredibly versatile. With these quality presentation templates, you can create a captivating and memorable presentation by combining visually appealing slides and effectively communicating your message. Download Monetary Planning And Evaluation Guide Performance KPI Dashboard To Measure Financial Position Of Organization Ppt File Slides PDF from Slidegeeks and deliver a wonderful presentation.
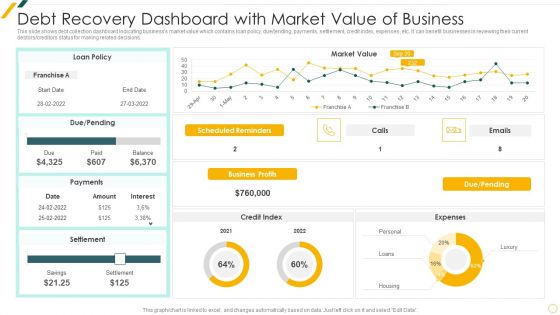
Debt Recovery Dashboard With Market Value Of Business Template PDF
This slide shows debt collection dashboard indicating businesss market value which contains loan policy, due ending, payments, settlement, credit index, expenses, etc. It can benefit businesses in reviewing their current debtors creditors status for making related decisions.Showcasing this set of slides titled Debt Recovery Dashboard With Market Value Of Business Template PDF The topics addressed in these templates are Debt Recovery, Dashboard Market, Value Of Business All the content presented in this PPT design is completely editable. Download it and make adjustments in color, background, font etc. as per your unique business setting.
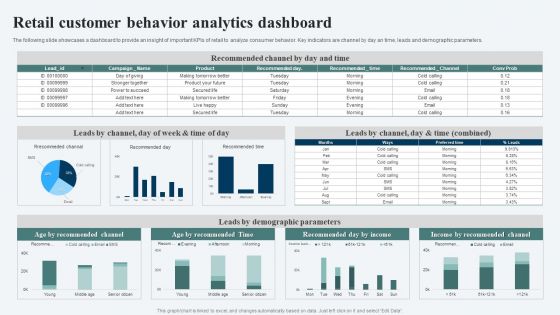
Retail Customer Behavior Analytics Dashboard Ppt Ideas Templates PDF
The following slide showcases a dashboard to provide an insight of important KPIs of retail to analyze consumer behavior. Key indicators are channel by day an time, leads and demographic parameters. Showcasing this set of slides titled Retail Customer Behavior Analytics Dashboard Ppt Ideas Templates PDF. The topics addressed in these templates are Recommended Channel, Leads Demographic Parameters, Income Recommended Channel. All the content presented in this PPT design is completely editable. Download it and make adjustments in color, background, font etc. as per your unique business setting.
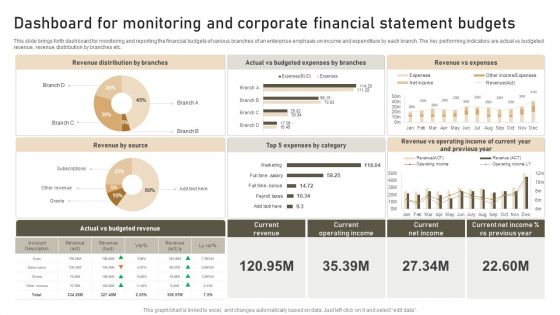
Dashboard For Monitoring And Corporate Financial Statement Budgets Template PDF
This slide brings forth dashboard for monitoring and reporting the financial budgets of various branches of an enterprise emphasis on income and expenditure by each branch. The key performing indicators are actual vs budgeted revenue, revenue distribution by branches etc. Showcasing this set of slides titled Dashboard For Monitoring And Corporate Financial Statement Budgets Template PDF. The topics addressed in these templates are Revenue Distribution, Revenue Source, Revenue Expenses. All the content presented in this PPT design is completely editable. Download it and make adjustments in color, background, font etc. as per your unique business setting.

Global Medicare Outpatients Inpatients Kpi Dashboard Template PDF
This slide shows global healthcare KPIs related to outpatients-inpatients through dashboard. It include Key performance indicators such as average global patients, average treatment cost etc. Pitch your topic with ease and precision using this Global Medicare Outpatients Inpatients Kpi Dashboard Template PDF. This layout presents information on Average Treatment Cost, Average Global Patients, Average Available Staff. It is also available for immediate download and adjustment. So, changes can be made in the color, design, graphics or any other component to create a unique layout.
Monthly Sales KPI Dashboard For Tracking Brand Recommendation Progress Background PDF
Following slide demonstrates key performance indicator dashboard for tracking monthly sales to monitor business performance. It includes components such as monthly execution cost, sales, state wise events, Brand market, and programs. Showcasing this set of slides titled Monthly Sales KPI Dashboard For Tracking Brand Recommendation Progress Background PDF. The topics addressed in these templates are Products Sold, Engagements, Events, Active Markets, Sampled, Attendance. All the content presented in this PPT design is completely editable. Download it and make adjustments in color, background, font etc. as per your unique business setting.
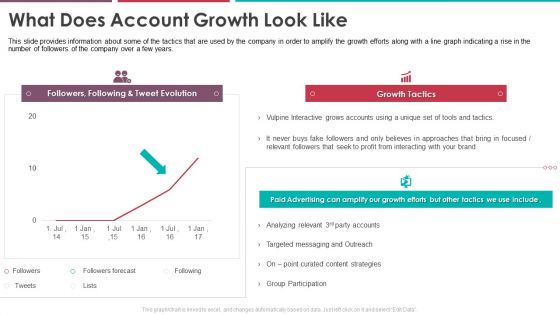
What Does Account Growth Look Like Pitch Deck Of Vulpine Interactive Fundraising Template Pdf
This slide provides information about some of the tactics that are used by the company in order to amplify the growth efforts along with a line graph indicating a rise in the number of followers of the company over a few years. This is a what does account growth look like pitch deck of vulpine interactive fundraising template pdf template with various stages. Focus and dispense information on six stages using this creative set, that comes with editable features. It contains large content boxes to add your information on topics like tweet evolution, growth tactics. You can also showcase facts, figures, and other relevant content using this PPT layout. Grab it now.

Post Implementation Other Operation And Financial Kpis Ppt Infographic Template PDF
The slide provides five years graphs 2020F-2024F forecasted number of major KPIs key performance indicators, that might help to track the performance of ABC Railway. Covered KPIs include Revenue, Total Passengers, operating income, customer satisfaction rate etc. Deliver an awe inspiring pitch with this creative post implementation other operation and financial kpis ppt infographic template pdf bundle. Topics like operating income, revenue, customer satisfaction can be discussed with this completely editable template. It is available for immediate download depending on the needs and requirements of the user.

Project Management Professional Certification IT Key Facts And Figures About Active PMP Certificate Holders Template PDF
Following slide portrays key facts and figures of active project management professional PMP certificate holders. Here the graph indicates that there are currently 916,621 active PMP certificate holders. Deliver and pitch your topic in the best possible manner with this project management professional certification it key facts and figures about active pmp certificate holders template pdf. Use them to share invaluable insights on key facts and figures about active pmp certificate holders and impress your audience. This template can be altered and modified as per your expectations. So, grab it now.
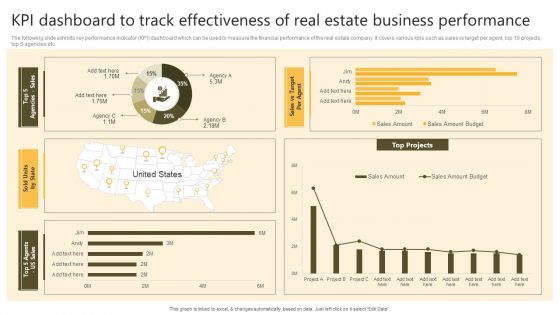
Successful Risk Administration KPI Dashboard To Track Effectiveness Of Real Estate Business Template PDF
The following slide exhibits key performance indicator KPI dashboard which can be used to measure the financial performance of the real estate company. It covers various kpis such as sales vs target per agent, top 10 projects, top 5 agencies etc. If your project calls for a presentation, then Slidegeeks is your go-to partner because we have professionally designed, easy-to-edit templates that are perfect for any presentation. After downloading, you can easily edit Successful Risk Administration KPI Dashboard To Track Effectiveness Of Real Estate Business Template PDF and make the changes accordingly. You can rearrange slides or fill them with different images. Check out all the handy templates.
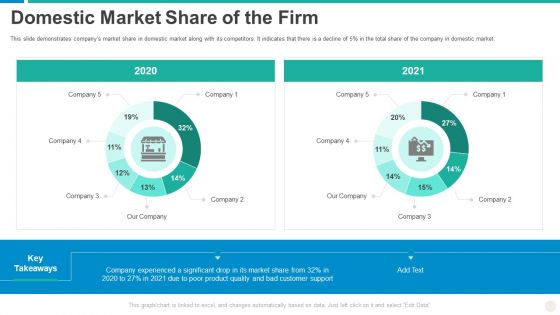
Establishing Successful Brand Strategy To Captivate Consumers Domestic Market Share Of The Firm Template PDF
This slide demonstrates companys market share in domestic market along with its competitors. It indicates that there is a decline of 5 percent in the total share of the company in domestic market. Deliver and pitch your topic in the best possible manner with this establishing successful brand strategy to captivate consumers domestic market share of the firm template pdf. Use them to share invaluable insights on domestic market share of the firm and impress your audience. This template can be altered and modified as per your expectations. So, grab it now.
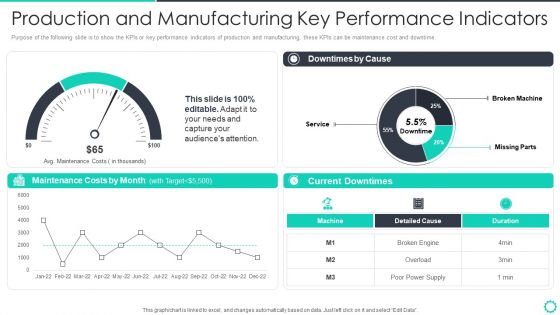
Manufacturing Operation Quality Improvement Practices Tools Templates Production And Manufacturing Pictures PDF
Purpose of the following slide is to show the KPIs or key performance indicators of production and manufacturing, these KPIs can be maintenance cost and downtime. Deliver and pitch your topic in the best possible manner with this manufacturing operation quality improvement practices tools templates production and manufacturing pictures pdf. Use them to share invaluable insights on downtimes by cause, maintenance costs by month, current downtimes and impress your audience. This template can be altered and modified as per your expectations. So, grab it now.
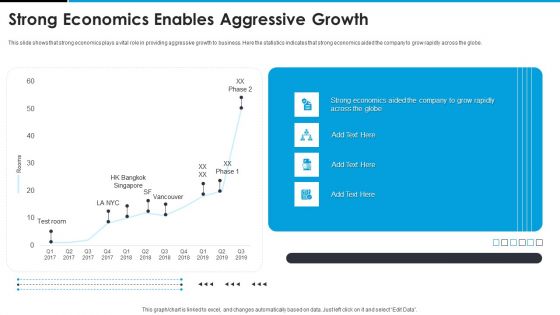
Sandbox VR Venture Capital Financing Pitch Deck Strong Economics Enables Aggressive Growth Template PDF
This slide shows that strong economics plays a vital role in providing aggressive growth to business. Here the statistics indicates that strong economics aided the company to grow rapidly across the globe. Deliver and pitch your topic in the best possible manner with this sandbox vr venture capital financing pitch deck strong economics enables aggressive growth template pdf. Use them to share invaluable insights on strong economics enables aggressive growth and impress your audience. This template can be altered and modified as per your expectations. So, grab it now.

Company Financial Forecast And Essential Metrics Ppt Model Design Templates PDF
This slide shows the projections of the financials of a company with the key performance indicators to know exactly where the business stands and what needs to be enhanced or reduced to make the business profitable. Showcasing this set of slides titled Company Financial Forecast And Essential Metrics Ppt Model Design Templates PDF. The topics addressed in these templates are Budget, Income, Expense, 2018 To 2022. All the content presented in this PPT design is completely editable. Download it and make adjustments in color, background, font etc. as per your unique business setting.

Key Company Financial Operation Performance Metrics Ppt Infographic Template Example Introduction PDF
This slide showcases key performance indicators for every business. Key metrics covered are return on assets and equity, working capital ratio, debt and equity ratio. Showcasing this set of slides titled Key Company Financial Operation Performance Metrics Ppt Infographic Template Example Introduction PDF. The topics addressed in these templates are Return on Assets, Working Capital Ratio, Return on Equity. All the content presented in this PPT design is completely editable. Download it and make adjustments in color, background, font etc. as per your unique business setting.

CRM Team Dashboard Highlighting Major Web Based Platform Kpis Template PDF
This slide showcases customer relationship management CRM team dashboard indicating web portal KPIs. It provides information about cost per acquisition CPA, signups, channel, spend, etc. Pitch your topic with ease and precision using this CRM Team Dashboard Highlighting Major Web Based Platform Kpis Template PDF. This layout presents information on CRM Team Dashboard Highlighting, Web Based Platform Kpis. It is also available for immediate download and adjustment. So, changes can be made in the color, design, graphics or any other component to create a unique layout.
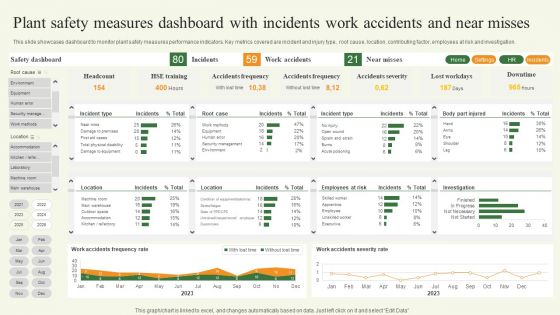
Plant Safety Measures Dashboard With Incidents Work Accidents And Near Misses Template PDF
This slide showcases dashboard to monitor plant safety measures performance indicators. Key metrics covered are incident and injury type, root cause, location, contributing factor, employees at risk and investigation. Pitch your topic with ease and precision using this Plant Safety Measures Dashboard With Incidents Work Accidents And Near Misses Template PDF. This layout presents information on Plant Safety Measures Dashboard, Incidents Work Accidents. It is also available for immediate download and adjustment. So, changes can be made in the color, design, graphics or any other component to create a unique layout.
Business To Business Digital Channel Management B2B Sales Performance Tracking Dashboard Template PDF
This slide represents metric dashboard to track sales performance on e-commerce website. It cover performance indicators such as sales breakdown, order breakdown, recurring sales etc. Take your projects to the next level with our ultimate collection of Business To Business Digital Channel Management B2B Sales Performance Tracking Dashboard Template PDF. Slidegeeks has designed a range of layouts that are perfect for representing task or activity duration, keeping track of all your deadlines at a glance. Tailor these designs to your exact needs and give them a truly corporate look with your own brand colors they will make your projects stand out from the rest.
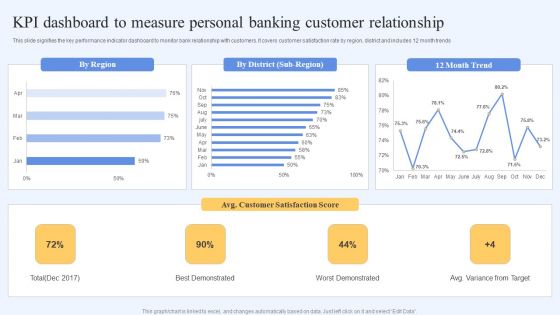
Kpi Dashboard To Measure Personal Banking Customer Relationship Themes PDF
This slide signifies the key performance indicator dashboard to monitor bank relationship with customers. It covers customer satisfaction rate by region, district and includes 12 month trends. Pitch your topic with ease and precision using this Kpi Dashboard To Measure Personal Banking Customer Relationship Themes PDF. This layout presents information on Customer Satisfaction, Best Demonstrated, Worst Demonstrated. It is also available for immediate download and adjustment. So, changes can be made in the color, design, graphics or any other component to create a unique layout.

Comprehensive Market Research Guide Brand Analytics Kpi Dashboard For Organization Brochure PDF
The following slide outlines key performance indicator KPI dashboard that can assist marketers to evaluate brand performance on social media channels. The metrics covered are age group, gender, brand perception, branding themes, celebrity analysis, etc. From laying roadmaps to briefing everything in detail, our templates are perfect for you. You can set the stage with your presentation slides. All you have to do is download these easy-to-edit and customizable templates. Comprehensive Market Research Guide Brand Analytics Kpi Dashboard For Organization Brochure PDF will help you deliver an outstanding performance that everyone would remember and praise you for. Do download this presentation today.
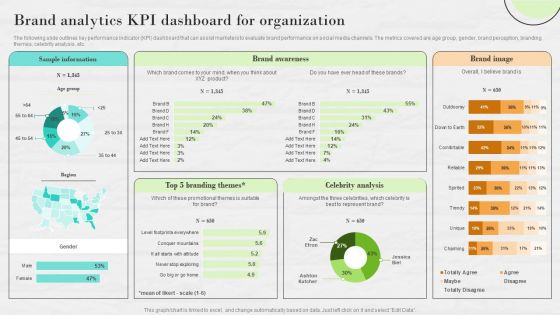
Market Research To Determine Business Opportunities Brand Analytics KPI Dashboard For Organization Inspiration PDF
The following slide outlines key performance indicator KPI dashboard that can assist marketers to evaluate brand performance on social media channels. The metrics covered are age group, gender, brand perception, branding themes, celebrity analysis, etc. There are so many reasons you need a Market Research To Determine Business Opportunities Brand Analytics KPI Dashboard For Organization Inspiration PDF. The first reason is you cannot spend time making everything from scratch, Thus, Slidegeeks has made presentation templates for you too. You can easily download these templates from our website easily.

KPI Dashboard To Measure User On Boarding In Ecommerce Business Microsoft PDF

Overview Of The Food Analyzing Product Launch Success With KPI Dashboard Mockup PDF
The following slide outlines key performance indicator KPI dashboard which will assist marketers to analyze the success of product launch. The metrics covered in the slide are related to total units produced, sales, average selling price ASP, penetrated planned customers, product mix, etc. Find a pre-designed and impeccable Overview Of The Food Analyzing Product Launch Success With KPI Dashboard Mockup PDF. The templates can ace your presentation without additional effort. You can download these easy-to-edit presentation templates to make your presentation stand out from others. So, what are you waiting for Download the template from Slidegeeks today and give a unique touch to your presentation.
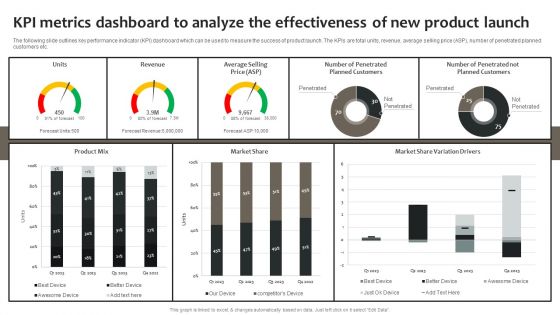
Effective Online And Offline Promotional Kpi Metrics Dashboard To Analyze The Effectiveness Of New Portrait PDF
The following slide outlines key performance indicator KPI dashboard which can be used to measure the success of product launch. The KPIs are total units, revenue, average selling price ASP, number of penetrated planned customers etc. From laying roadmaps to briefing everything in detail, our templates are perfect for you. You can set the stage with your presentation slides. All you have to do is download these easy-to-edit and customizable templates. Effective Online And Offline Promotional Kpi Metrics Dashboard To Analyze The Effectiveness Of New Portrait PDF will help you deliver an outstanding performance that everyone would remember and praise you for. Do download this presentation today.

KPI Dashboard To Track Project Management And Performance Elements PDF
Following slide represents dashboard to track project overall performance. It includes indicators such as progress, time duration , risks and issues. Welcome to our selection of the KPI Dashboard To Track Project Management And Performance Elements PDF. These are designed to help you showcase your creativity and bring your sphere to life. Planning and Innovation are essential for any business that is just starting out. This collection contains the designs that you need for your everyday presentations. All of our PowerPoints are 100 percent editable, so you can customize them to suit your needs. This multi-purpose template can be used in various situations. Grab these presentation templates today
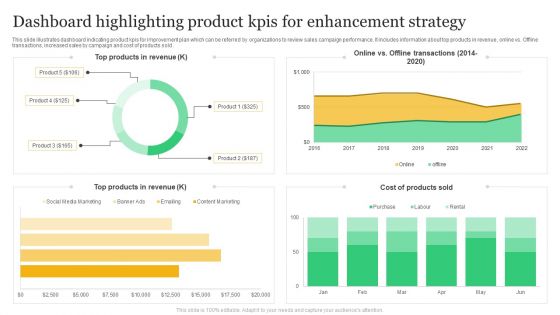
Dashboard Highlighting Product Kpis For Enhancement Strategy Structure PDF
This slide illustrates dashboard indicating product kpis for improvement plan which can be referred by organizations to review sales campaign performance. It includes information about top products in revenue, online vs. Offline transactions, increased sales by campaign and cost of products sold. Showcasing this set of slides titled Dashboard Highlighting Product Kpis For Enhancement Strategy Structure PDF. The topics addressed in these templates are Revenue, Products, Cost. All the content presented in this PPT design is completely editable. Download it and make adjustments in color, background, font etc. as per your unique business setting.
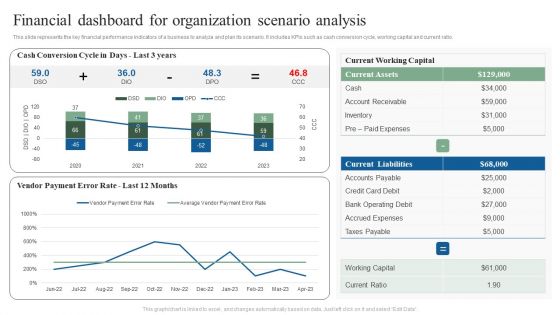
Financial Dashboard For Organization Scenario Analysis Ppt Show Ideas PDF
This slide represents the key financial performance indicators of a business to analyze and plan its scenario. It includes KPIs such as cash conversion cycle, working capital and current ratio. Showcasing this set of slides titled Financial Dashboard For Organization Scenario Analysis Ppt Show Ideas PDF. The topics addressed in these templates are Current Working Capital, Current Liabilities, Current Assets. All the content presented in this PPT design is completely editable. Download it and make adjustments in color, background, font etc. as per your unique business setting.

Dashboard To Track Progress Post Implementing Drug Launch Strategy Slides PDF
Following dashboard provides a brief overview of progress post implementing drug launch strategy which can be used by medical representatives to monitor the effectiveness. The key performance indicators are units sold, target, revenue, units unsold etc. Showcasing this set of slides titled Dashboard To Track Progress Post Implementing Drug Launch Strategy Slides PDF. The topics addressed in these templates are Planning, Design, Development, Testing, Launch. All the content presented in this PPT design is completely editable. Download it and make adjustments in color, background, font etc. as per your unique business setting.
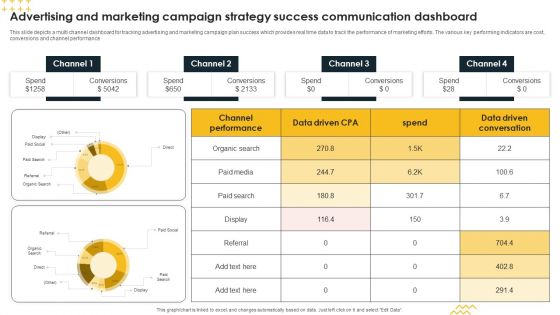
Advertising And Marketing Campaign Strategy Success Communication Dashboard Inspiration PDF
This slide depicts a multi channel dashboard for tracking advertising and marketing campaign plan success which provides real time data to track the performance of marketing efforts. The various key performing indicators are cost, conversions and channel performance Showcasing this set of slides titled Advertising And Marketing Campaign Strategy Success Communication Dashboard Inspiration PDF. The topics addressed in these templates are Conversions, Spend, Channel. All the content presented in this PPT design is completely editable. Download it and make adjustments in color, background, font etc. as per your unique business setting.

Dashboard Highlighting Status Of Clipart PDF
This dashboard depicts the current status of employee turnover which can be used by managers to create effective hiring plans and calculate hiring costs. The key performance indicators are total employees, age distribution, most costly role, employee attrition count, duration served by employees etc. Showcasing this set of slides titled Dashboard Highlighting Status Of Clipart PDF. The topics addressed in these templates are Dashboard Highlighting Status, HR Attrition. All the content presented in this PPT design is completely editable. Download it and make adjustments in color, background, font etc. as per your unique business setting.
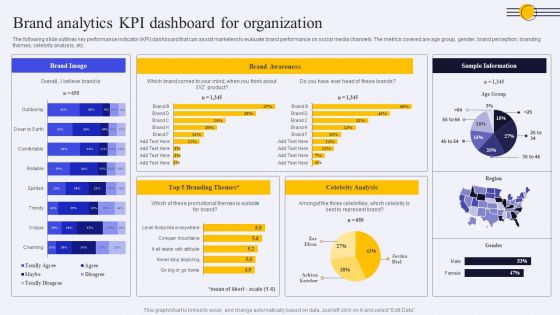
Brand Analytics KPI Dashboard For Organization Ppt PowerPoint Presentation Diagram PDF
The following slide outlines key performance indicator KPI dashboard that can assist marketers to evaluate brand performance on social media channels. The metrics covered are age group, gender, brand perception, branding themes, celebrity analysis, etc. Take your projects to the next level with our ultimate collection of Brand Analytics KPI Dashboard For Organization Ppt PowerPoint Presentation Diagram PDF. Slidegeeks has designed a range of layouts that are perfect for representing task or activity duration, keeping track of all your deadlines at a glance. Tailor these designs to your exact needs and give them a truly corporate look with your own brand colors they will make your projects stand out from the rest.
Executive Dashboards For Tracking Financial Health Of Enterprise Diagrams PDF
This slide represents the CEO dashboard to track the financial health of an organization. It includes key performance indicators such as revenue, expenses, activity ratio, gross profit margin, EBIT etc. Pitch your topic with ease and precision using this Executive Dashboards For Tracking Financial Health Of Enterprise Diagrams PDF. This layout presents information on Revenue, Expense, Activity Ratio. It is also available for immediate download and adjustment. So, changes can be made in the color, design, graphics or any other component to create a unique layout.
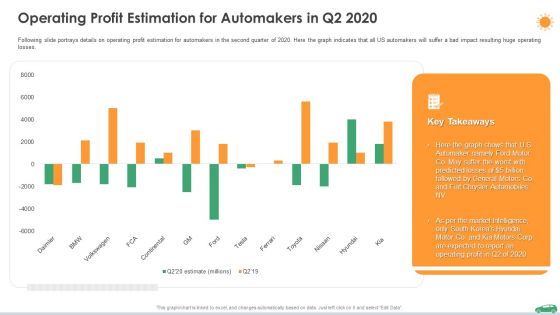
Operating Profit Estimation For Automakers In Q2 2020 Ppt Visual Aids Example 2015 PDF
Following slide portrays details on operating profit estimation for automakers in the second quarter of 2020. Here the graph indicates that all US automakers will suffer a bad impact resulting huge operating losses. Deliver an awe inspiring pitch with this creative operating profit estimation for automakers in q2 2020 ppt visual aids example 2015 pdf bundle. Topics like market, operating, profit can be discussed with this completely editable template. It is available for immediate download depending on the needs and requirements of the user.

Post Implementation Other Operation And Financial Kpis Summary PDF
The slide provides five years graphs 2022F to 2026F forecasted number of major KPIs key performance indicators, that might help to track the performance of ABC Railway. Covered KPIs include Revenue, Total Passengers, operating income, customer satisfaction rate etc.Deliver and pitch your topic in the best possible manner with this post implementation other operation and financial KPIs summary pdf. Use them to share invaluable insights on total passengers, operating income, revenue, 2022 to 2026 and impress your audience. This template can be altered and modified as per your expectations. So, grab it now.

Coronavirus Impact On Product Launches For 2020 Information PDF
Following slide provides information about the COVID 19 impact product launches for 2020. Here the graph indicates that 57 percentage products launches have been delayed and 6 percentage were cancelled due to the pandemic. Deliver and pitch your topic in the best possible manner with this coronavirus impact on product launches for 2020 information pdf. Use them to share invaluable insights on coronavirus impact on product launches for 2020 and impress your audience. This template can be altered and modified as per your expectations. So, grab it now.
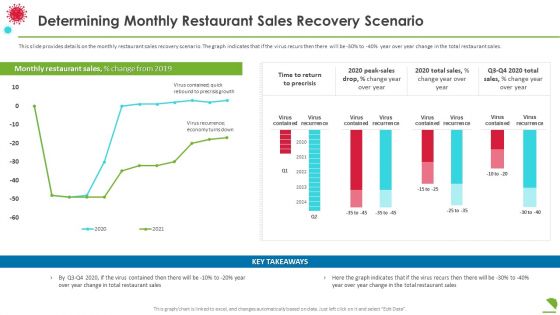
Determining Monthly Restaurant Sales Recovery Scenario Professional PDF
This slide provides details on the monthly restaurant sales recovery scenario. The graph indicates that if the virus recurs then there will be 30percentage to 40 percentage year over year change in the total restaurant sales. Deliver an awe inspiring pitch with this creative determining monthly restaurant sales recovery scenario professional pdf bundle. Topics like determining monthly restaurant sales recovery scenario can be discussed with this completely editable template. It is available for immediate download depending on the needs and requirements of the user.
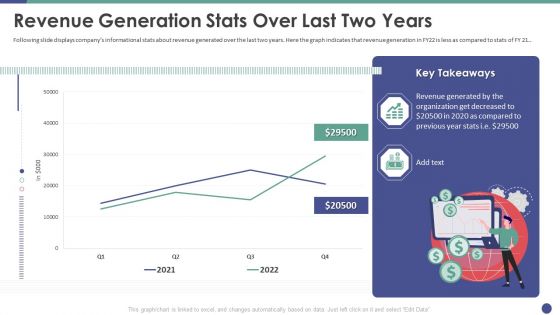
QC Engineering Revenue Generation Stats Over Last Two Years Ppt Portfolio Graphics Tutorials PDF
Following slide displays companys informational stats about revenue generated over the last two years. Here the graph indicates that revenue generation in FY22 is less as compared to stats of FY21. Deliver an awe inspiring pitch with this creative qc engineering revenue generation stats over last two years ppt portfolio graphics tutorials pdf bundle. Topics like revenue generation stats over last two years can be discussed with this completely editable template. It is available for immediate download depending on the needs and requirements of the user.
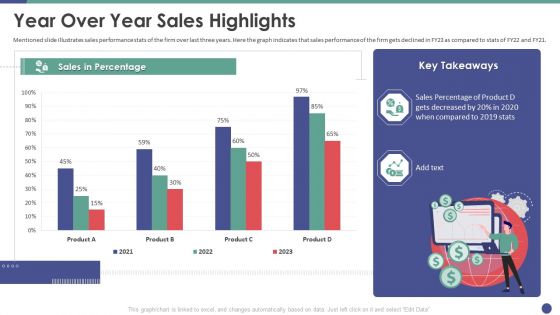
QC Engineering Year Over Year Sales Highlights Ppt Styles Design Inspiration PDF
Mentioned slide illustrates sales performance stats of the firm over last three years. Here the graph indicates that sales performance of the firm gets declined in FY23 as compared to stats of FY22 and FY21. Deliver an awe inspiring pitch with this creative qc engineering year over year sales highlights ppt styles design inspiration pdf bundle. Topics like year over year sales highlights can be discussed with this completely editable template. It is available for immediate download depending on the needs and requirements of the user.

Building Brand Image Of A Railway Firm Other Operational And Financial Kpis Structure PDF
The slide provides five years graphs of major KPIs key performance indicators, which might help the company to track its performance. Covered KPIs include revenue, total passengers, operating income, customer satisfaction rate etc. Deliver and pitch your topic in the best possible manner with this building brand image of a railway firm other operational and financial kpis structure pdf. Use them to share invaluable insights on operating income, customer satisfaction, revenue and impress your audience. This template can be altered and modified as per your expectations. So, grab it now.
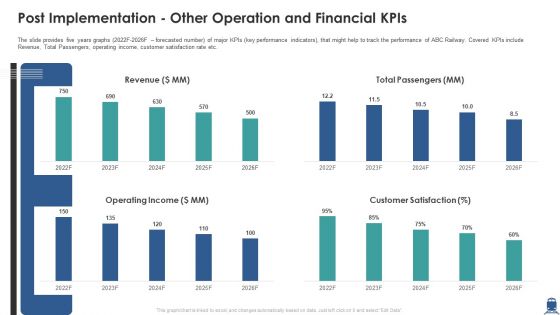
Post Implementation Other Operation And Financial Kpis Inspiration PDF
The slide provides five years graphs 2022F-2026F forecasted number of major KPIs key performance indicators, that might help to track the performance of ABC Railway. Covered KPIs include Revenue, Total Passengers, operating income, customer satisfaction rate etc. Deliver and pitch your topic in the best possible manner with this post implementation other operation and financial kpis inspiration pdf. Use them to share invaluable insights on revenue, operating income, customer satisfaction and impress your audience. This template can be altered and modified as per your expectations. So, grab it now.

Professional Scrum Master Training IT Percent Change In Workplace Productivity Post Adoption Ideas PDF
Following slide illustrates informational stats about percent change in workplace productivity post agile methodology adaption. Here the graph indicates that workplace productivity gets decreased by 1.6 percent. Deliver and pitch your topic in the best possible manner with this professional scrum master training it percent change in workplace productivity post adoption ideas pdf. Use them to share invaluable insights on percent change in workplace productivity post adoption and impress your audience. This template can be altered and modified as per your expectations. So, grab it now.

Project Management Professional Certification IT Statistics Highlighting Salary Advantage Of Being A PMP Certified Microsoft PDF
Mentioned slide provides informational stats about salary advantage of being a PMP certified project manager. Here the graph indicates that there is a difference of 10k between certificate holder and non-certificate holder. Deliver an awe inspiring pitch with this creative project management professional certification it statistics highlighting salary advantage of being a pmp certified microsoft pdf bundle. Topics like statistics highlighting salary advantage of being a pmp certified can be discussed with this completely editable template. It is available for immediate download depending on the needs and requirements of the user.
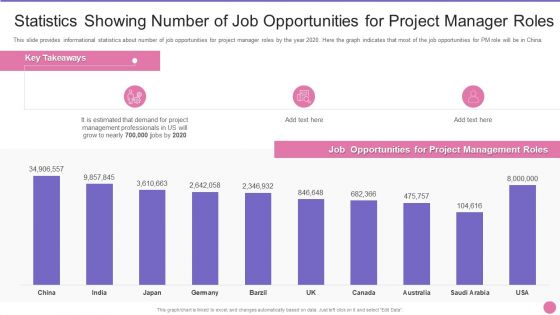
Project Management Professional Certification IT Statistics Showing Number Of Job Opportunities For Project Manager Roles Microsoft PDF
This slide provides informational statistics about number of job opportunities for project manager roles by the year 2020. Here the graph indicates that most of the job opportunities for PM role will be in China. Deliver and pitch your topic in the best possible manner with this project management professional certification it statistics showing number of job opportunities for project manager roles microsoft pdf. Use them to share invaluable insights on grow, management, opportunities and impress your audience. This template can be altered and modified as per your expectations. So, grab it now.
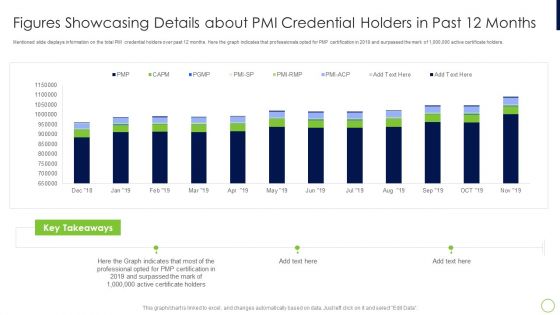
Agile Professional Certification PMI IT Figures Showcasing Holders In Past 12 Months Demonstration PDF
Mentioned slide displays information on the total PMI credential holders over past 12 months. Here the graph indicates that professionals opted for PMP certification in 2019 and surpassed the mark of 1,000,000 active certificate holders.Deliver and pitch your topic in the best possible manner with this agile professional certification pmi it figures showcasing holders in past 12 months demonstration pdf Use them to share invaluable insights on figures showcasing details about pmi credential holders in past 12 months and impress your audience. This template can be altered and modified as per your expectations. So, grab it now.

 Home
Home