Gauge Chart
Inventory Management Metrics With Out Of Stock Items Ppt PowerPoint Presentation Icon Images PDF
Presenting this set of slides with name inventory management metrics with out of stock items ppt powerpoint presentation icon images pdf. The topics discussed in these slides are carrying cost of inventory, inventory accuracy, out of stock items, inventory turnover last 5 years, accuracy meter. This is a completely editable PowerPoint presentation and is available for immediate download. Download now and impress your audience.
Online Risk Management Dashboard For Tracking Threats And Attacks Icons PDF
The purpose of this slide is to represent dashboard to monitor risks and cyber threats for efficient risk management. It includes various types of key performance indicators such as types of risks, severities, sources and risk meter. Showcasing this set of slides titled Online Risk Management Dashboard For Tracking Threats And Attacks Icons PDF. The topics addressed in these templates are Attack, Indication Severities, Sources. All the content presented in this PPT design is completely editable. Download it and make adjustments in color, background, font etc. as per your unique business setting.
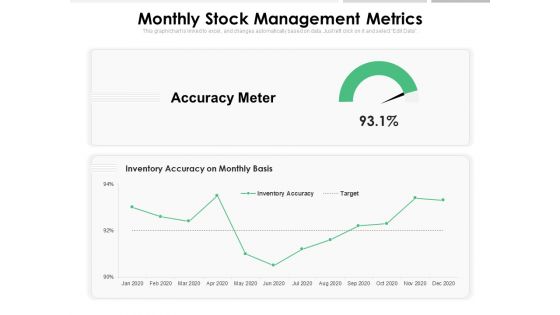
Monthly Stock Management Metrics Ppt PowerPoint Presentation Inspiration Format PDF
Presenting this set of slides with name monthly stock management metrics ppt powerpoint presentation inspiration format pdf. The topics discussed in these slides are accuracy meter, inventory accuracy on monthly basis, target. This is a completely editable PowerPoint presentation and is available for immediate download. Download now and impress your audience.
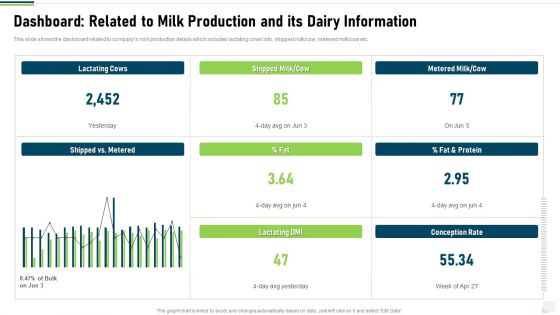
Dashboard Related To Milk Production And Its Dairy Information Diagrams PDF
This slide shows the dashboard related to companys milk production details which includes lactating cows info, shipped milk or cow, metered milk or cow etc. Deliver and pitch your topic in the best possible manner with this dashboard related to milk production and its dairy information diagrams pdf. Use them to share invaluable insights on dashboard related to milk production and its dairy information and impress your audience. This template can be altered and modified as per your expectations. So, grab it now.
Brand Improvement Techniques To Build Consumer Loyalty Evaluating The Impact Of Marketing Strategies Icons PDF
The following slide outlines a comprehensive line chart indicating the market share of our company and the most successful competitor. Information covered in this slide is related to four quarters. Retrieve professionally designed Brand Improvement Techniques To Build Consumer Loyalty Evaluating The Impact Of Marketing Strategies Icons PDF to effectively convey your message and captivate your listeners. Save time by selecting pre made slideshows that are appropriate for various topics, from business to educational purposes. These themes come in many different styles, from creative to corporate, and all of them are easily adjustable and can be edited quickly. Access them as PowerPoint templates or as Google Slides themes. You do not have to go on a hunt for the perfect presentation because Slidegeeks got you covered from everywhere.
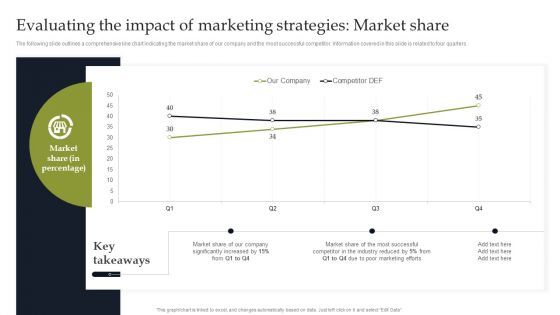
Evaluating The Impact Of Marketing Strategies Market Share Topics PDF
The following slide outlines a comprehensive line chart indicating the market share of our company and the most successful competitor. Information covered in this slide is related to four quarters. Do you have to make sure that everyone on your team knows about any specific topic I yes, then you should give Evaluating The Impact Of Marketing Strategies Market Share Topics PDF a try. Our experts have put a lot of knowledge and effort into creating this impeccable Evaluating The Impact Of Marketing Strategies Market Share Topics PDF. You can use this template for your upcoming presentations, as the slides are perfect to represent even the tiniest detail. You can download these templates from the Slidegeeks website and these are easy to edit. So grab these today.

Brand Building Techniques Enhance Customer Engagement Loyalty Continuous Increase In Customer Graphics PDF
The following slide outlines a comprehensive line chart indicating attrition rate. Information covered in this slide is related to quarterly percentage of customer churn rate along with key takeaways. Create an editable Brand Building Techniques Enhance Customer Engagement Loyalty Continuous Increase In Customer Graphics PDF that communicates your idea and engages your audience. Whether you are presenting a business or an educational presentation, pre designed presentation templates help save time. Brand Building Techniques Enhance Customer Engagement Loyalty Continuous Increase In Customer Graphics PDF is highly customizable and very easy to edit, covering many different styles from creative to business presentations. Slidegeeks has creative team members who have crafted amazing templates. So, go and get them without any delay.

Activity Management Customer Relationship Management Dashboard With Lead Status Portrait PDF
This slide illustrates graphical representation of activity management CRM statistical data. It includes sales team lead status, revenue meter, campaigns revenue graph. Showcasing this set of slides titled Activity Management Customer Relationship Management Dashboard With Lead Status Portrait PDF. The topics addressed in these templates are Sales Team Lead Status, Leads Sourced From Market. All the content presented in this PPT design is completely editable. Download it and make adjustments in color, background, font etc. as per your unique business setting.
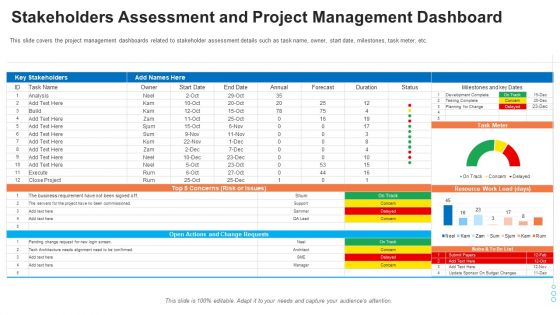
Evaluation Mapping Stakeholders Assessment And Project Management Dashboard Structure PDF
This slide covers the project management dashboards related to stakeholder assessment details such as task name, owner, start date, milestones, task meter, etc. Deliver an awe-inspiring pitch with this creative evaluation mapping stakeholders assessment and project management dashboard structure pdf bundle. Topics like stakeholders assessment and project management dashboard can be discussed with this completely editable template. It is available for immediate download depending on the needs and requirements of the user.
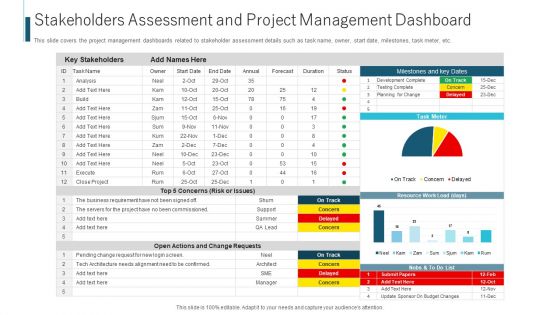
Stakeholders Assessment And Project Management Dashboard Ppt Ideas Outline PDF
This slide covers the project management dashboards related to stakeholder assessment details such as task name, owner, start date, milestones, task meter, etc. Deliver and pitch your topic in the best possible manner with this stakeholders assessment and project management dashboard ppt ideas outline pdf. Use them to share invaluable insights on risk or issues, business requirement, analysis and impress your audience. This template can be altered and modified as per your expectations. So, grab it now.

Stakeholders Assessment And Project Management Dashboard Formats PDF
This slide covers the project management dashboards related to stakeholder assessment details such as task name, owner, start date, milestones, task meter, etc. Deliver an awe inspiring pitch with this creative stakeholders assessment and project management dashboard formats pdf bundle. Topics like resource, stakeholders, analysis can be discussed with this completely editable template. It is available for immediate download depending on the needs and requirements of the user.
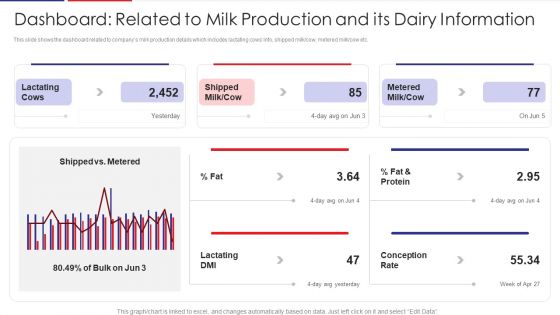
Examination Of Buyer Mindset Towards Dairy Products Dashboard Related To Milk Production Sample PDF
This slide shows the dashboard related to companys milk production details which includes lactating cows info, shipped milk or cow, metered milk or cow etc. Deliver an awe inspiring pitch with this creative examination of buyer mindset towards dairy products dashboard related to milk production sample pdf bundle. Topics like dashboard related to milk production and its dairy information can be discussed with this completely editable template. It is available for immediate download depending on the needs and requirements of the user.

Factor Influencing User Experience Dairy Industry Dashboard Related To Milk Production Guidelines PDF
This slide shows the dashboard related to companys milk production details which includes lactating cows info, shipped milkcow, metered milk cow etc. Deliver and pitch your topic in the best possible manner with this factor influencing user experience dairy industry dashboard related to milk production guidelines pdf . Use them to share invaluable insights on dashboard related to milk production and its dairy information and impress your audience. This template can be altered and modified as per your expectations. So, grab it now.

Budget Vs Actual Cost Comparison Dashboard Ppt PowerPoint Presentation Professional Format Ideas PDF
This slide illustrates fact and figures relating to various project budgets of a company. It includes monthly budget graph, project budget meter and budget vs. Actual costs chart.Pitch your topic with ease and precision using this Budget Vs Actual Cost Comparison Dashboard Ppt PowerPoint Presentation Professional Format Ideas PDF. This layout presents information on Milestones, Budget Graph, Manager. It is also available for immediate download and adjustment. So, changes can be made in the color, design, graphics or any other component to create a unique layout.

Key Features For Effective Business Management Infrastructure KPI Dashboard Showing Project Revenue Ppt Ideas File Formats PDF
Presenting this set of slides with name key features for effective business management infrastructure kpi dashboard showing project revenue ppt ideas file formats pdf. The topics discussed in these slides are construction and demolition west recycled, net project revenue per employee, square meter price, dollars per employee. This is a completely editable PowerPoint presentation and is available for immediate download. Download now and impress your audience.

Guidebook For Executing Business Market Intelligence Dashboard To Analyze Business Brochure PDF
The following slide showcases a dashboard to evaluate organizational performance in market and analyze competition. It outlines components such as number of mention, sentiment meter, number of mentions, geographical distribution. Find a pre designed and impeccable Guidebook For Executing Business Market Intelligence Dashboard To Analyze Business Brochure PDF. The templates can ace your presentation without additional effort. You can download these easy to edit presentation templates to make your presentation stand out from others. So, what are you waiting for Download the template from Slidegeeks today and give a unique touch to your presentation.

Analyzing The Impact Of Russia Ukraine Conflict On Gas Sector Overview Of Russian Federation Gas Sector Contd Sample PDF
The following slide showcases Russias current highlights for natural gas sector. It provides information about buyers, exports, million cubic meters MCM, liquefied natural gas LNG,imports, sanctions, etc. Deliver an awe inspiring pitch with this creative analyzing the impact of russia ukraine conflict on gas sector overview of russian federation gas sector contd sample pdf bundle. Topics like overview of russian federation gas sector contd can be discussed with this completely editable template. It is available for immediate download depending on the needs and requirements of the user.

Software Development Project Task Progress Scorecard Ideas PDF
This slide covers status summary of software development project and task allotment report. It includes details such as key stakeholders, tasks list, assigned person, start dates, top concerns, open actions, task meter,milestones, etc. Pitch your topic with ease and precision using this Software Development Project Task Progress Scorecard Ideas PDF. This layout presents information on Performance Analysis, Document Generation, Change Requests. It is also available for immediate download and adjustment. So, changes can be made in the color, design, graphics or any other component to create a unique layout.

Core Operational Competencies Risk Analysis Software Tool Graphics PDF
This slide covers the risk assessment meter with different operational and core objectives. It also includes the list and activity status of initiatives along with the status report. Pitch your topic with ease and precision using this Core Operational Competencies Risk Analysis Software Tool Graphics PDF. This layout presents information on Strategic Partnership, Market Value, Shareholder Investment. It is also available for immediate download and adjustment. So, changes can be made in the color, design, graphics or any other component to create a unique layout.

Non-Profit Organization Agency Program Status Report Diagrams PDF
The slide displays program report of non-profit organization for financial analysis. Various pie charts included are total revenue and program expense. Showcasing this set of slides titled Non-Profit Organization Agency Program Status Report Diagrams PDF. The topics addressed in these templates are Total Revenue, Program Expense, Report Indicates. All the content presented in this PPT design is completely editable. Download it and make adjustments in color, background, font etc. as per your unique business setting.
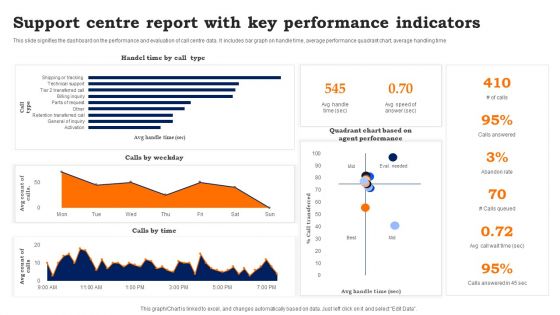
Support Centre Report With Key Performance Indicators Information PDF
This slide signifies the dashboard on the performance and evaluation of call centre data. It includes bar graph on handle time, average performance quadrant chart, average handling time. Showcasing this set of slides titled Support Centre Report With Key Performance Indicators Information PDF. The topics addressed in these templates are Support Centre Report, Key Performance Indicators. All the content presented in this PPT design is completely editable. Download it and make adjustments in color, background, font etc. as per your unique business setting.

Dashboard Indicating Hr Advisory Services Team Performance
This slide illustrates HR consultancy team performance dashboard. It provides information about hours of consultation, satisfaction rate, per consultant rate, popular counselors, etc. Pitch your topic with ease and precision using this dashboard indicating hr advisory services team performance download pdf. This layout presents information on dashboard indicating hr advisory services team performance. It is also available for immediate download and adjustment. So, changes can be made in the color, design, graphics or any other component to create a unique layout.
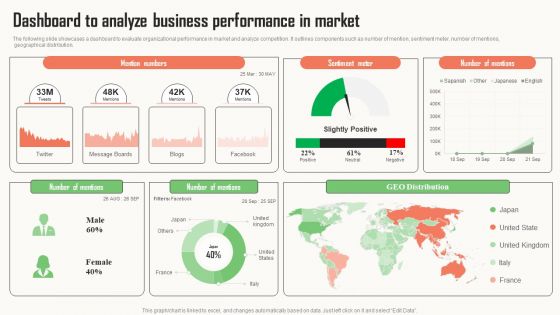
Strategic Market Insight Implementation Guide Dashboard To Analyze Business Performance In Market Slides PDF
The following slide showcases a dashboard to evaluate organizational performance in market and analyze competition. It outlines components such as number of mention, sentiment meter, number of mentions, geographical distribution. Get a simple yet stunning designed Strategic Market Insight Implementation Guide Dashboard To Analyze Business Performance In Market Slides PDF. It is the best one to establish the tone in your meetings. It is an excellent way to make your presentations highly effective. So, download this PPT today from Slidegeeks and see the positive impacts. Our easy to edit Strategic Market Insight Implementation Guide Dashboard To Analyze Business Performance In Market Slides PDF can be your go to option for all upcoming conferences and meetings. So, what are you waiting for Grab this template today.
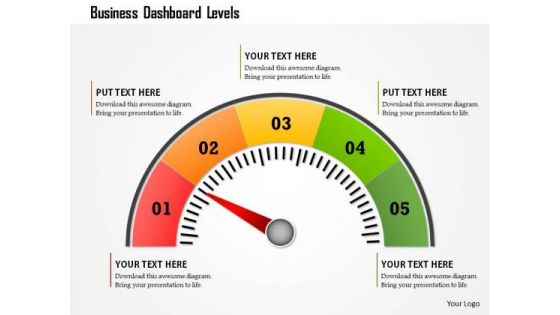
Business Framework Business Dashboard Levels PowerPoint Presentation
This business diagram displays colored meter with multiple levels. Use this diagram to display business process. This diagram can be used to indicate performance measures. This is an excellent diagram to impress your audiences.
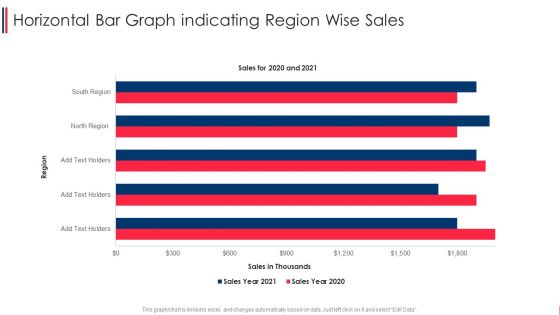
Horizontal Bar Graph Indicating Region Wise Sales Formats PDF
Pitch your topic with ease and precision using this horizontal bar graph indicating region wise sales formats pdf. This layout presents information on horizontal bar graph indicating region wise sales. It is also available for immediate download and adjustment. So, changes can be made in the color, design, graphics or any other component to create a unique layout.

Stacked Horizontal Bar Graph Indicating Organization Quarterly Sales Graphics PDF
Pitch your topic with ease and precision using this stacked horizontal bar graph indicating organization quarterly sales graphics pdf. This layout presents information on stacked horizontal bar graph indicating organization quarterly sales. It is also available for immediate download and adjustment. So, changes can be made in the color, design, graphics or any other component to create a unique layout.

Graph Indicating Clinical Trial Phases Probability Of Success Infographics PDF
This slide compares and visually presents the success rate of each stage with preceding one of the clinical research procedures to represent the achievement of the drug efficacy objective of the firm.Deliver and pitch your topic in the best possible manner with this Graph Indicating Clinical Trial Phases Probability Of Success Infographics PDF Use them to share invaluable insights on Graph Indicating Clinical Trial Phases Probability Of Success and impress your audience. This template can be altered and modified as per your expectations. So, grab it now.
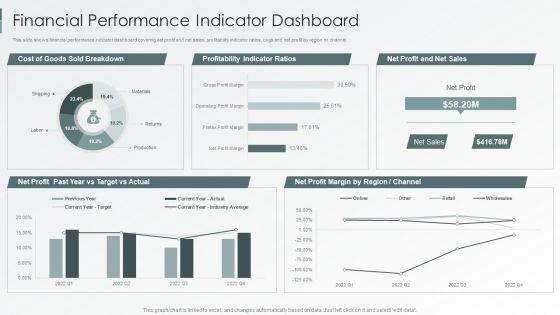
Enterprise Sustainability Performance Metrics Financial Performance Indicator Dashboard Themes PDF
This slide shows financial performance indicator dashboard covering net profit and net sales, profitability indicator ratios, cogs and net profit by region or channel.Deliver an awe inspiring pitch with this creative Enterprise Sustainability Performance Metrics Financial Performance Indicator Dashboard Themes PDF bundle. Topics like Profitability Indicator, Sold Breakdown, Target Actual can be discussed with this completely editable template. It is available for immediate download depending on the needs and requirements of the user.
Dashboard For Tracking Global Share Market Indices Formats PDF
Following slide represent a comprehensive dashboard to track stock market indices of different countries. The indices mentioned in the slide are DOW jones, NASDAQ, S and P along with the highest and lowest price of indices on a particular day. Showcasing this set of slides titled Dashboard For Tracking Global Share Market Indices Formats PDF. The topics addressed in these templates are Global Share, Market Indices, Abbreviations. All the content presented in this PPT design is completely editable. Download it and make adjustments in color, background, font etc. as per your unique business setting.

Key Statistics Of Share Market Indices Post Covid Sample PDF
Following slide showcase statistics of three major stock market indices of USA market. The indices mentioned in the slide are NASDAQ, S and P and Dow Jones along with the percentage change of each indices in every month. Showcasing this set of slides titled Key Statistics Of Share Market Indices Post Covid Sample PDF. The topics addressed in these templates are Percentage Change Post Covid, Increased Highest, Indices Post Covid. All the content presented in this PPT design is completely editable. Download it and make adjustments in color, background, font etc. as per your unique business setting.
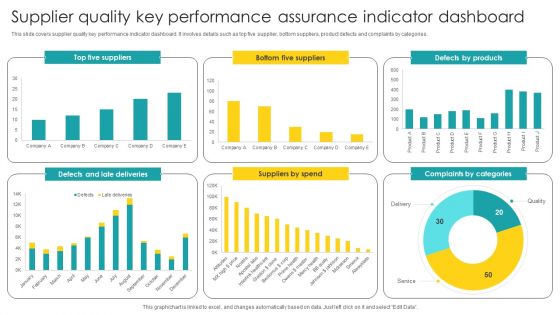
Supplier Quality Key Performance Assurance Indicator Dashboard Diagrams PDF
Showcasing this set of slides titled Supplier Quality Key Performance Assurance Indicator Dashboard Diagrams PDF. The topics addressed in these templates are Supplier Quality, Key Performance, Assurance Indicator. All the content presented in this PPT design is completely editable. Download it and make adjustments in color, background, font etc. as per your unique business setting.
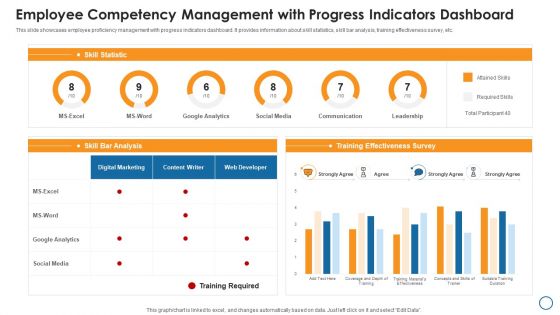
Employee Competency Management With Progress Indicators Dashboard Graphics PDF
This slide showcases employee proficiency management with progress indicators dashboard. It provides information about skill statistics, skill bar analysis, training effectiveness survey, etc. Showcasing this set of slides titled employee competency management with progress indicators dashboard graphics pdf. The topics addressed in these templates are google analytics, social media, survey. All the content presented in this PPT design is completely editable. Download it and make adjustments in color, background, font etc. as per your unique business setting.

Key Performance Indicators In Oil And Gas Industry Template PDF
Showcasing this set of slides titled key performance indicators in oil and gas industry template pdf. The topics addressed in these templates are key performance indicators in oil and gas industry. All the content presented in this PPT design is completely editable. Download it and make adjustments in color, background, font etc. as per your unique business setting.

Team Management Dashboard Indicating Contract Details Diagrams PDF
This slide illustrates team management dashboard indicating agreement details which contains annual value, suppliers, types, renewals, categories, etc. Showcasing this set of slides titled Team Management Dashboard Indicating Contract Details Diagrams PDF. The topics addressed in these templates are Suppliers, Agreements, Total Annual Value. All the content presented in this PPT design is completely editable. Download it and make adjustments in color, background, font etc. as per your unique business setting.
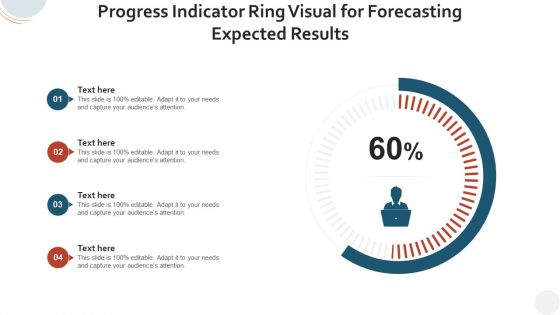
Progress Indicator Ring Visual For Forecasting Expected Results Diagrams PDF
Pitch your topic with ease and precision using this progress indicator ring visual for forecasting expected results diagrams pdf. This layout presents information on progress indicator ring visual for forecasting expected results. It is also available for immediate download and adjustment. So, changes can be made in the color, design, graphics or any other component to create a unique layout.
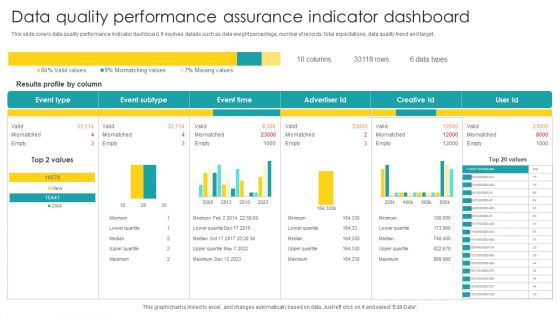
Data Quality Performance Assurance Indicator Dashboard Diagrams PDF
Pitch your topic with ease and precision using this Data Quality Performance Assurance Indicator Dashboard Diagrams PDF. This layout presents information on Data Quality Performance, Assurance Indicator Dashboard. It is also available for immediate download and adjustment. So, changes can be made in the color, design, graphics or any other component to create a unique layout.

Saas Metrics Dashboard Indicating Net Monthly Recurring Revenue Information PDF
Showcasing this set of slides titled Saas Metrics Dashboard Indicating Net Monthly Recurring Revenue Information PDF The topics addressed in these templates are Saas Metrics Dashboard Indicating Net Monthly Recurring Revenue All the content presented in this PPT design is completely editable. Download it and make adjustments in color, background, font etc. as per your unique business setting.
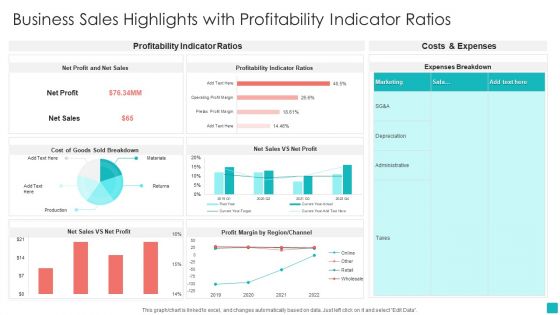
Business Sales Highlights With Profitability Indicator Ratios Download PDF
Showcasing this set of slides titled Business Sales Highlights With Profitability Indicator Ratios Download PDF. The topics addressed in these templates are Net Profit, Net Sales, Profitability Indicator Ratios. All the content presented in this PPT design is completely editable. Download it and make adjustments in color, background, font etc. as per your unique business setting.
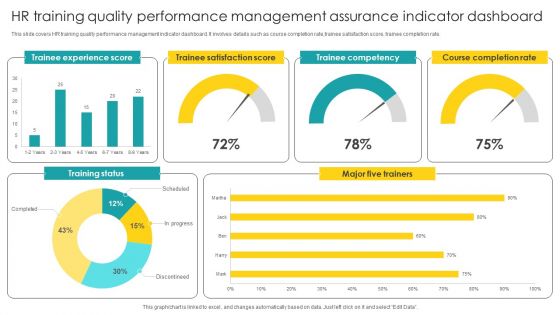
HR Training Quality Performance Management Assurance Indicator Dashboard Structure PDF
Showcasing this set of slides titled HR Training Quality Performance Management Assurance Indicator Dashboard Structure PDF. The topics addressed in these templates are Performance Management, Assurance Indicator Dashboard. All the content presented in this PPT design is completely editable. Download it and make adjustments in color, background, font etc. as per your unique business setting.

Product Quality Key Performance Assurance Indicator Dashboard Graphics PDF
Showcasing this set of slides titled Product Quality Key Performance Assurance Indicator Dashboard Graphics PDF. The topics addressed in these templates are Key Performance, Assurance Indicator, Dashboard. All the content presented in this PPT design is completely editable. Download it and make adjustments in color, background, font etc. as per your unique business setting.

Quality Assurance Key Performance Indicator Dashboard Structure PDF
Showcasing this set of slides titled Quality Assurance Key Performance Indicator Dashboard Structure PDF. The topics addressed in these templates are Key Performance, Indicator Dashboard. All the content presented in this PPT design is completely editable. Download it and make adjustments in color, background, font etc. as per your unique business setting.
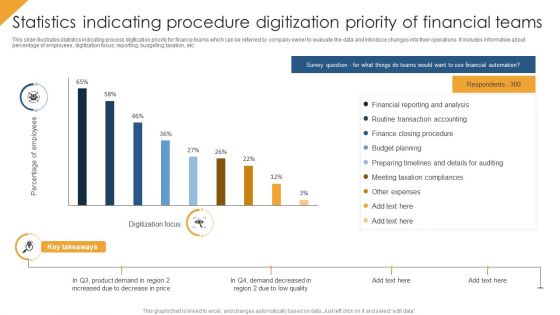
Statistics Indicating Procedure Digitization Priority Of Financial Teams Themes PDF
This slide illustrates statistics indicating process digitization priority for finance teams which can be referred by company owner to evaluate the data and introduce changes into their operations. It includes information about percentage of employees, digitization focus, reporting, budgeting, taxation, etc. Showcasing this set of slides titled Statistics Indicating Procedure Digitization Priority Of Financial Teams Themes PDF. The topics addressed in these templates are Budget Planning, Financial Reporting And Analysis, Other Expenses. All the content presented in this PPT design is completely editable. Download it and make adjustments in color, background, font etc. as per your unique business setting.
Sales Key Performance Indicators Dashboard Ppt PowerPoint Presentation Icon PDF
Presenting this set of slides with name sales key performance indicators dashboard ppt powerpoint presentation icon pdf. The topics discussed in these slides are current ticket volume, sales key performance, indicators dashboard. This is a completely editable PowerPoint presentation and is available for immediate download. Download now and impress your audience.
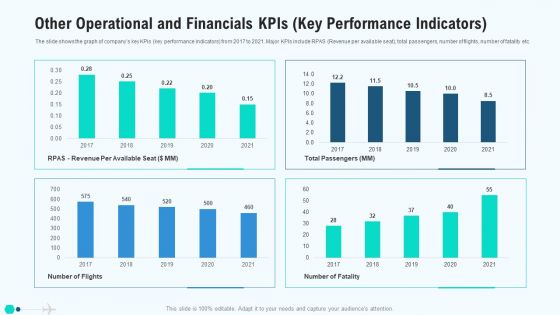
Other Operational And Financials Kpis Key Performance Indicators Clipart PDF
The slide shows the graph of companys key KPIs key performance indicators from 2017 to 2021. Major KPIs include RPAS Revenue per available seat, total passengers, number of flights, number of fatality etc. Deliver an awe inspiring pitch with this creative other operational and financials kpis key performance indicators clipart pdf bundle. Topics like other operational and financials kpis key performance indicators can be discussed with this completely editable template. It is available for immediate download depending on the needs and requirements of the user.

Other Operational And Financials Kpis Key Performance Indicators Professional PDF
The slide shows the graph of companys key KPIs key performance indicators from 2016 to 2020. Major KPIs include RPAS Revenue per available seat, total passengers, number of flights, number of fatality etc. Deliver an awe-inspiring pitch with this creative other operational and financials kpis key performance indicators professional pdf bundle. Topics like other operational and financials kpis key performance indicators can be discussed with this completely editable template. It is available for immediate download depending on the needs and requirements of the user.

Other Operational And Financials Kpis Key Performance Indicators Ideas PDF
The slide shows the graph of companys key KPIs key performance indicators from 2016 to 2020. Major KPIs include RPAS Revenue per available seat, total passengers, number of flights, number of fatality etc. Deliver an awe inspiring pitch with this creative other operational and financials kpis key performance indicators ideas pdf bundle. Topics like other operational and financials kpis key performance indicators can be discussed with this completely editable template. It is available for immediate download depending on the needs and requirements of the user.
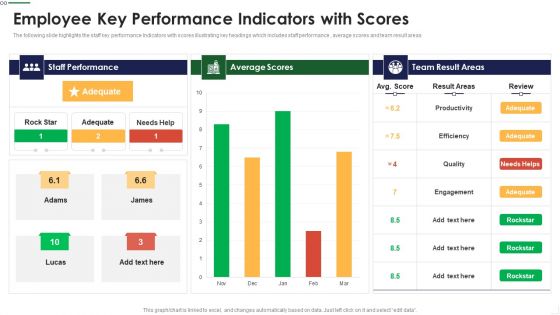
Employee Key Performance Indicators With Scores Themes PDF
The following slide highlights the staff key performance Indicators with scores illustrating key headings which includes staff performance , average scores and team result areas Pitch your topic with ease and precision using this Employee Key Performance Indicators With Scores Themes PDF This layout presents information on Staff Performance, Average Scores, Team Result It is also available for immediate download and adjustment. So, changes can be made in the color, design, graphics or any other component to create a unique layout.
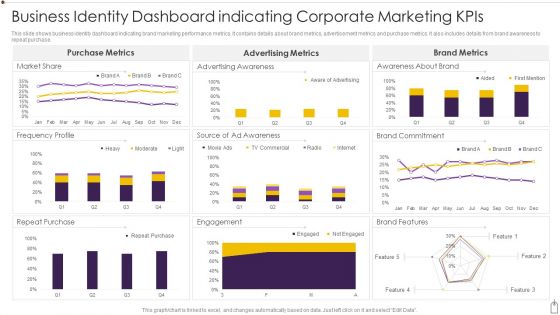
Business Identity Dashboard Indicating Corporate Marketing Kpis Diagrams PDF
This slide shows business identity dashboard indicating brand marketing performance metrics. It contains details about brand metrics, advertisement metrics and purchase metrics. It also includes details from brand awareness to repeat purchase. Showcasing this set of slides titled Business Identity Dashboard Indicating Corporate Marketing Kpis Diagrams PDF. The topics addressed in these templates are Purchase, Engagement, Market Share. All the content presented in this PPT design is completely editable. Download it and make adjustments in color, background, font etc. as per your unique business setting.
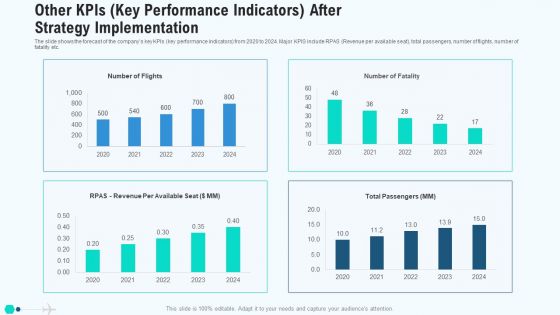
Other Kpis Key Performance Indicators After Strategy Implementation Mockup PDF
The slide shows the forecast of the companys key KPIs key performance indicators from 2020 to 2024. Major KPIS include RPAS Revenue per available seat, total passengers, number of flights, number of fatality etc. Deliver and pitch your topic in the best possible manner with this other kpis key performance indicators after strategy implementation mockup pdf. Use them to share invaluable insights on other kpis key performance indicators after strategy implementation and impress your audience. This template can be altered and modified as per your expectations. So, grab it now.
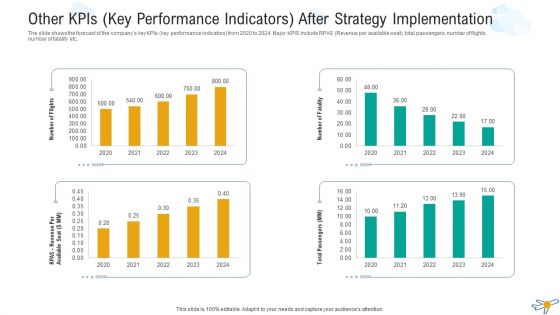
Other Kpis Key Performance Indicators After Strategy Implementation Microsoft PDF
The slide shows the forecast of the companys key KPIs key performance indicators from 2020 to 2024. Major KPIS include RPAS Revenue per available seat, total passengers, number of flights, number of fatality etc. Deliver and pitch your topic in the best possible manner with this other kpis key performance indicators after strategy implementation microsoft pdf. Use them to share invaluable insights on other kpis key performance indicators after strategy implementation and impress your audience. This template can be altered and modified as per your expectations. So, grab it now.
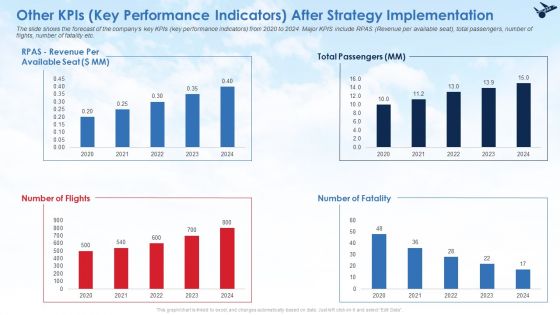
Other Kpis Key Performance Indicators After Strategy Implementation Infographics PDF
The slide shows the forecast of the companys key KPIs key performance indicators from 2020 to 2024. Major KPIS include RPAS Revenue per available seat, total passengers, number of flights, number of fatality etc. Deliver and pitch your topic in the best possible manner with this other kpis key performance indicators after strategy implementation infographics pdf. Use them to share invaluable insights on other kpis key performance indicators after strategy implementation and impress your audience. This template can be altered and modified as per your expectations. So, grab it now.

Third Party Vendors Risk Metrics Performance Indicators Dashboard Topics PDF
This slide illustrates graphical representation of risk key performance indicators. It includes third party vendors trust score, impact score and risk score. Pitch your topic with ease and precision using this Third Party Vendors Risk Metrics Performance Indicators Dashboard Topics PDF. This layout presents information on Third Party Vendors Risk Metrics Performance Indicators Dashboard. It is also available for immediate download and adjustment. So, changes can be made in the color, design, graphics or any other component to create a unique layout.
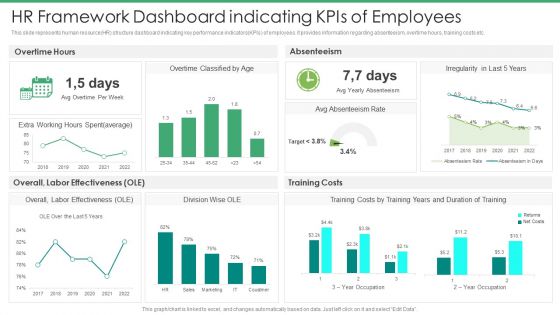
HR Framework Dashboard Indicating Kpis Of Employees Introduction PDF
This slide represents human resource HR structure dashboard indicating key performance indicators KPIs of employees. it provides information regarding absenteeism, overtime hours, training costs etc.Pitch your topic with ease and precision using this HR Framework Dashboard Indicating Kpis Of Employees Introduction PDF. This layout presents information on Absenteeism Rate, Costs, Average. It is also available for immediate download and adjustment. So, changes can be made in the color, design, graphics or any other component to create a unique layout.

Health And Safety Performance Measurements Key Risk Indicators Download PDF
This slide shows the different key indicators for safety performance measurement . It includes safety training, actions, events and reports with their level of completion.Showcasing this set of slides titled Health And Safety Performance Measurements Key Risk Indicators Download PDF The topics addressed in these templates are Safety Training, Actions Taken, Event Planned Executed All the content presented in this PPT design is completely editable. Download it and make adjustments in color, background, font etc. as per your unique business setting.
Sales By Lead Source Performance Indicator Ppt Icon Images PDF
Explore a selection of the finest Sales By Lead Source Performance Indicator Ppt Icon Images PDF here. With a plethora of professionally designed and pre made slide templates, you can quickly and easily find the right one for your upcoming presentation. You can use our Sales By Lead Source Performance Indicator Ppt Icon Images PDF to effectively convey your message to a wider audience. Slidegeeks has done a lot of research before preparing these presentation templates. The content can be personalized and the slides are highly editable. Grab templates today from Slidegeeks.
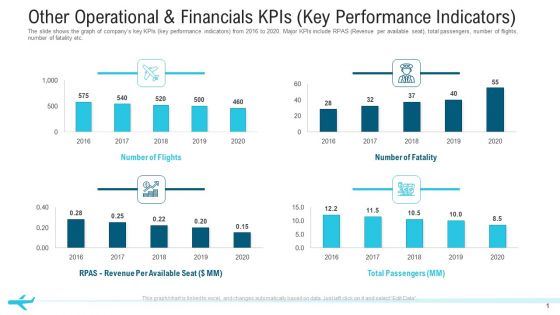
Other Operational And Financials Kpis Key Performance Indicators Structure PDF
The slide shows the graph of companys key KPIs key performance indicators from 2016 to 2020. Major KPIs include RPAS Revenue per available seat, total passengers, number of flights, number of fatality etc.Deliver an awe-inspiring pitch with this creative other operational and financials KPIs key performance indicators structure pdf. bundle. Topics like total passengers, number of flights,2016 to 2020 can be discussed with this completely editable template. It is available for immediate download depending on the needs and requirements of the user.
Financial Procedure Dashboard Indicating Yearly Revenue Analysis Icons PDF
This slide illustrates finance process dashboard indicating yearly revenue analysis which contains gross profit margin, operating profit ratio, net profit, revenue and cost of goods sold cogs operating expenses, etc. It can be referred by company owners who can compare it with previous years performance and make related decisions for future. Showcasing this set of slides titled Financial Procedure Dashboard Indicating Yearly Revenue Analysis Icons PDF. The topics addressed in these templates are Operating Profit Percentage, Net Profit Percentage, Operating Profit Ratio. All the content presented in this PPT design is completely editable. Download it and make adjustments in color, background, font etc. as per your unique business setting.

CRM Software Efficiency Indicators Designing And Deployment Elements PDF
This slide showcases the CRM software efficiency indicators which includes improved customer relationships, productivity, cost reduction, process and better Return on investment. Deliver an awe inspiring pitch with this creative crm software efficiency indicators designing and deployment elements pdf bundle. Topics like improved customer relationships, improved productivity, low spend and higher roi, business cost reduction, improve process can be discussed with this completely editable template. It is available for immediate download depending on the needs and requirements of the user.

Designing And Deployment CRM Software Efficiency Indicators Portrait PDF
The mentioned slide highlights the efficiency indicators related to investment in CRM software by different industries such as services, finance, IT and education. Deliver an awe inspiring pitch with this creative designing and deployment crm software efficiency indicators portrait pdf bundle. Topics like industries investing in crm 2021, finance, services, education, manufacturing, it can be discussed with this completely editable template. It is available for immediate download depending on the needs and requirements of the user.
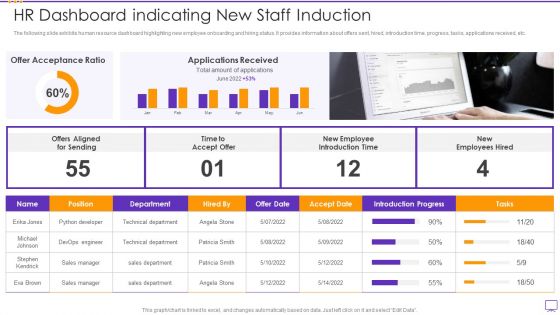
HR Dashboard Indicating New Staff Induction Portrait PDF
The following slide exhibits human resource dashboard highlighting new employee onboarding and hiring status. It provides information about offers sent, hired, introduction time, progress, tasks, applications received, etc. Showcasing this set of slides titled HR Dashboard Indicating New Staff Induction Portrait PDF. The topics addressed in these templates are HR Dashboard Indicating New Staff Induction. All the content presented in this PPT design is completely editable. Download it and make adjustments in color, background, font etc. as per your unique business setting.

 Home
Home