Gauge Chart
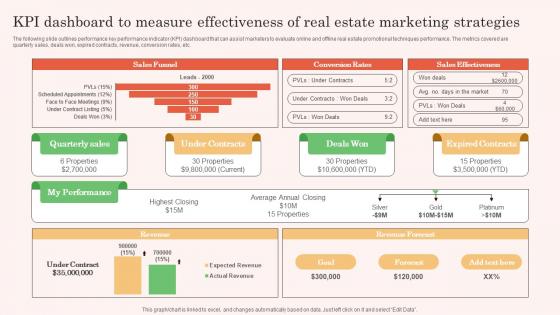
KPI Dashboard To Measure Effectivenesss Real Estate Property Marketing Themes Pdf
The following slide outlines performance key performance indicator KPI dashboard that can assist marketers to evaluate online and offline real estate promotional techniques performance. The metrics covered are quarterly sales, deals won, expired contracts, revenue, conversion rates, etc. Take your projects to the next level with our ultimate collection of KPI Dashboard To Measure Effectivenesss Real Estate Property Marketing Themes Pdf. Slidegeeks has designed a range of layouts that are perfect for representing task or activity duration, keeping track of all your deadlines at a glance. Tailor these designs to your exact needs and give them a truly corporate look with your own brand colors they all make your projects stand out from the rest.

Employee Engagement And Satisfaction Action Steps For Employee Engagement Guidelines Pdf
The following slide showcases employee engagement and satisfaction key performance indicators to encourage healthy team relationships. It includes key elements such as net promotor score, retention and absenteeism rate etc.This Employee Engagement And Satisfaction Action Steps For Employee Engagement Guidelines Pdf from Slidegeeks makes it easy to present information on your topic with precision. It provides customization options, so you can make changes to the colors, design, graphics, or any other component to create a unique layout. It is also available for immediate download, so you can begin using it right away. Slidegeeks has done good research to ensure that you have everything you need to make your presentation stand out. Make a name out there for a brilliant performance.
B2B Sales Performance Tracking Dashboard B2B Digital Commerce Graphics Pdf
This slide represents metric dashboard to track sales performance on e-commerce website. It cover performance indicators such as sales breakdown, order breakdown, recurring sales etc. This B2B Sales Performance Tracking Dashboard B2B Digital Commerce Graphics Pdf from Slidegeeks makes it easy to present information on your topic with precision. It provides customization options, so you can make changes to the colors, design, graphics, or any other component to create a unique layout. It is also available for immediate download, so you can begin using it right away. Slidegeeks has done good research to ensure that you have everything you need to make your presentation stand out. Make a name out there for a brilliant performance.
Online Tracking Optimize Website Marketing Intelligence Guide Data Gathering Introduction Pdf
The following slide provides overview of performance indicators for online tracking to manage and optimize user behavior on website. It highlights metrics such as web conversions, users, top landing pages, bounce rate, conversion rate, page, sessions and goals value. Presenting this PowerPoint presentation, titled Online Tracking Optimize Website Marketing Intelligence Guide Data Gathering Introduction Pdf, with topics curated by our researchers after extensive research. This editable presentation is available for immediate download and provides attractive features when used. Download now and captivate your audience. Presenting this Online Tracking Optimize Website Marketing Intelligence Guide Data Gathering Introduction Pdf. Our researchers have carefully researched and created these slides with all aspects taken into consideration. This is a completely customizable Online Tracking Optimize Website Marketing Intelligence Guide Data Gathering Introduction Pdf that is available for immediate downloading. Download now and make an impact on your audience. Highlight the attractive features available with our PPTs.
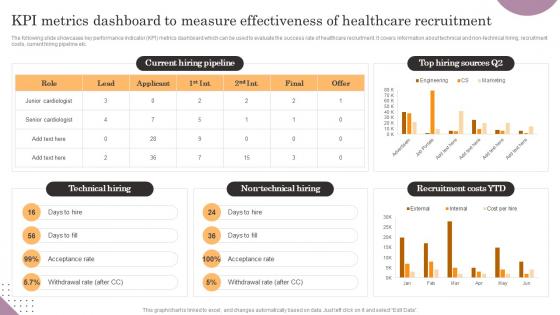
KPI Metrics Dashboard To Measure Effectiveness Of General Management Information Pdf
The following slide showcases key performance indicator KPI metrics dashboard which can be used to evaluate the success rate of healthcare recruitment. It covers information about technical and non-technical hiring, recruitment costs, current hiring pipeline etc. Presenting this PowerPoint presentation, titled KPI Metrics Dashboard To Measure Effectiveness Of General Management Information Pdf, with topics curated by our researchers after extensive research. This editable presentation is available for immediate download and provides attractive features when used. Download now and captivate your audience. Presenting this KPI Metrics Dashboard To Measure Effectiveness Of General Management Information Pdf. Our researchers have carefully researched and created these slides with all aspects taken into consideration. This is a completely customizable KPI Metrics Dashboard To Measure Effectiveness Of General Management Information Pdf that is available for immediate downloading. Download now and make an impact on your audience. Highlight the attractive features available with our PPTs.
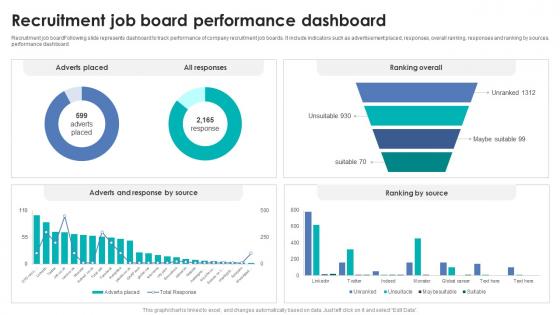
Integrating Automation For Effective Business Recruitment Job Board Performance Dashboard
Recruitment job boardFollowing slide represents dashboard to track performance of company recruitment job boards. It include indicators such as advertisement placed, responses, overall ranking, responses and ranking by sources performance dashboard. Presenting this PowerPoint presentation, titled Integrating Automation For Effective Business Recruitment Job Board Performance Dashboard, with topics curated by our researchers after extensive research. This editable presentation is available for immediate download and provides attractive features when used. Download now and captivate your audience. Presenting this Integrating Automation For Effective Business Recruitment Job Board Performance Dashboard. Our researchers have carefully researched and created these slides with all aspects taken into consideration. This is a completely customizable Integrating Automation For Effective Business Recruitment Job Board Performance Dashboard that is available for immediate downloading. Download now and make an impact on your audience. Highlight the attractive features available with our PPTs.
Web Consulting Business Various Kpis For Tracking Business Performance
Mentioned slide provide insights into various key performance indicators to determine business performance. It includes KPIs such as business financials, website traffic, customer case, customer engagement, conversion rate, customer retention, customer bounce rate, employee turnover, etc. This modern and well-arranged Web Consulting Business Various Kpis For Tracking Business Performance provides lots of creative possibilities. It is very simple to customize and edit with the Powerpoint Software. Just drag and drop your pictures into the shapes. All facets of this template can be edited with Powerpoint, no extra software is necessary. Add your own material, put your images in the places assigned for them, adjust the colors, and then you can show your slides to the world, with an animated slide included.
Tracking First Response Time With KPI Boosting Customer Retention Rate With Live Chat
The following slide depicts key performance indicators to review call resolution time and offer real time support. It also includes elements such as unsolved calls, weekly response time analysis, best day to call etc. Presenting this PowerPoint presentation, titled Tracking First Response Time With KPI Boosting Customer Retention Rate With Live Chat, with topics curated by our researchers after extensive research. This editable presentation is available for immediate download and provides attractive features when used. Download now and captivate your audience. Presenting this Tracking First Response Time With KPI Boosting Customer Retention Rate With Live Chat. Our researchers have carefully researched and created these slides with all aspects taken into consideration. This is a completely customizable Tracking First Response Time With KPI Boosting Customer Retention Rate With Live Chat that is available for immediate downloading. Download now and make an impact on your audience. Highlight the attractive features available with our PPTs.
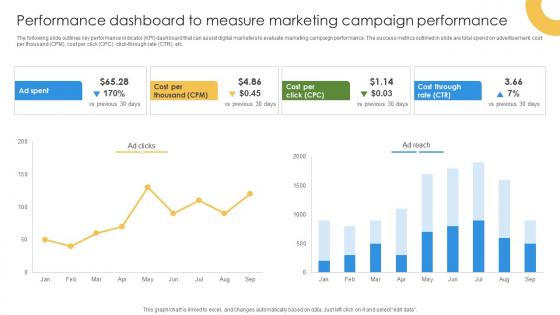
Marketing Growth Strategy Performance Dashboard To Measure Marketing Strategy SS V
The following slide outlines key performance indicator KPI dashboard that can assist digital marketers to evaluate marketing campaign performance. The success metrics outlined in slide are total spend on advertisement, cost per thousand CPM, cost per click CPC, click-through rate CTR, etc. Take your projects to the next level with our ultimate collection of Marketing Growth Strategy Performance Dashboard To Measure Marketing Strategy SS V. Slidegeeks has designed a range of layouts that are perfect for representing task or activity duration, keeping track of all your deadlines at a glance. Tailor these designs to your exact needs and give them a truly corporate look with your own brand colors they will make your projects stand out from the rest
Tracking First Response Time Improving Customer Retention PPT Presentation
The following slide depicts key performance indicators to review call resolution time and offer real time support. It also includes elements such as unsolved calls, weekly response time analysis, best day to call etc. Presenting this PowerPoint presentation, titled Tracking First Response Time Improving Customer Retention PPT Presentation, with topics curated by our researchers after extensive research. This editable presentation is available for immediate download and provides attractive features when used. Download now and captivate your audience. Presenting this Tracking First Response Time Improving Customer Retention PPT Presentation. Our researchers have carefully researched and created these slides with all aspects taken into consideration. This is a completely customizable Tracking First Response Time Improving Customer Retention PPT Presentation that is available for immediate downloading. Download now and make an impact on your audience. Highlight the attractive features available with our PPTs.

Quarterly Report Depicting Income And Cash Flow Statement KPIS Quarterly Report Ppt Example
This slide depicts the quarterly report, highlighting key financial performance indicators showing profit and loss trends alongside cash flow status, providing insights into the companys financial health, operational efficiency, and liquidity. Do you have an important presentation coming up Are you looking for something that will make your presentation stand out from the rest Look no further than Quarterly Report Depicting Income And Cash Flow Statement KPIS Quarterly Report Ppt Example With our professional designs, you can trust that your presentation will pop and make delivering it a smooth process. And with Slidegeeks, you can trust that your presentation will be unique and memorable. So why wait Grab Quarterly Report Depicting Income And Cash Flow Statement KPIS Quarterly Report Ppt Example today and make your presentation stand out from the rest
Tracking First Response Time Enhancing Customer Experience Ppt Presentation
The following slide depicts key performance indicators to review call resolution time and offer real time support. It also includes elements such as unsolved calls, weekly response time analysis, best day to call etc. Presenting this PowerPoint presentation, titled Tracking First Response Time Enhancing Customer Experience Ppt Presentation, with topics curated by our researchers after extensive research. This editable presentation is available for immediate download and provides attractive features when used. Download now and captivate your audience. Presenting this Tracking First Response Time Enhancing Customer Experience Ppt Presentation. Our researchers have carefully researched and created these slides with all aspects taken into consideration. This is a completely customizable Tracking First Response Time Enhancing Customer Experience Ppt Presentation that is available for immediate downloading. Download now and make an impact on your audience. Highlight the attractive features available with our PPTs.
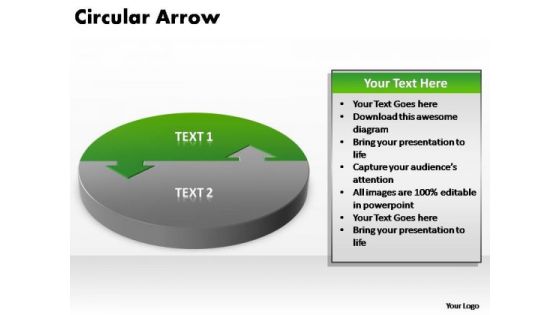
PowerPoint Theme Editable Circular Arrow Ppt Presentation
PowerPoint Theme Editable Circular Arrow PPT Presentation-The arrows indicate the progression of the process. Constant monitoring of the processes provides you with opportunities to concentrate on the core competencies in your business and improve the standards for more effective results.-PowerPoint Theme Editable Circular Arrow PPT Presentation

PowerPoint Theme Editable Circular Arrow Ppt Slides
PowerPoint Theme Editable Circular Arrow PPT Slides-The arrows indicate the progression of the process. Constant monitoring of the processes provides you with opportunities to concentrate on the core competencies in your business and improve the standards for more effective results.-PowerPoint Theme Editable Circular Arrow PPT Slides
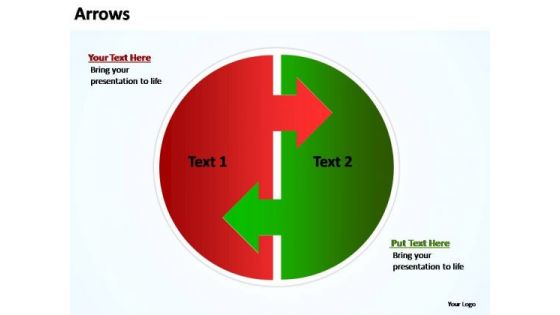
PowerPoint Slide Designs Leadership Arrows In Circle Ppt Design
PowerPoint Slide Designs Leadership Arrows In Circle PPT Design-The arrows indicate the progression of the process. Constant monitoring of the processes provides you with opportunities to concentrate on the core competencies in your business and improve the standards for more effective results.-PowerPoint Slide Designs Leadership Arrows In Circle PPT Design
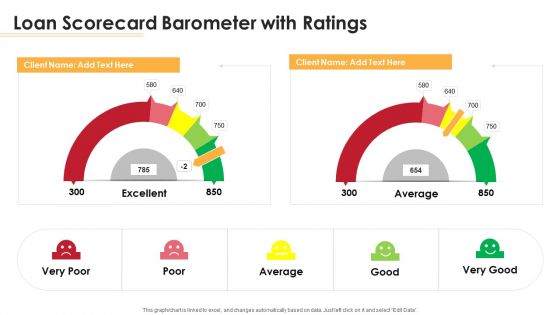
Loan Scorecard Barometer With Ratings Ppt Outline Information PDF
Deliver an awe inspiring pitch with this creative loan scorecard barometer with ratings ppt outline information pdf bundle. Topics like loan scorecard barometer with ratings can be discussed with this completely editable template. It is available for immediate download depending on the needs and requirements of the user.

Finance Metrics Dashboard Indicating Product And Service Revenue Designs PDF
This graph or chart is linked to excel, and changes automatically based on data. Just left click on it and select edit data. Showcasing this set of slides titled Finance Metrics Dashboard Indicating Product And Service Revenue Designs PDF. The topics addressed in these templates are Maintenance Revenue Product, Revenue Product Revenues, Service Revenue Rolling. All the content presented in this PPT design is completely editable. Download it and make adjustments in color, background, font etc. as per your unique business setting.

Finance Metrics Dashboard Indicating Portfolio Performance Microsoft PDF
This graph or chart is linked to excel, and changes automatically based on data. Just left click on it and select edit data. Pitch your topic with ease and precision using this Finance Metrics Dashboard Indicating Portfolio Performance Microsoft PDF. This layout presents information on Portfolio Performance Portfolio, Asset Management Manager, Top 10 Assets. It is also available for immediate download and adjustment. So, changes can be made in the color, design, graphics or any other component to create a unique layout.
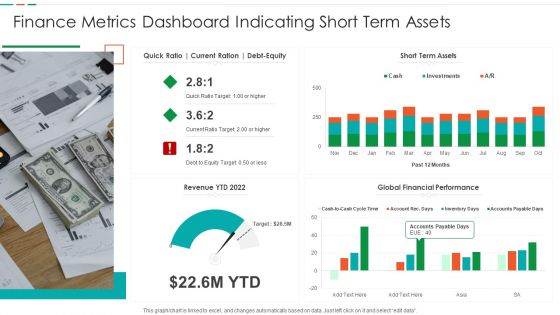
Finance Metrics Dashboard Indicating Short Term Assets Download PDF
This graph or chart is linked to excel, and changes automatically based on data. Just left click on it and select edit data. Pitch your topic with ease and precision using this Finance Metrics Dashboard Indicating Short Term Assets Download PDF. This layout presents information on Short Term Assets, Global Financial Performance, Revenue YTD 2022. It is also available for immediate download and adjustment. So, changes can be made in the color, design, graphics or any other component to create a unique layout.

SLA KPL Dashboard Indicating Compliance Priority With KPI Ppt File Format PDF
This graph or chart is linked to excel, and changes automatically based on data. Just left click on it and select Edit Data. Showcasing this set of slides titled SLA KPL Dashboard Indicating Compliance Priority With KPI Ppt File Format PDF. The topics addressed in these templates are KPI Graph, Insights Here, SLA Compliance Priority. All the content presented in this PPT design is completely editable. Download it and make adjustments in color, background, font etc. as per your unique business setting.

SLA KPL Dashboard Indicating Top Week Performers Ppt Infographics Examples PDF
This graph or chart is linked to excel, and changes automatically based on data. Just left click on it and select Edit Data. Showcasing this set of slides titled SLA KPL Dashboard Indicating Top Week Performers Ppt Infographics Examples PDF. The topics addressed in these templates are Active Slas Risk, Active Slas Breached, Active Slas. All the content presented in this PPT design is completely editable. Download it and make adjustments in color, background, font etc. as per your unique business setting.
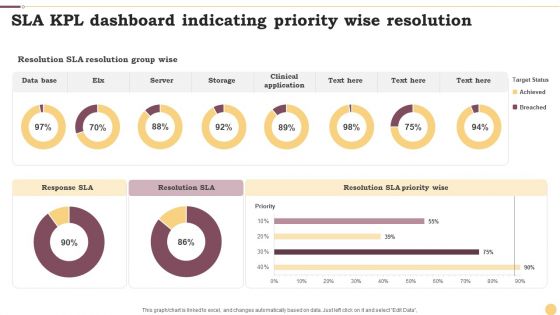
SLA KPL Dashboard Indicating Priority Wise Resolution Ppt Infographics Example File PDF
This graph or chart is linked to excel, and changes automatically based on data. Just left click on it and select Edit Data. Pitch your topic with ease and precision using this SLA KPL Dashboard Indicating Priority Wise Resolution Ppt Infographics Example File PDF. This layout presents information on Data Base, Server, Storage. It is also available for immediate download and adjustment. So, changes can be made in the color, design, graphics or any other component to create a unique layout.
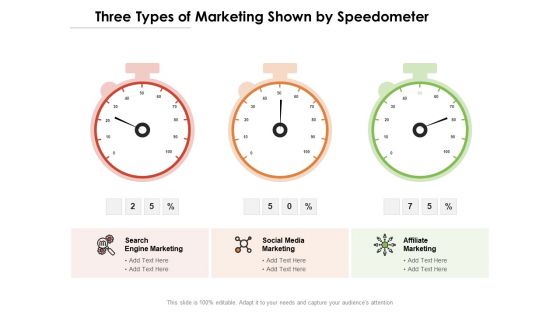
Three Types Of Marketing Shown By Speedometer Ppt PowerPoint Presentation Gallery Samples PDF
Presenting this set of slides with name three types of marketing shown by speedometer ppt powerpoint presentation gallery samples pdf. The topics discussed in these slides are search engine marketing, social media marketing, affiliate marketing. This is a completely editable PowerPoint presentation and is available for immediate download. Download now and impress your audience.

SLA KPL Dashboard Indicating Active Service Records Ppt Professional Graphics Example PDF
This graph or chart is linked to excel, and changes automatically based on data. Just left click on it and select Edit Data. Pitch your topic with ease and precision using this SLA KPL Dashboard Indicating Active Service Records Ppt Professional Graphics Example PDF. This layout presents information on Active Service Records, Highest Project Values, Highest Values. It is also available for immediate download and adjustment. So, changes can be made in the color, design, graphics or any other component to create a unique layout.
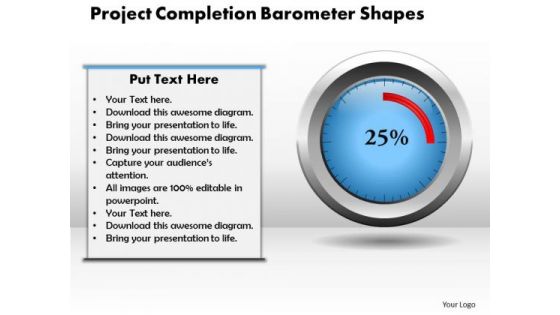
Project Completion Barometer PowerPoint Template
Draw On The Experience Of Our Project Completion Barometer PowerPoint Template Powerpoint Templates. They Imbibe From Past Masters. Drink The Nectar Of Our Business Charts Powerpoint Templates. Give Your Thoughts A Long Life.

Service Level Agreement KPI Dashboard Indicating Violation Count And Overdue Requests Diagrams PDF
This graph or chart is linked to excel, and changes automatically based on data. Just left click on it and select Edit Data. Showcasing this set of slides titled Service Level Agreement KPI Dashboard Indicating Violation Count And Overdue Requests Diagrams PDF. The topics addressed in these templates are Total Requests Category, Total Requests Status, Urgent Requests. All the content presented in this PPT design is completely editable. Download it and make adjustments in color, background, font etc. as per your unique business setting.

Finance Metrics Dashboard Indicating Account Receivable And Account Payable Demonstration PDF
This graph or chart is linked to excel, and changes automatically based on data. Just left click on it and select edit data. Showcasing this set of slides titled Finance Metrics Dashboard Indicating Account Receivable And Account Payable Demonstration PDF. The topics addressed in these templates are Total Accounts Receivable, Total Accounts Payable, Recommended Payment Timeline, Monthly Cash Flow. All the content presented in this PPT design is completely editable. Download it and make adjustments in color, background, font etc. as per your unique business setting.
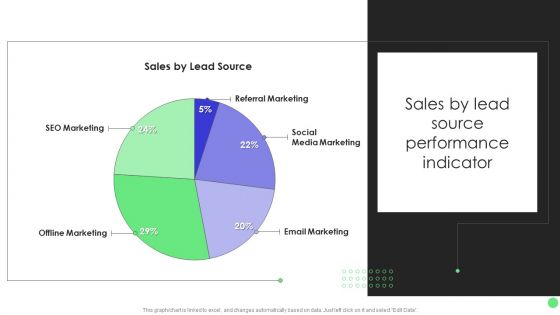
Comprehensive Guide For Launch Sales By Lead Source Performance Indicator Inspiration PDF
This graph or chart is linked to excel, and changes automatically based on data. Just left click on it and select Edit Data. The Comprehensive Guide For Launch Sales By Lead Source Performance Indicator Inspiration PDF is a compilation of the most recent design trends as a series of slides. It is suitable for any subject or industry presentation, containing attractive visuals and photo spots for businesses to clearly express their messages. This template contains a variety of slides for the user to input data, such as structures to contrast two elements, bullet points, and slides for written information. Slidegeeks is prepared to create an impression.

Company Financial Performance Indicators Dashboard With Liquidity And Turnover Ratios Formats PDF
This graph or chart is linked to excel, and changes automatically based on data. Just left click on it and select Edit Data. Pitch your topic with ease and precision using this Company Financial Performance Indicators Dashboard With Liquidity And Turnover Ratios Formats PDF. This layout presents information on Cash Balance, Days Inventory Outstanding, Days Payable Outstanding. It is also available for immediate download and adjustment. So, changes can be made in the color, design, graphics or any other component to create a unique layout.
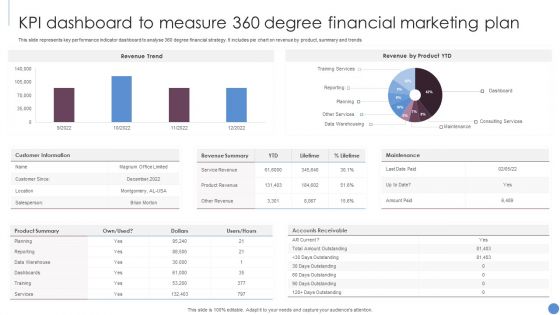
KPI Dashboard To Measure 360 Degree Financial Marketing Plan Slides PDF
This slide represents key performance indicator dashboard to analyse 360 degree financial strategy. It includes pie chart on revenue by product, summary and trends. Showcasing this set of slides titled KPI Dashboard To Measure 360 Degree Financial Marketing Plan Slides PDF. The topics addressed in these templates are Revenue Trend, Revenue Product YTD, Customer Information. All the content presented in this PPT design is completely editable. Download it and make adjustments in color, background, font etc. as per your unique business setting.
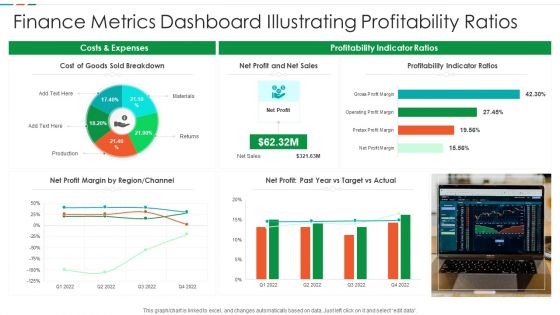
Finance Metrics Dashboard Illustrating Profitability Ratios Diagrams PDF
This graph or chart is linked to excel, and changes automatically based on data. Just left click on it and select edit data. Pitch your topic with ease and precision using this Finance Metrics Dashboard Illustrating Profitability Ratios Diagrams PDF. This layout presents information on Cost Goods Sold, Net Profit Net, Sales Profitability Indicator. It is also available for immediate download and adjustment. So, changes can be made in the color, design, graphics or any other component to create a unique layout.

Monitoring Calendar Performance Index KPI Dashboard Slides PDF
This slide depicts the SPI indicator dashboard for identifying problem areas at any level of the project. It also includes a section for project schedule, chart for earned and planned performance comparison, schedule performance index graph, progress summary table, milestones achieved, etc. Pitch your topic with ease and precision using this Monitoring Calendar Performance Index KPI Dashboard Slides PDF. This layout presents information on Current Budget, Planned Value, Earned Value. It is also available for immediate download and adjustment. So, changes can be made in the color, design, graphics or any other component to create a unique layout.

HR KPI Dashboard With Staff Payroll Details Ppt PowerPoint Presentation File Layout Ideas PDF
This slide represents the key performance indicator dashboard with salary details of employee working in an organisation. It includes turnover rate, pie chart of employment contract and status, bar graph based on employee gender. Showcasing this set of slides titled HR KPI Dashboard With Staff Payroll Details Ppt PowerPoint Presentation File Layout Ideas PDF. The topics addressed in these templates are Turnover Rate, Absenteeism Rate, Permanent Rate. All the content presented in this PPT design is completely editable. Download it and make adjustments in color, background, font etc. as per your unique business setting.
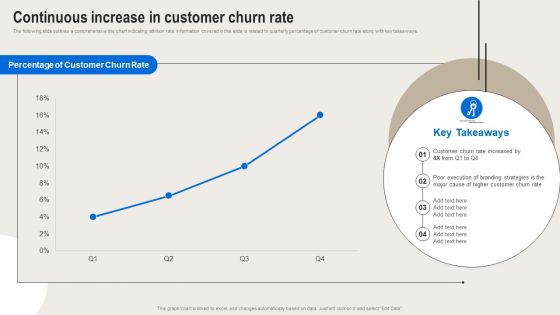
Formulating Branding Strategy To Enhance Revenue And Sales Continuous Increase In Customer Churn Rate Themes PDF
The following slide outlines a comprehensive line chart indicating attrition rate. Information covered in this slide is related to quarterly percentage of customer churn rate along with key takeaways. Boost your pitch with our creative Formulating Branding Strategy To Enhance Revenue And Sales Continuous Increase In Customer Churn Rate Themes PDF. Deliver an awe-inspiring pitch that will mesmerize everyone. Using these presentation templates you will surely catch everyones attention. You can browse the ppts collection on our website. We have researchers who are experts at creating the right content for the templates. So you do not have to invest time in any additional work. Just grab the template now and use them.
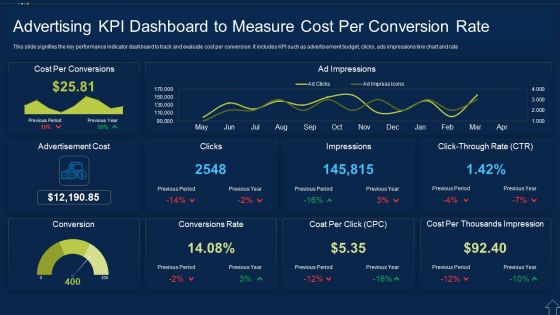
Advertising KPI Dashboard To Measure Cost Per Conversion Rate Themes PDF
This slide signifies the key performance indicator dashboard to track and evaluate cost per conversion. It includes KPI such as advertisement budget, clicks, ads impressions line chart and rate Showcasing this set of slides titled Advertising KPI Dashboard To Measure Cost Per Conversion Rate Themes PDF The topics addressed in these templates are Advertising Kpi Dashboard To Measure Cost Per Conversion Rate All the content presented in this PPT design is completely editable. Download it and make adjustments in color, background, font etc. as per your unique business setting.
Utilisation Of Funds Investor Pitch Deck For Food Startup Ppt Icon Graphics Tutorials PDF
Purpose of this slide is to provide information to the investors on how much money you have raised and spent. Here the pie chart indicates that company invested in marketing, technology. Deliver and pitch your topic in the best possible manner with this Utilisation Of Funds Investor Pitch Deck For Food Startup Ppt Icon Graphics Tutorials PDF. Use them to share invaluable insights on Utilisation Funds, Marketing and Promotion, Tech Expansion and impress your audience. This template can be altered and modified as per your expectations. So, grab it now.

Summary Financial Sales And Profit Margin Analysis Dashboard Pictures PDF
This graph or chart is linked to excel, and changes automatically based on data. Just left click on it and select Edit Data. Deliver an awe inspiring pitch with this creative Summary Financial Sales And Profit Margin Analysis Dashboard Pictures PDF bundle. Topics like Net Profit, Past Year Vs Target Vs Actual, Net Profit Margin By Region, Channel, Expenses Breakdown, Costs And Expenses, Profitability Indicator Ratios can be discussed with this completely editable template. It is available for immediate download depending on the needs and requirements of the user.
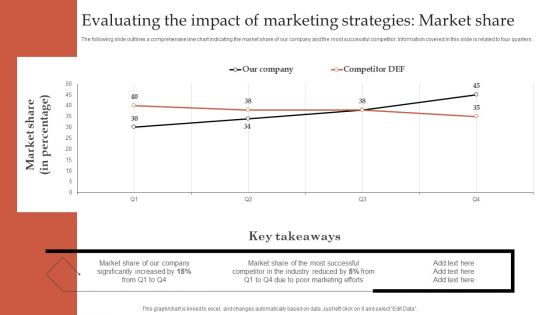
Formulating Robust Branding Strategies To Effectively Combat Evaluating The Impact Of Market Share Sample PDF
The following slide outlines a comprehensive line chart indicating the market share of our company and the most successful competitor. Information covered in this slide is related to four quarters. Boost your pitch with our creative Formulating Robust Branding Strategies To Effectively Combat Evaluating The Impact Of Market Share Sample PDF. Deliver an awe-inspiring pitch that will mesmerize everyone. Using these presentation templates you will surely catch everyones attention. You can browse the ppts collection on our website. We have researchers who are experts at creating the right content for the templates. So you do not have to invest time in any additional work. Just grab the template now and use them.
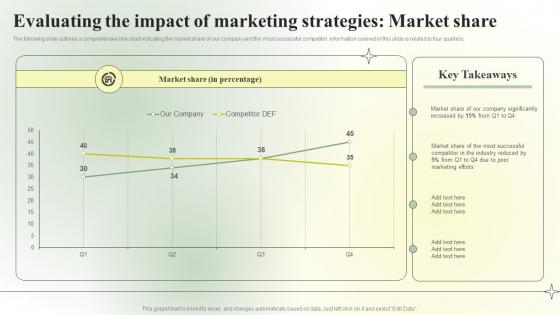
Competitive Branding Strategic Evaluating The Impact Of Marketing Infographics PDF
The following slide outlines a comprehensive line chart indicating the market share of our company and the most successful competitor. Information covered in this slide is related to four quarters. From laying roadmaps to briefing everything in detail, our templates are perfect for you. You can set the stage with your presentation slides. All you have to do is download these easy-to-edit and customizable templates. Competitive Branding Strategic Evaluating The Impact Of Marketing Infographics PDF will help you deliver an outstanding performance that everyone would remember and praise you for. Do download this presentation today.

Determining The Major Issues Caused By Covid19 And Its Impact On Food Industry Demonstration PDF
Mentioned slide shows informational stats about the major issues caused by the coronavirus and their impact on food industry. Here the pie chart indicates that about 52 percentage of the food companies said that coronavirus had a dramatic impact on their operations. Deliver and pitch your topic in the best possible manner with this determining the major issues caused by covid19 and its impact on food industry demonstration pdf. Use them to share invaluable insights on communication, industry, dramatic and impress your audience. This template can be altered and modified as per your expectations. So, grab it now.
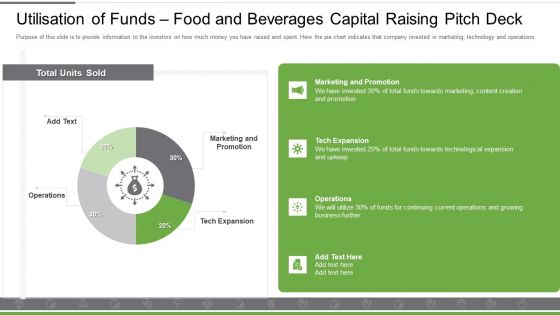
Utilisation Of Funds Food And Beverages Capital Raising Pitch Deck Portrait PDF
Purpose of this slide is to provide information to the investors on how much money you have raised and spent. Here the pie chart indicates that company invested in marketing, technology and operations. Deliver an awe inspiring pitch with this creative utilisation of funds food and beverages capital raising pitch deck portrait pdf bundle. Topics like marketing and promotion, tech expansion, operations can be discussed with this completely editable template. It is available for immediate download depending on the needs and requirements of the user.
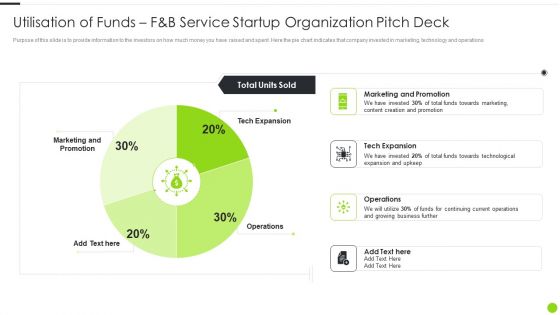
Utilisation Of Funds F And B Service Startup Organization Pitch Deck Structure PDF
Purpose of this slide is to provide information to the investors on how much money you have raised and spent. Here the pie chart indicates that company invested in marketing, technology and operations. Deliver and pitch your topic in the best possible manner with this utilisation of funds f and b service startup organization pitch deck structure pdf. Use them to share invaluable insights on marketing, tech expansion, operations and impress your audience. This template can be altered and modified as per your expectations. So, grab it now.
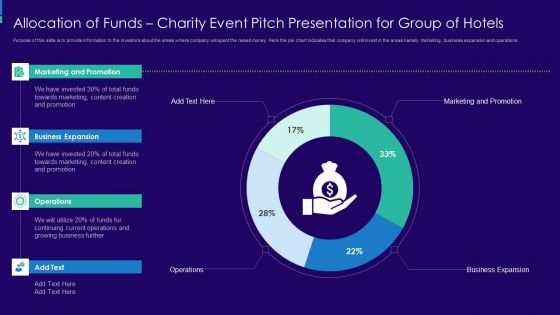
Charity Event Pitch Presentation For Group Of Hotels Allocation Of Funds Charity Download PDF
Purpose of this slide is to provide information to the investors about the areas where company will spent the raised money. Here the pie chart indicates that company will invest in the areas namely marketing, business expansion and operations. Deliver an awe inspiring pitch with this creative charity event pitch presentation for group of hotels allocation of funds charity download pdf bundle. Topics like marketing and promotion, business expansion, operations can be discussed with this completely editable template. It is available for immediate download depending on the needs and requirements of the user.
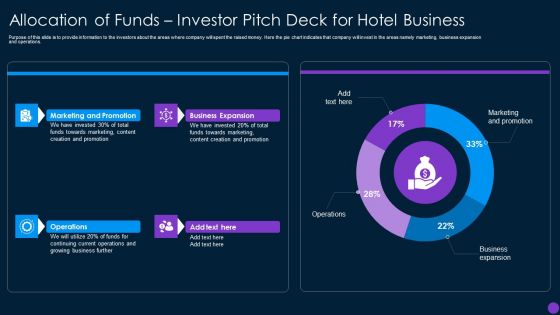
Allocation Of Funds Investor Pitch Deck For Hotel Business Graphics PDF
Purpose of this slide is to provide information to the investors about the areas where company will spent the raised money. Here the pie chart indicates that company will invest in the areas namely marketing, business expansion Deliver an awe inspiring pitch with this creative Allocation Of Funds Investor Pitch Deck For Hotel Business Graphics PDF bundle. Topics like Marketing And Promotion, Operations, Business Expansion can be discussed with this completely editable template. It is available for immediate download depending on the needs and requirements of the user.

Utilisation Of Funds Restaurant Startup Pitch Deck Ideas PDF
Purpose of this slide is to provide information to the investors on how much money you have raised and spent. Here the pie chart indicates that company invested in marketing, technology and operations. Deliver and pitch your topic in the best possible manner with this Utilisation Of Funds Restaurant Startup Pitch Deck Ideas PDF. Use them to share invaluable insights on Marketing And Promotion, Tech Expansion, Operations and impress your audience. This template can be altered and modified as per your expectations. So, grab it now.
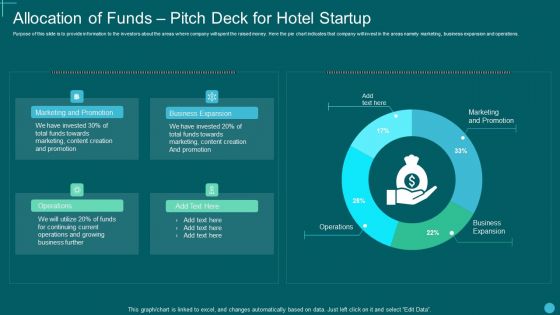
Allocation Of Funds Pitch Deck For Hotel Startup Slides PDF
Purpose of this slide is to provide information to the investors about the areas where company will spent the raised money. Here the pie chart indicates that company will invest in the areas namely marketing, business expansion and operations. Deliver an awe inspiring pitch with this creative Allocation Of Funds Pitch Deck For Hotel Startup Slides PDF bundle. Topics like Marketing Promotion, Business Expansion, Operations can be discussed with this completely editable template. It is available for immediate download depending on the needs and requirements of the user.
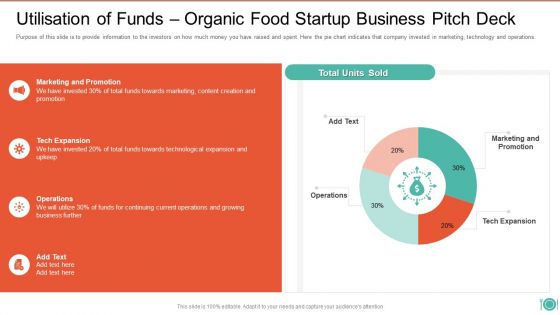
Utilisation Of Funds Organic Food Startup Business Pitch Deck Download PDF
Purpose of this slide is to provide information to the investors on how much money you have raised and spent. Here the pie chart indicates that company invested in marketing, technology and operations. Deliver an awe inspiring pitch with this creative Utilisation Of Funds Organic Food Startup Business Pitch Deck Download PDF bundle. Topics like Marketing And Promotion, Funds Towards Marketing, Towards Technological Expansion can be discussed with this completely editable template. It is available for immediate download depending on the needs and requirements of the user.
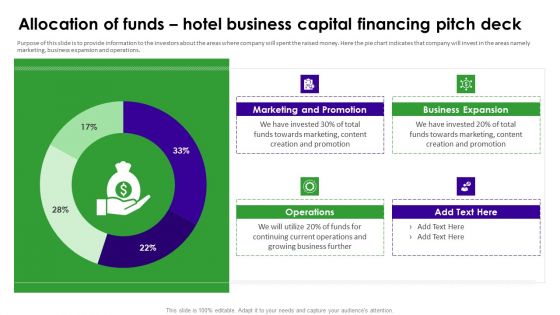
Allocation Of Funds Hotel Business Capital Financing Pitch Deck Information PDF
Purpose of this slide is to provide information to the investors about the areas where company will spent the raised money. Here the pie chart indicates that company will invest in the areas namely marketing, business expansion and operations. Deliver an awe inspiring pitch with this creative Allocation Of Funds Hotel Business Capital Financing Pitch Deck Information PDF bundle. Topics like Marketing And Promotion, Business Expansion, Operations can be discussed with this completely editable template. It is available for immediate download depending on the needs and requirements of the user.
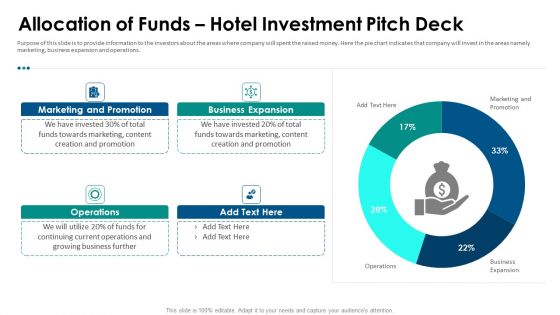
Hospitality Fundraising Allocation Of Funds Hotel Investment Pitch Deck Inspiration PDF
Purpose of this slide is to provide information to the investors about the areas where company will spent the raised money. Here the pie chart indicates that company will invest in the areas namely marketing, business expansion and operations. Deliver an awe inspiring pitch with this creative hospitality fundraising allocation of funds hotel investment pitch deck inspiration pdf bundle. Topics like business expansion, marketing, funds can be discussed with this completely editable template. It is available for immediate download depending on the needs and requirements of the user.

Project Leader Task Assessment Sheet Ppt PowerPoint Presentation Gallery Outline PDF
This slide represents project stakeholder chart which indicates contribution of stakeholders of all 4 activities. It is essential to analyze stakeholders commitment and dedication for the project. Pitch your topic with ease and precision using this project leader task assessment sheet ppt powerpoint presentation gallery outline pdf. This layout presents information on project leader task assessment sheet. It is also available for immediate download and adjustment. So, changes can be made in the color, design, graphics or any other component to create a unique layout.
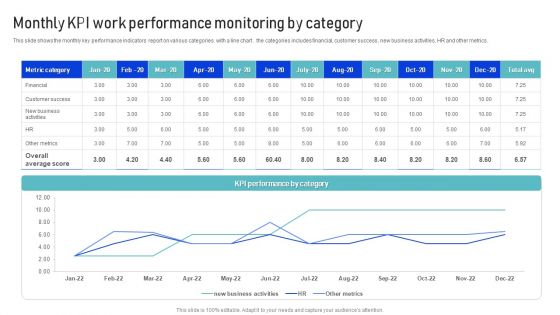
Monthly KPI Work Performance Monitoring By Category Microsoft PDF
This slide shows the monthly key performance indicators report on various categories with a line chart . the categories includes financial, customer success , new business activities, HR and other metrics. Pitch your topic with ease and precision using this Monthly KPI Work Performance Monitoring By Category Microsoft PDF. This layout presents information on Metrics, Financial, Customer Success. It is also available for immediate download and adjustment. So, changes can be made in the color, design, graphics or any other component to create a unique layout.

Business Projects Dashboard Template With Risk Status Report Template Topics PDF
The slide showcases a multi-project status report of a construction company. It highlights the project financials, resource allocation, portfolio risk meter and other key project parameters. Pitch your topic with ease and precision using this Business Projects Dashboard Template With Risk Status Report Template Topics PDF. This layout presents information on Portfolio Risk Meter, Project Financials, Project Parameters, Resource Allocation. It is also available for immediate download and adjustment. So, changes can be made in the color, design, graphics or any other component to create a unique layout.
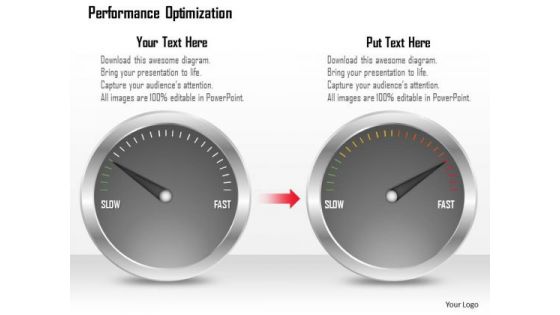
Business Framework Performance Optimization PowerPoint Presentation
Explain the concept of performance optimization with this exclusive template slide. This PPT diagram slide contains the graphic of two meters with maximum ratings. Use this PPT diagram slide and build exclusive presentation for your viewers.

Framework Administration Infrastructure KPI Dashboard Showing Project Revenue Background PDF
Deliver an awe-inspiring pitch with this creative framework administration infrastructure kpi dashboard showing project revenue background pdf bundle. Topics like net project revenue per employee, dollars per employee, square meter price can be discussed with this completely editable template. It is available for immediate download depending on the needs and requirements of the user.
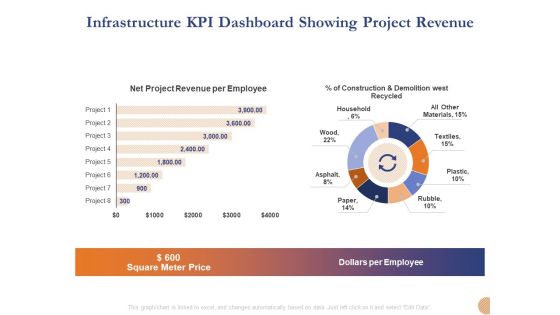
Substructure Segment Analysis Infrastructure KPI Dashboard Showing Project Revenue Summary PDF
Deliver and pitch your topic in the best possible manner with this substructure segment analysis infrastructure kpi dashboard showing project revenue summary pdf. Use them to share invaluable insights on square meter price, dollars per employee, net project revenue per employee and impress your audience. This template can be altered and modified as per your expectations. So, grab it now.

Information Technology Functions Management Infrastructure KPI Dashboard Showing Project Revenue Ppt Show Information PDF
Deliver an awe-inspiring pitch with this creative information technology functions management infrastructure kpi dashboard showing project revenue ppt show information pdf bundle. Topics like net project revenue per employee, construction and demolition west recycled, dollars million, square meter price, project can be discussed with this completely editable template. It is available for immediate download depending on the needs and requirements of the user.

Utilizing Infrastructure Management Using Latest Methods Infrastructure KPI Dashboard Showing Project Revenue Background PDF
Deliver an awe-inspiring pitch with this creative utilizing infrastructure management using latest methods infrastructure kpi dashboard showing project revenue background pdf bundle. Topics like net project revenue per employee, construction and demolition west recycled, dollars million, square meter price, project can be discussed with this completely editable template. It is available for immediate download depending on the needs and requirements of the user.
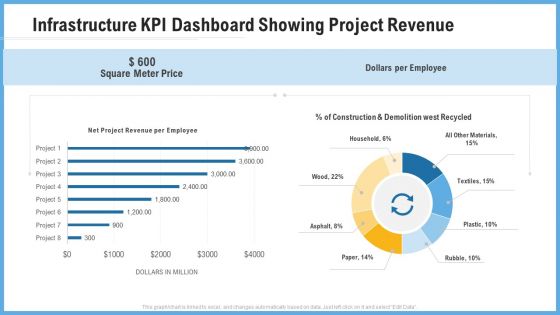
Improving Operational Activities Enterprise Infrastructure Kpi Dashboard Showing Project Revenue Professional PDF
Deliver an awe inspiring pitch with this creative improving operational activities enterprise infrastructure kpi dashboard showing project revenue professional pdf bundle. Topics like square meter price, dollars per employee can be discussed with this completely editable template. It is available for immediate download depending on the needs and requirements of the user.
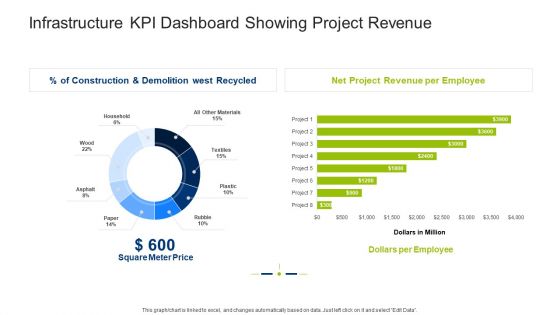
Infrastructure Building Administration Infrastructure KPI Dashboard Showing Project Revenue Clipart PDF
Deliver an awe inspiring pitch with this creative infrastructure building administration infrastructure kpi dashboard showing project revenue clipart pdf bundle. Topics like square meter price, net project revenue per employee, dollars per employee can be discussed with this completely editable template. It is available for immediate download depending on the needs and requirements of the user.
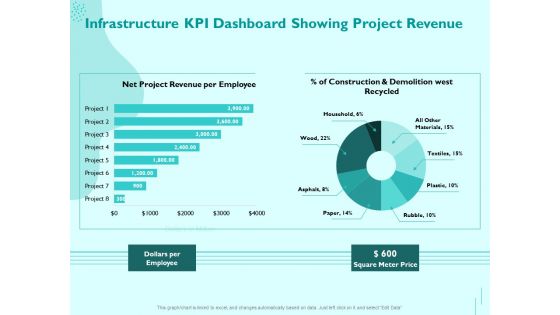
Managing IT Operating System Infrastructure KPI Dashboard Showing Project Revenue Diagrams PDF
Presenting this set of slides with name managing it operating system infrastructure kpi dashboard showing project revenue diagrams pdf. The topics discussed in these slides are dollars per employee, square meter price. This is a completely editable PowerPoint presentation and is available for immediate download. Download now and impress your audience.

 Home
Home