Financial Performance Dashboard
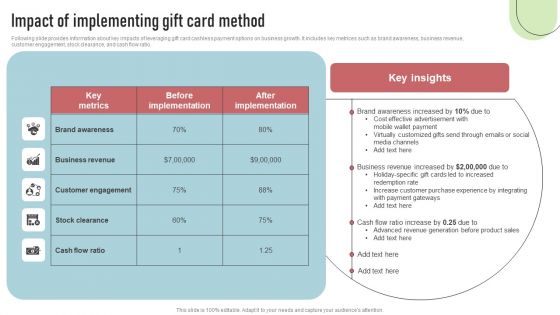
Cashless Payment Strategies To Enhance Business Performance Impact Of Implementing Gift Card Method Guidelines PDF
Following slide provides information about key impacts of leveraging gift card cashless payment options on business growth. It includes key metrices such as brand awareness, business revenue, customer engagement, stock clearance, and cash flow ratio. This Cashless Payment Strategies To Enhance Business Performance Impact Of Implementing Gift Card Method Guidelines PDF is perfect for any presentation, be it in front of clients or colleagues. It is a versatile and stylish solution for organizing your meetings. The Cashless Payment Strategies To Enhance Business Performance Impact Of Implementing Gift Card Method Guidelines PDF features a modern design for your presentation meetings. The adjustable and customizable slides provide unlimited possibilities for acing up your presentation. Slidegeeks has done all the homework before launching the product for you. So, do not wait, grab the presentation templates today
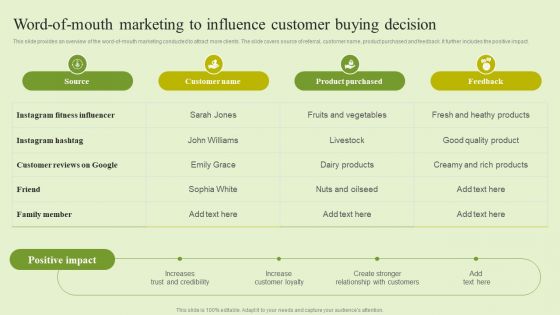
Agriculture Marketing Strategy To Improve Revenue Performance Word Of Mouth Marketing To Influence Customer Infographics PDF
This slide provides an overview of the word-of-mouth marketing conducted to attract more clients. The slide covers source of referral, customer name, product purchased and feedback. It further includes the positive impact. The Agriculture Marketing Strategy To Improve Revenue Performance Word Of Mouth Marketing To Influence Customer Infographics PDF is a compilation of the most recent design trends as a series of slides. It is suitable for any subject or industry presentation, containing attractive visuals and photo spots for businesses to clearly express their messages. This template contains a variety of slides for the user to input data, such as structures to contrast two elements, bullet points, and slides for written information. Slidegeeks is prepared to create an impression.

Yearly Product Performance Assessment Repor Key Metrics For Understanding Product Formats PDF
The following slide displays key metrics that can be used to understand the product, these metrics can be Revenues Generated by the product, the total units sold of the product and the total purchase value of the product.Presenting Yearly Product Performance Assessment Repor Key Metrics For Understanding Product Formats PDF to provide visual cues and insights. Share and navigate important information on three stages that need your due attention. This template can be used to pitch topics like Revenues Generated, Purchase Value, Generated Product In addtion, this PPT design contains high resolution images, graphics, etc, that are easily editable and available for immediate download.
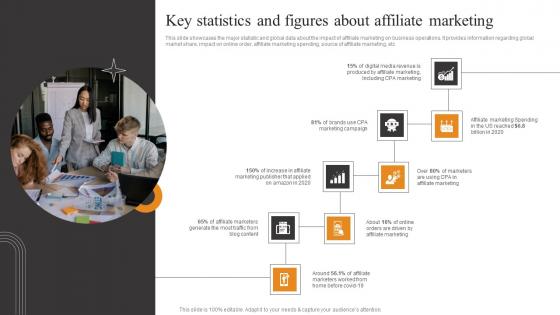
Key Statistics And Figures About Tactics To Optimize Corporate Performance Structure Pdf
This slide showcases the major statistic and global data about the impact of affiliate marketing on business operations. It provides information regarding global market share, impact on online order, affiliate marketing spending, source of affiliate marketing, etc Make sure to capture your audiences attention in your business displays with our gratis customizable Key Statistics And Figures About Tactics To Optimize Corporate Performance Structure Pdf. These are great for business strategies, office conferences, capital raising or task suggestions. If you desire to acquire more customers for your tech business and ensure they stay satisfied, create your own sales presentation with these plain slides.
Business Performance Review Report Highlighting Results Of Marketing Campaign Icons PDF
The following slide highlights a quarterly business review QBR report which can be used by the manager to review marketing campaign results. The QBR report covers information about strategic objectives, KPIs, target and result in various quarters. Pitch your topic with ease and precision using this Business Performance Review Report Highlighting Results Of Marketing Campaign Icons PDF. This layout presents information on Strategic Objectives, Engage Community, Increase Revenue. It is also available for immediate download and adjustment. So, changes can be made in the color, design, graphics or any other component to create a unique layout.
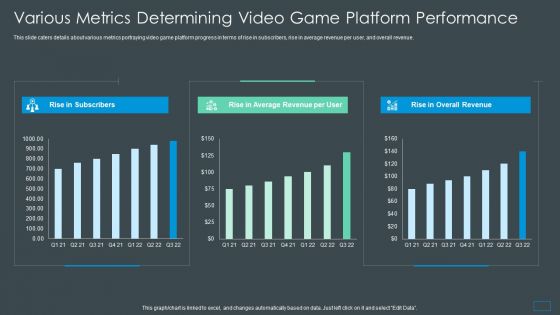
Multiplayer Gameplay System Venture Capitalist PPT Various Metrics Determining Video Game Platform Performance Infographics PDF
This slide caters details about various metrics portraying video game platform progress in terms of rise in subscribers, rise in average revenue per user, and overall revenue.Deliver an awe inspiring pitch with this creative multiplayer gameplay system venture capitalist ppt various metrics determining video game platform performance infographics pdf bundle. Topics like rise in subscribers, rise in average revenue, rise in overall revenue can be discussed with this completely editable template. It is available for immediate download depending on the needs and requirements of the user.
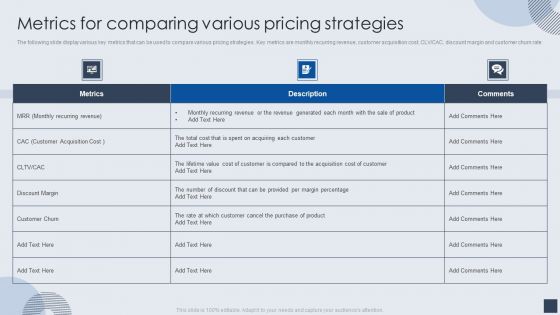
Implementing Marketing Mix Strategy To Enhance Overall Performance Metrics For Comparing Various Pricing Strategies Slides PDF
The following slide display various key metrics that can be used to compare various pricing strategies . Key metrics are monthly recurring revenue, customer acquisition cost, CLV or CAC, discount margin and customer churn rate. Deliver and pitch your topic in the best possible manner with this Implementing Marketing Mix Strategy To Enhance Overall Performance Metrics For Comparing Various Pricing Strategies Slides PDF. Use them to share invaluable insights on Metrics, Customer, Purchase Of Product and impress your audience. This template can be altered and modified as per your expectations. So, grab it now.
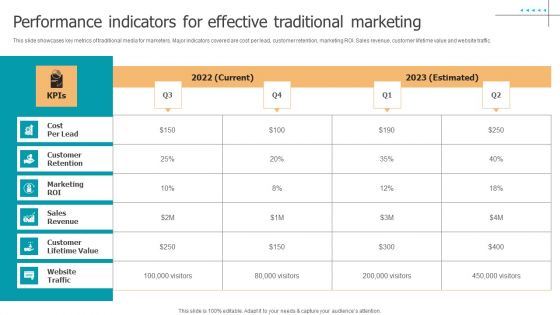
Techniques To Implement Performance Indicators For Effective Traditional Marketing Slides PDF
This slide showcases key metrics of traditional media for marketers. Major indicators covered are cost per lead, customer retention, marketing ROI. Sales revenue, customer lifetime value and website traffic. Are you in need of a template that can accommodate all of your creative concepts This one is crafted professionally and can be altered to fit any style. Use it with Google Slides or PowerPoint. Include striking photographs, symbols, depictions, and other visuals. Fill, move around, or remove text boxes as desired. Test out color palettes and font mixtures. Edit and save your work, or work with colleagues. Download Techniques To Implement Performance Indicators For Effective Traditional Marketing Slides PDF and observe how to make your presentation outstanding. Give an impeccable presentation to your group and make your presentation unforgettable.
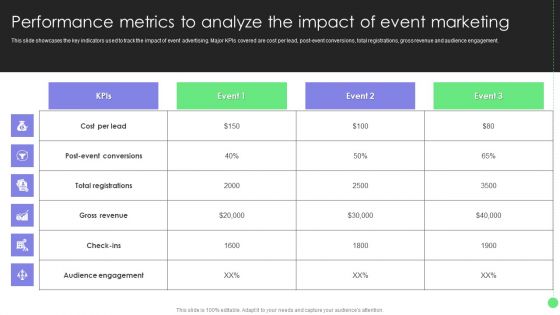
Comprehensive Guide For Launch Performance Metrics To Analyze The Impact Of Event Diagrams PDF
This slide showcases the key indicators used to track the impact of event advertising. Major KPIs covered are cost per lead, post-event conversions, total registrations, gross revenue and audience engagement. Welcome to our selection of the Comprehensive Guide For Launch Performance Metrics To Analyze The Impact Of Event Diagrams PDF. These are designed to help you showcase your creativity and bring your sphere to life. Planning and Innovation are essential for any business that is just starting out. This collection contains the designs that you need for your everyday presentations. All of our PowerPoints are 100 percent editable, so you can customize them to suit your needs. This multi-purpose template can be used in various situations. Grab these presentation templates today.
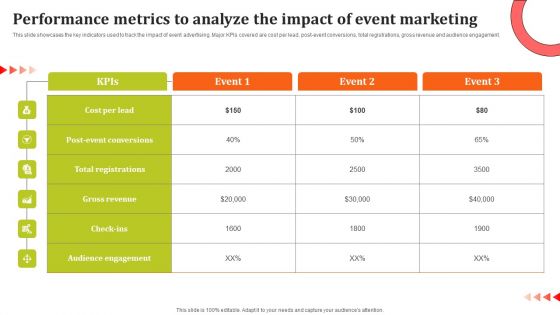
Performance Metrics To Analyze The Impact Of Event Marketing Ppt Model Layouts PDF
This slide showcases the key indicators used to track the impact of event advertising. Major KPIs covered are cost per lead, post-event conversions, total registrations, gross revenue and audience engagement. This modern and well arranged Performance Metrics To Analyze The Impact Of Event Marketing Ppt Model Layouts PDF provides lots of creative possibilities. It is very simple to customize and edit with the Powerpoint Software. Just drag and drop your pictures into the shapes. All facets of this template can be edited with Powerpoint no extra software is necessary. Add your own material, put your images in the places assigned for them, adjust the colors, and then you can show your slides to the world, with an animated slide included.
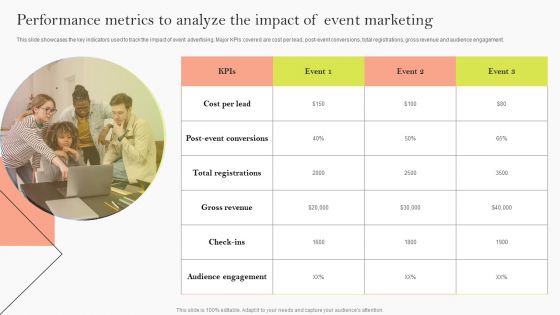
Performance Metrics To Analyze The Impact Of Event Marketing Ppt Model Good PDF
This slide showcases the key indicators used to track the impact of event advertising. Major KPIs covered are cost per lead, post-event conversions, total registrations, gross revenue and audience engagement. This modern and well arranged Performance Metrics To Analyze The Impact Of Event Marketing Ppt Model Good PDF provides lots of creative possibilities. It is very simple to customize and edit with the Powerpoint Software. Just drag and drop your pictures into the shapes. All facets of this template can be edited with Powerpoint no extra software is necessary. Add your own material, put your images in the places assigned for them, adjust the colors, and then you can show your slides to the world, with an animated slide included.
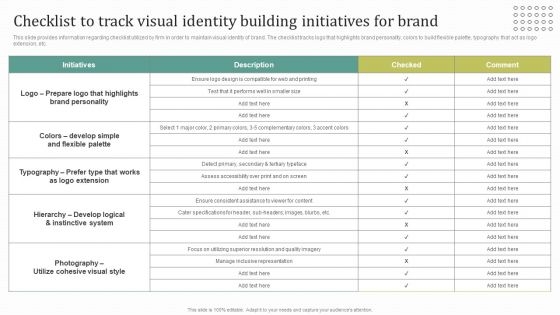
Instructions For Brand Performance Management Team Checklist To Track Visual Identity Building Infographics PDF
This slide provides information regarding checklist utilized by firm in order to maintain visual identity of brand. The checklist tracks logo that highlights brand personality, colors to build flexible palette, typography that act as logo extension, etc. Make sure to capture your audiences attention in your business displays with our gratis customizable Instructions For Brand Performance Management Team Checklist To Track Visual Identity Building Infographics PDF. These are great for business strategies, office conferences, capital raising or task suggestions. If you desire to acquire more customers for your tech business and ensure they stay satisfied, create your own sales presentation with these plain slides.

Cashless Payment Strategies To Enhance Business Performance Impact Of Accepting Cryptocurrency Payments Background PDF
Mentioned slide showcases statistics associates with impact of cryptocurrency implementation in business. It includes key metrics such as transaction cost, merchant protection, customer convenience and business sales. Make sure to capture your audiences attention in your business displays with our gratis customizable Cashless Payment Strategies To Enhance Business Performance Impact Of Accepting Cryptocurrency Payments Background PDF. These are great for business strategies, office conferences, capital raising or task suggestions. If you desire to acquire more customers for your tech business and ensure they stay satisfied, create your own sales presentation with these plain slides.

Employee Performance Management To Enhance Organizational Growth Gap Analysis Showcasing Need Of Employee Professional PDF
This slide covers gap analysis to analyze need of employee productivity improvement program in organization . It involves KPIs such as customer satisfaction, turnover rate, revenue per employee and project completion rate. Make sure to capture your audiences attention in your business displays with our gratis customizable Employee Performance Management To Enhance Organizational Growth Gap Analysis Showcasing Need Of Employee Professional PDF. These are great for business strategies, office conferences, capital raising or task suggestions. If you desire to acquire more customers for your tech business and ensure they stay satisfied, create your own sales presentation with these plain slides.

Implementing Marketing Mix Strategy To Enhance Overall Performance Analyzing Multiple Distribution Channels Brochure PDF
The following slide helps the organization in analyzing multiple distribution channels with the help of key metrics. The highlighted metrics help in analyzing and comparing these channels, these parameters are average number of order, time to market and average revenue generated etc. Deliver and pitch your topic in the best possible manner with this Implementing Marketing Mix Strategy To Enhance Overall Performance Analyzing Multiple Distribution Channels Brochure PDF. Use them to share invaluable insights on Analyzing Multiple, Distribution Channels and impress your audience. This template can be altered and modified as per your expectations. So, grab it now.
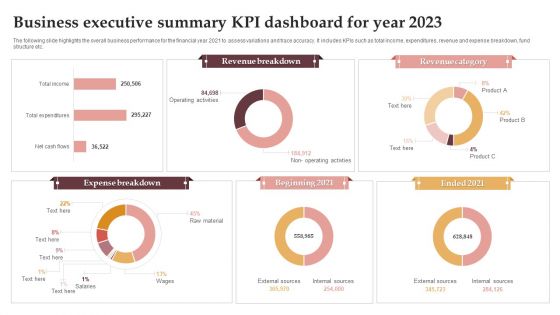
Business Executive Summary KPI Dashboard For Year 2023 Graphics PDF
The following slide highlights the overall business performance for the financial year 2021 to assess variations and trace accuracy. It includes KPIs such as total income, expenditures, revenue and expense breakdown, fund structure etc. Pitch your topic with ease and precision using this Business Executive Summary KPI Dashboard For Year 2023 Graphics PDF. This layout presents information on Revenue Breakdown, Revenue Category, Expense Breakdown. It is also available for immediate download and adjustment. So, changes can be made in the color, design, graphics or any other component to create a unique layout.

Content And Permission Marketing Tactics For Enhancing Business Revenues Keyword Performance Scorecard For SEO Themes PDF
The following slide displays key metrics of measuring the success of keyword. These metrics can be clicks, average CPC, CTR, Cost, Average position, conversion and conversation rate etc. Slidegeeks has constructed Content And Permission Marketing Tactics For Enhancing Business Revenues Keyword Performance Scorecard For SEO Themes PDF after conducting extensive research and examination. These presentation templates are constantly being generated and modified based on user preferences and critiques from editors. Here, you will find the most attractive templates for a range of purposes while taking into account ratings and remarks from users regarding the content. This is an excellent jumping-off point to explore our content and will give new users an insight into our top-notch PowerPoint Templates.

Nestle Performance Management Report Ppt PowerPoint Presentation Complete Deck With Slides
This Nestle Performance Management Report Ppt PowerPoint Presentation Complete Deck With Slides is a primer on how to capitalize on business opportunities through planning, innovation, and market intelligence. The content-ready format of the complete deck will make your job as a decision-maker a lot easier. Use this ready-made PowerPoint Template to help you outline an extensive and legible plan to capture markets and grow your company on the right path, at an exponential pace. What is even more amazing is that this presentation is completely editable and 100 percent customizable. This sixty one slide complete deck helps you impress a roomful of people with your expertise in business and even presentation. Craft such a professional and appealing presentation for that amazing recall value. Download now.
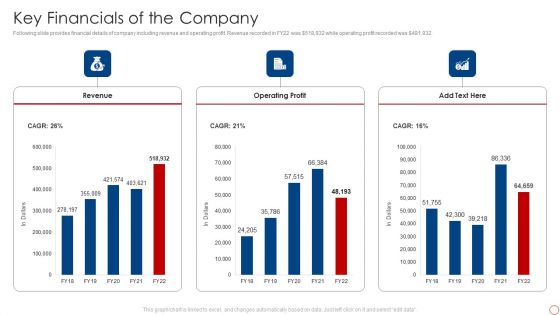
Kpis For Evaluating Business Sustainability Key Financials Of The Company Rules PDF
Following slide provides financial details of company including revenue and operating profit. Revenue recorded in FY22 was dollar 518,932 while operating profit recorded was dollar 481,932. Deliver and pitch your topic in the best possible manner with this Kpis For Evaluating Business Sustainability Financial Performance Indicator Dashboard Demonstration PDF. Use them to share invaluable insights on Revenue, Operating Profit and impress your audience. This template can be altered and modified as per your expectations. So, grab it now.

Call Center Metrics And Metrics Dashboard With Tickets Raised Graphics PDF
Mentioned slide outlines a KPI dashboard showcasing the call center performance. The metrics covered in the slide are total dropped calls, waiting calls, total calls, team performance, recurring calls, tickets raised. Showcasing this set of slides titled Call Center Metrics And Metrics Dashboard With Tickets Raised Graphics PDF. The topics addressed in these templates are Call Management Data, Monthly Statics, Performance Records. All the content presented in this PPT design is completely editable. Download it and make adjustments in color, background, font etc. as per your unique business setting.

Reverse SCM Reverse Logistics Dashboard Past Ppt Slides Layouts PDF
Deliver an awe-inspiring pitch with this creative reverse scm reverse logistics dashboard past ppt slides layouts pdf bundle. Topics like financial performance, inventory, customer can be discussed with this completely editable template. It is available for immediate download depending on the needs and requirements of the user.
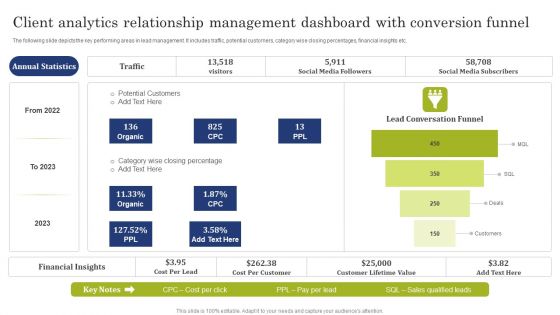
Client Analytics Relationship Management Dashboard With Conversion Funnel Demonstration PDF
The following slide depicts the key performing areas in lead management. It includes traffic, potential customers, category wise closing percentages, financial insights etc. Pitch your topic with ease and precision using this Client Analytics Relationship Management Dashboard With Conversion Funnel Demonstration PDF. This layout presents information on Potential Customers, Social Media Followers, Social Media Subscribers. It is also available for immediate download and adjustment. So, changes can be made in the color, design, graphics or any other component to create a unique layout.
Plan Dashboard For Tracking Location Wise Revenue Diagrams PDF
This slide presents a dashboard which will assist managers to track the revenue of each branch having geographical presence in different corners of the world. The key performance indicators are total revenue, location wise rent, branch performance among many others.Pitch your topic with ease and precision using this Plan Dashboard For Tracking Location Wise Revenue Diagrams PDF. This layout presents information on Taxes Paid, Current Month, Branch Performance, Previous Quarter. It is also available for immediate download and adjustment. So, changes can be made in the color, design, graphics or any other component to create a unique layout.
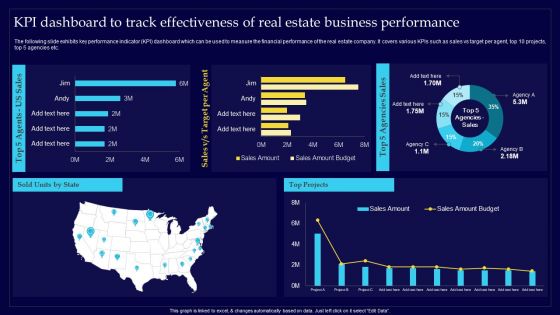
Executing Risk Mitigation KPI Dashboard To Track Effectiveness Of Real Estate Rules PDF
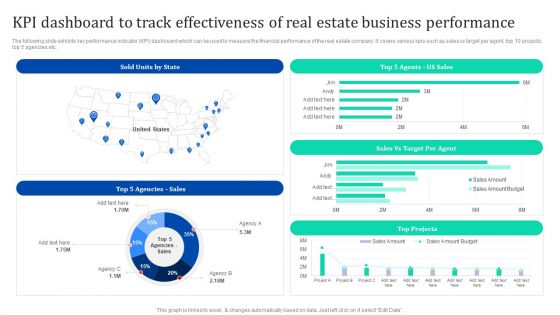
KPI Dashboard To Track Effectiveness Of Real Estate Business Enhancing Process Improvement By Regularly Themes PDF
The following slide exhibits key performance indicator KPI dashboard which can be used to measure the financial performance of the real estate company. It covers various kpis such as sales vs target per agent, top 10 projects, top 5 agencies etc. Welcome to our selection of the KPI Dashboard To Track Effectiveness Of Real Estate Business Enhancing Process Improvement By Regularly Themes PDF. These are designed to help you showcase your creativity and bring your sphere to life. Planning and Innovation are essential for any business that is just starting out. This collection contains the designs that you need for your everyday presentations. All of our PowerPoints are 100 parcent editable, so you can customize them to suit your needs. This multi-purpose template can be used in various situations. Grab these presentation templates today.

Dashboard Related To Logistic Company Date Introduction PDF
This slide shows the dashboard related to the ABC logistic company which includes order status, global financial performance, volume, inventory details, etc. Deliver and pitch your topic in the best possible manner with this dashboard related to logistic company date introduction pdf. Use them to share invaluable insights on dashboard related to logistic company and impress your audience. This template can be altered and modified as per your expectations. So, grab it now.

Income Management Tool Price Optimization Dashboard Customers Inspiration PDF
This slide covers the details of price optimization which focuses on number of visitors, customers, revenues, performance by devices, etc. Deliver and pitch your topic in the best possible manner with this income management tool price optimization dashboard customers inspiration pdf. Use them to share invaluable insights on visitors, customers, revenue, performance by device and impress your audience. This template can be altered and modified as per your expectations. So, grab it now.
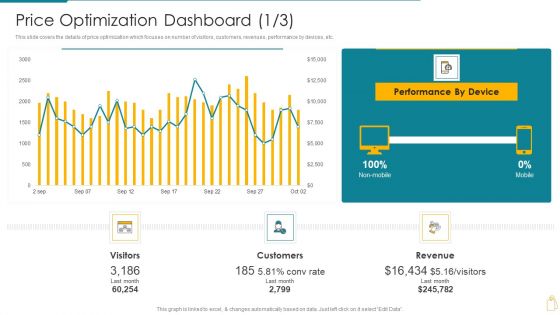
Price Optimization Dashboard Cost And Income Optimization Guidelines PDF
This slide covers the details of price optimization which focuses on number of visitors, customers, revenues, performance by devices, etc. Deliver an awe inspiring pitch with this creative Price Optimization Dashboard Cost And Income Optimization Guidelines PDF bundle. Topics like visitors, customers, revenue, performance device can be discussed with this completely editable template. It is available for immediate download depending on the needs and requirements of the user.
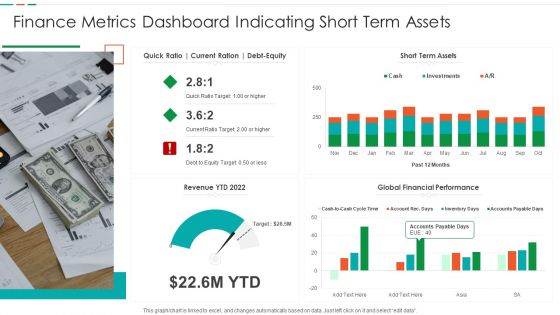
Finance Metrics Dashboard Indicating Short Term Assets Download PDF
This graph or chart is linked to excel, and changes automatically based on data. Just left click on it and select edit data. Pitch your topic with ease and precision using this Finance Metrics Dashboard Indicating Short Term Assets Download PDF. This layout presents information on Short Term Assets, Global Financial Performance, Revenue YTD 2022. It is also available for immediate download and adjustment. So, changes can be made in the color, design, graphics or any other component to create a unique layout.

Inventory Stock Control Warehouse Management Dashboard Ppt Styles Images PDF
The slide demonstrates information regarding the warehouse management dashboard in order to track key activities. Deliver and pitch your topic in the best possible manner with this inventory stock control warehouse management dashboard ppt styles images pdf. Use them to share invaluable insights on kpls monthly, orders, inventory, global financial performances, volume today and impress your audience. This template can be altered and modified as per your expectations. So, grab it now.

Dashboard To Track Ecommerce Website Revenue And Traffic Rules PDF
This slide showcases dashboard that can help organization to track the traffic and revenue of ecommerce website. Its key elements are ecommerce conversion rate, average order value, performance by traffic source, top product, performance by device category. There are so many reasons you need a Dashboard To Track Ecommerce Website Revenue And Traffic Rules PDF. The first reason is you can not spend time making everything from scratch, Thus, Slidegeeks has made presentation templates for you too. You can easily download these templates from our website easily.
Project Metrics Dashboard With Revenues And Expenses Icons PDF
This slide shows the project management dashboard which covers the name, priorities, indicators and status which includes strategic priorities, research and development, administration, performance management, etc. With purchases in last 30 days and tasks. Showcasing this set of slides titled Project Metrics Dashboard With Revenues And Expenses Icons PDF. The topics addressed in these templates are Performance Management, Research And Development, Strategic Priorities. All the content presented in this PPT design is completely editable. Download it and make adjustments in color, background, font etc. as per your unique business setting.

Sales And Revenue Assessment Kpi Dashboard Brochure PDF
Following slide exhibits dashboard that determine impact of environmental assessment on business performance. It includes indicators such as average operative cost, product model performance etc. If your project calls for a presentation, then Slidegeeks is your go-to partner because we have professionally designed, easy-to-edit templates that are perfect for any presentation. After downloading, you can easily edit Sales And Revenue Assessment Kpi Dashboard Brochure PDF and make the changes accordingly. You can rearrange slides or fill them with different images. Check out all the handy templates
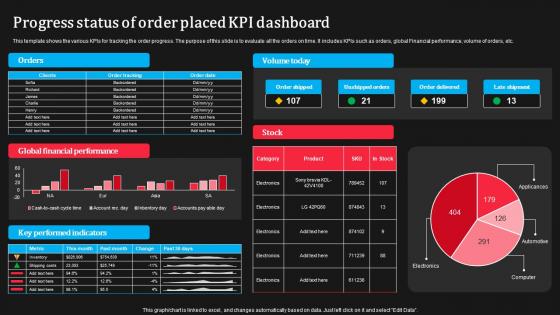
Progress Status Of Order Placed KPI Dashboard Sample Pdf
This template shows the various KPIs for tracking the order progress. The purpose of this slide is to evaluate all the orders on time. It includes KPIs such as orders, global Financial performance, volume of orders, etc.Pitch your topic with ease and precision using this Progress Status Of Order Placed KPI Dashboard Sample Pdf This layout presents information on Progress Status, Order Placed, KPI Dashboard It is also available for immediate download and adjustment. So, changes can be made in the color, design, graphics or any other component to create a unique layout.
Dashboard For Tracking Sales Target Metrics Introduction PDF
This slide presents KPI dashboard for tracking Sales Target Metrics achievement monthly and region wise helpful in adjusting activities as per ongoing performance. It includes average weekly sales revenue, average sales target, annual sales growth, regional sales performance and average revenue per unit that should be regularly tracked. Showcasing this set of slides titled Dashboard For Tracking Sales Target Metrics Introduction PDF. The topics addressed in these templates are Average Revenue, Per Unit, Average Weekly, Sales Revenue. All the content presented in this PPT design is completely editable. Download it and make adjustments in color, background, font etc. as per your unique business setting.

KPI Dashboard To Measure Merchandising Product Plan Effectiveness Guidelines PDF
Mentioned slide outlines a comprehensive performance key performance indicator KPI dashboard which can be used to evaluate success rate of retail merchandising plan. It provides information about sales revenue, customers, average transaction price, average units per customer, sales by different cities, etc. Showcasing this set of slides titled KPI Dashboard To Measure Merchandising Product Plan Effectiveness Guidelines PDF. The topics addressed in these templates are Sales, Customers, Price. All the content presented in this PPT design is completely editable. Download it and make adjustments in color, background, font etc. as per your unique business setting.
Salesman Principles Playbook Sales Management Activities Tracking Dashboard Ideas PDF
This slide provides information regarding various metrics catered to track sales team performance in terms of average revenue per account, win rate, NPS, along with sales representative performance tracking through number of opportunities created, lead response time, etc. Deliver and pitch your topic in the best possible manner with this salesman principles playbook sales management activities tracking dashboard ideas pdf Use them to share invaluable insights on sales management activities tracking dashboard and impress your audience. This template can be altered and modified as per your expectations. So, grab it now.
Sales Management Playbook Sales Management Activities Tracking Dashboard Themes PDF
This slide provides information regarding various metrics catered to track sales team performance in terms of average revenue per account, win rate, NPS, along with sales representative performance tracking through number of opportunities created, lead response time, etc. Deliver an awe inspiring pitch with this creative Sales Management Playbook Sales Management Activities Tracking Dashboard Themes PDF bundle. Topics like Sales Management Activities Tracking Dashboard can be discussed with this completely editable template. It is available for immediate download depending on the needs and requirements of the user.
Sales Techniques Playbook Sales Management Activities Tracking Dashboard Introduction PDF
This slide provides information regarding various metrics catered to track sales team performance in terms of average revenue per account, win rate, NPS, along with sales representative performance tracking through number of opportunities created, lead response time, etc. Deliver an awe inspiring pitch with this creative sales techniques playbook sales management activities tracking dashboard introduction pdf bundle. Topics like growth, sales can be discussed with this completely editable template. It is available for immediate download depending on the needs and requirements of the user.

B2B Marketing KPI Dashboard INSIGHT Ppt Ideas Information PDF
Deliver an awe-inspiring pitch with this creative b2b marketing kpi dashboard insight ppt ideas information pdf bundle. Topics like revenue breakdown, leads region, sales reps leads, sales representatives leads actual, sales results identify individual performance can be discussed with this completely editable template. It is available for immediate download depending on the needs and requirements of the user.
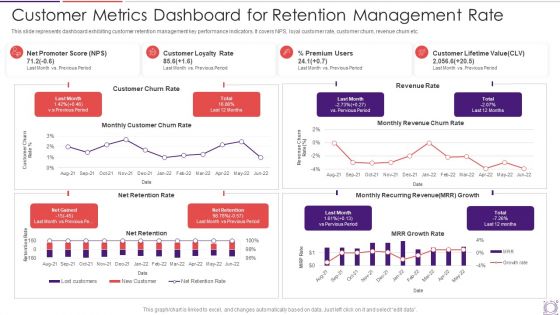
Customer Metrics Dashboard For Retention Management Rate Information PDF
This slide represents dashboard exhibiting customer retention management key performance indicators. It covers NPS, loyal customer rate, customer churn, revenue churn etc. Showcasing this set of slides titled customer metrics dashboard for retention management rate information pdf. The topics addressed in these templates are customer, premium users. All the content presented in this PPT design is completely editable. Download it and make adjustments in color, background, font etc. as per your unique business setting.
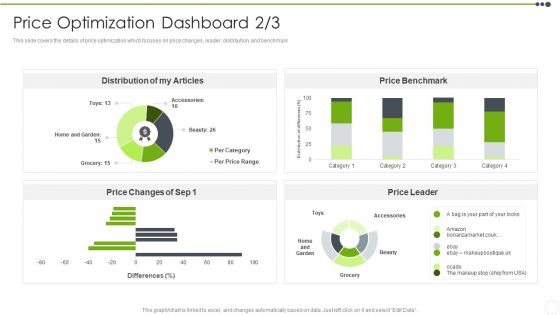
Estimating The Price Price Optimization Dashboard Range Guidelines PDF
This slide covers the details of price optimization which focuses on number of visitors, customers, revenues, performance by devices, etc. Deliver and pitch your topic in the best possible manner with this Estimating The Price Price Optimization Dashboard Range Guidelines PDF. Use them to share invaluable insights on Price Optimization Dashboard and impress your audience. This template can be altered and modified as per your expectations. So, grab it now.

Business Pricing Model Price Optimization Dashboard Customers Information PDF
This slide covers the details of price optimization which focuses on number of visitors, customers, revenues, performance by devices, etc. Deliver and pitch your topic in the best possible manner with this business pricing model price optimization dashboard customers information pdf. Use them to share invaluable insights on visitors, customers, revenue and impress your audience. This template can be altered and modified as per your expectations. So, grab it now.
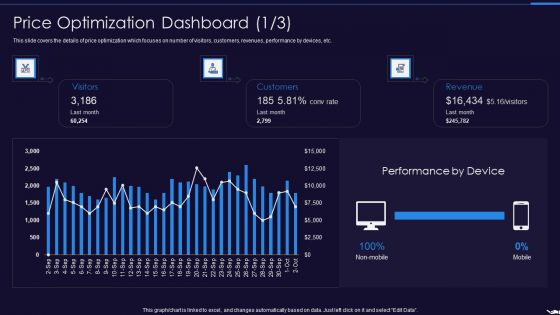
Optimize Marketing Pricing Price Optimization Dashboard Customers Graphics PDF
This slide covers the details of price optimization which focuses on number of visitors, customers, revenues, performance by devices, etc. Deliver and pitch your topic in the best possible manner with this optimize marketing pricing price optimization dashboard customers graphics pdf. Use them to share invaluable insights on visitors, customers, revenue and impress your audience. This template can be altered and modified as per your expectations. So, grab it now.
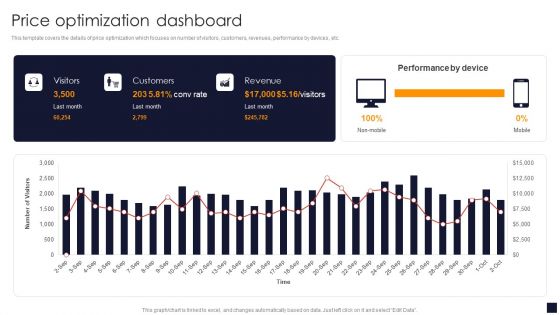
Price Optimization Dashboard Product Pricing Strategic Guide Introduction PDF
This template covers the details of price optimization which focuses on number of visitors, customers, revenues, performance by devices, etc.If your project calls for a presentation, then Slidegeeks is your go-to partner because we have professionally designed, easy-to-edit templates that are perfect for any presentation. After downloading, you can easily edit Price Optimization Dashboard Product Pricing Strategic Guide Introduction PDF and make the changes accordingly. You can rearrange slides or fill them with different images. Check out all the handy templates
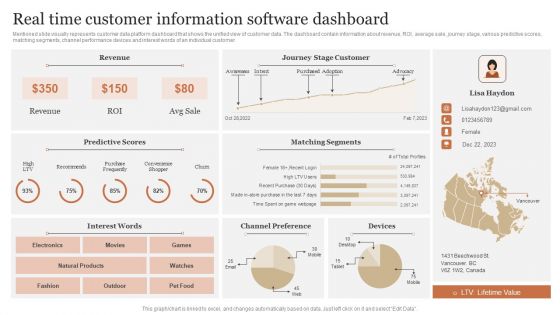
Real Time Customer Information Software Dashboard Portrait PDF
Mentioned slide visually represents customer data platform dashboard that shows the unified view of customer data. The dashboard contain information about revenue, ROI, average sale, journey stage, various predictive scores, matching segments, channel performance devices and interest words of an individual customer. Showcasing this set of slides titled Real Time Customer Information Software Dashboard Portrait PDF. The topics addressed in these templates are Predictive Scores, Matching Segments, Channel Preference. All the content presented in this PPT design is completely editable. Download it and make adjustments in color, background, font etc. as per your unique business setting.

Quarterly Business Information Dashboard With Product Segments Slides PDF
This slide displays dashboard for performance analysis of key business operations to compare companys growth in different quarters. It further includes information such as sales, revenue, gross profit, income and expenditure, etc. Showcasing this set of slides titled Quarterly Business Information Dashboard With Product Segments Slides PDF. The topics addressed in these templates are Quarterly Business Information, Dashboard With Product Segments. All the content presented in this PPT design is completely editable. Download it and make adjustments in color, background, font etc. as per your unique business setting.
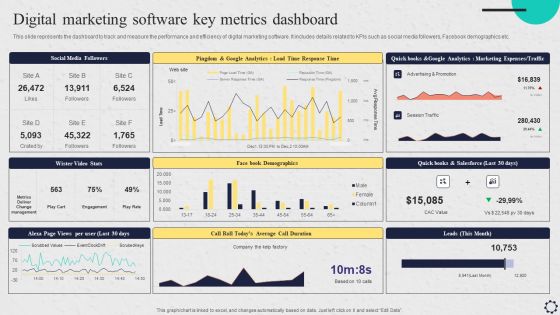
Software Implementation Strategy Digital Marketing Software Key Metrics Dashboard Template PDF
This slide represents the dashboard to track and measure the performance and efficiency of digital marketing software. It includes details related to KPIs such as social media followers, Facebook demographics etc. Crafting an eye catching presentation has never been more straightforward. Let your presentation shine with this tasteful yet straightforward Software Implementation Strategy Digital Marketing Software Key Metrics Dashboard Template PDF template. It offers a minimalistic and classy look that is great for making a statement. The colors have been employed intelligently to add a bit of playfulness while still remaining professional. Construct the idealSoftware Implementation Strategy Digital Marketing Software Key Metrics Dashboard Template PDF that effortlessly grabs the attention of your audience Begin now and be certain to wow your customers.
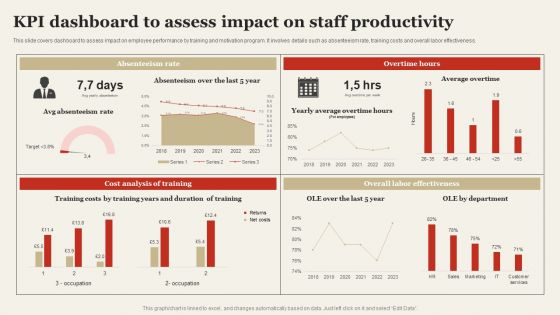
KPI Dashboard To Assess Impact On Staff Productivity Infographics PDF
This slide covers dashboard to assess impact on employee performance by training and motivation program. It involves details such as absenteeism rate, training costs and overall labor effectiveness. Make sure to capture your audiences attention in your business displays with our gratis customizable KPI Dashboard To Assess Impact On Staff Productivity Infographics PDF. These are great for business strategies, office conferences, capital raising or task suggestions. If you desire to acquire more customers for your tech business and ensure they stay satisfied, create your own sales presentation with these plain slides.

Sales Work Action Plan Analysis Dashboard Brochure PDF
This slide covers the dashboard for analyzing the sales plan implemented in an organization. The purpose of this template is to assess strategical and operational aspects of the company. It includes key performance indicators such as number of sales, revenue, profit, cost, etc. Showcasing this set of slides titled Sales Work Action Plan Analysis Dashboard Brochure PDF. The topics addressed in these templates are Sales Revenue, Cost Breakdown, Accumulated Revenue. All the content presented in this PPT design is completely editable. Download it and make adjustments in color, background, font etc. as per your unique business setting.
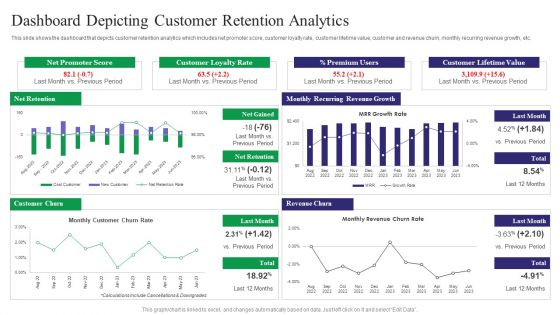
Reducing Customer Turnover Rates Dashboard Depicting Customer Retention Brochure PDF
This slide shows the dashboard that depicts customer retention analytics which includes net promoter score, customer loyalty rate, customer lifetime value, customer and revenue churn, monthly recurring revenue growth, etc. From laying roadmaps to briefing everything in detail, our templates are perfect for you. You can set the stage with your presentation slides. All you have to do is download these easy-to-edit and customizable templates. Reducing Customer Turnover Rates Dashboard Depicting Customer Retention Brochure PDF will help you deliver an outstanding performance that everyone would remember and praise you for. Do download this presentation today.

Investment Project KPI Dashboard For Construction Analytics Background PDF
This slide illustrates construction dashboard for improving capital project outcomes. It also include KPIs such as projects completion, schedule performance index, consumer price index, project status, cost breakdown, etc. Pitch your topic with ease and precision using this Investment Project KPI Dashboard For Construction Analytics Background PDF. This layout presents information on Cost Breakdown, Completion, Progress. It is also available for immediate download and adjustment. So, changes can be made in the color, design, graphics or any other component to create a unique layout.
Increasing Customer Kpi Dashboard For Tracking Customer Retention Download PDF
This slide covers the dashboard for analyzing customer loyalty with metrics such as NPS, loyal customer rate, premium users, CLV, customer churn, revenue churn, net retention, MRR growth, etc. From laying roadmaps to briefing everything in detail, our templates are perfect for you. You can set the stage with your presentation slides. All you have to do is download these easy-to-edit and customizable templates. Increasing Customer Kpi Dashboard For Tracking Customer Retention Download PDF will help you deliver an outstanding performance that everyone would remember and praise you for. Do download this presentation today.
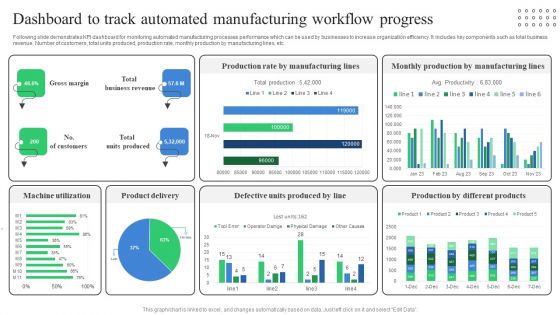
Dashboard To Track Automated Manufacturing Workflow Progress Professional PDF
Following slide demonstrates KPI dashboard for monitoring automated manufacturing processes performance which can be used by businesses to increase organization efficiency. It includes key components such as total business revenue, Number of customers, total units produced, production rate, monthly production by manufacturing lines, etc. Showcasing this set of slides titled Dashboard To Track Automated Manufacturing Workflow Progress Professional PDF. The topics addressed in these templates are Machine Utilization, Product Delivery, Defective Units Produced. All the content presented in this PPT design is completely editable. Download it and make adjustments in color, background, font etc. as per your unique business setting.
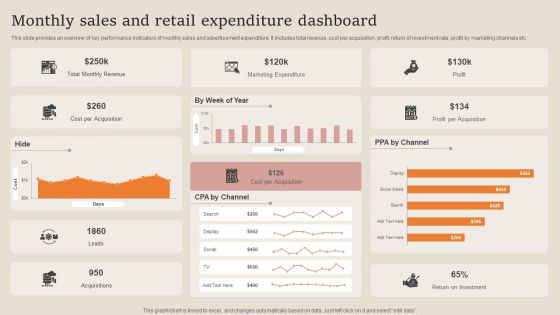
Monthly Sales And Retail Expenditure Dashboard Summary PDF
This slide provides an overview of key performance indicators of monthly sales and advertisement expenditure. It includes total revenue, cost per acquisition, profit, return of investment rate, profit by marketing channels etc. Pitch your topic with ease and precision using this Monthly Sales And Retail Expenditure Dashboard Summary PDF. This layout presents information on Marketing Expenditure, Revenue, Cost Per Acquisition. It is also available for immediate download and adjustment. So, changes can be made in the color, design, graphics or any other component to create a unique layout.
Cryptocurrency Portfolio Tracking Dashboard Summary Cryptocurrency Management With Blockchain
This slide represents the cryptocurrency performance indicators for the individual. The key components include invested money, profit and loss, rate of investment ROI, current valuation of money, etc.Formulating a presentation can take up a lot of effort and time, so the content and message should always be the primary focus. The visuals of the PowerPoint can enhance the presenters message, so our Cryptocurrency Portfolio Tracking Dashboard Summary Cryptocurrency Management With Blockchain was created to help save time. Instead of worrying about the design, the presenter can concentrate on the message while our designers work on creating the ideal templates for whatever situation is needed. Slidegeeks has experts for everything from amazing designs to valuable content, we have put everything into Cryptocurrency Portfolio Tracking Dashboard Summary Cryptocurrency Management With Blockchain.

Kpi Dashboard To Track Digital Transformation Initiatives Formats PDF
Following slide provides dashboard that can be used by the businesses to measure the performance of digital transformation initiatives with the help of different KPIs. KPIs covered are social presence, click through rate, sales revenue, churn amount etc. Crafting an eye catching presentation has never been more straightforward. Let your presentation shine with this tasteful yet straightforward Kpi Dashboard To Track Digital Transformation Initiatives Formats PDF template. It offers a minimalistic and classy look that is great for making a statement. The colors have been employed intelligently to add a bit of playfulness while still remaining professional. Construct the ideal Kpi Dashboard To Track Digital Transformation Initiatives Formats PDF that effortlessly grabs the attention of your audience Begin now and be certain to wow your customers.
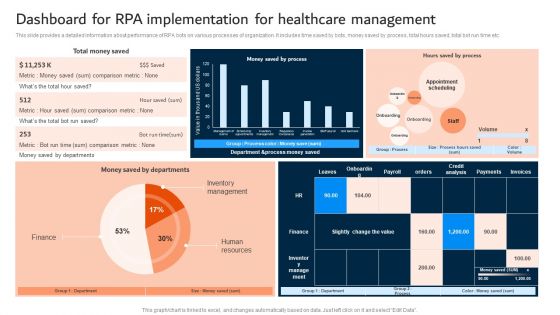
Dashboard For RPA Implementation For Healthcare Management Slides PDF
This slide provides a detailed information about performance of RPA bots on various processes of organization. It includes time saved by bots, money saved by process, total hours saved, total bot run time etc. Formulating a presentation can take up a lot of effort and time, so the content and message should always be the primary focus. The visuals of the PowerPoint can enhance the presenters message, so our Dashboard For RPA Implementation For Healthcare Management Slides PDF was created to help save time. Instead of worrying about the design, the presenter can concentrate on the message while our designers work on creating the ideal templates for whatever situation is needed. Slidegeeks has experts for everything from amazing designs to valuable content, we have put everything into Dashboard For RPA Implementation For Healthcare Management Slides PDF.

Strategies To Select Effective Price Optimization Dashboard Graphics PDF
This template covers the details of price optimization which focuses on number of visitors, customers, revenues, performance by devices, etc. Here you can discover an assortment of the finest PowerPoint and Google Slides templates. With these templates, you can create presentations for a variety of purposes while simultaneously providing your audience with an eye-catching visual experience. Download Strategies To Select Effective Price Optimization Dashboard Graphics PDF to deliver an impeccable presentation. These templates will make your job of preparing presentations much quicker, yet still, maintain a high level of quality. Slidegeeks has experienced researchers who prepare these templates and write high-quality content for you. Later on, you can personalize the content by editing the Strategies To Select Effective Price Optimization Dashboard Graphics PDF.

KPI Dashboard For Modernizing Hospitality Business Inspiration PDF
The following slide showcases dashboard to track data and perform analytics for managing staff, ordering supplies and to maintain customer satisfaction. It presents information related to expenses, sales, etc. Pitch your topic with ease and precision using this KPI Dashboard For Modernizing Hospitality Business Inspiration PDF. This layout presents information on Fiscal Year, Labor, Modernizing Hospitality. It is also available for immediate download and adjustment. So, changes can be made in the color, design, graphics or any other component to create a unique layout.

 Home
Home