Financial Kpi

Financial Assets Management KPI And Dashboard Ppt PowerPoint Presentation Complete Deck With Slides
Presenting this set of slides with name financial assets management kpi and dashboard ppt powerpoint presentation complete deck with slides. The topics discussed in these slides are pipeline projects, financial forecast, work forecast. This is a completely editable PowerPoint presentation and is available for immediate download. Download now and impress your audience.

Thank You Financial Assets Management KPI And Dashboar Ppt PowerPoint Presentation Inspiration Information
Presenting this set of slides with name thank you financial assets management kpi and dashboar ppt powerpoint presentation inspiration information. The topics discussed in these slide is thank you. This is a completely editable PowerPoint presentation and is available for immediate download. Download now and impress your audience.

Sustainability Calculation With KPI Financial Performance Indicator Dashboard Infographics PDF Template PDF
This slide shows financial performance indicator dashboard covering net profit and net sales, profitability indicator ratios, cogs and net profit by region or channel. Deliver an awe inspiring pitch with this creative sustainability calculation with kpi financial performance indicator dashboard infographics pdf bundle. Topics like net profit margin, net profit and net sales, profitability indicator ratios, sold breakdown can be discussed with this completely editable template. It is available for immediate download depending on the needs and requirements of the user.

Project KPI Dashboard To Monitor Financial Budget Evaluation Demonstration PDF
This slide signifies the key performance indicator dashboard to evaluate financial estimation. It covers information regarding to expense, payable account and monthly performance. Showcasing this set of slides titled Project KPI Dashboard To Monitor Financial Budget Evaluation Demonstration PDF. The topics addressed in these templates are Project KPI Dashboard, Monitor Financial Budget Evaluation. All the content presented in this PPT design is completely editable. Download it and make adjustments in color, background, font etc. as per your unique business setting.
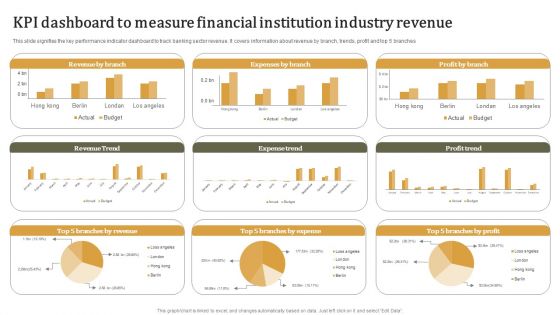
KPI Dashboard To Measure Financial Institution Industry Revenue Summary PDF
Pitch your topic with ease and precision using this KPI Dashboard To Measure Financial Institution Industry Revenue Summary PDF. This layout presents information on Measure Financial, Institution Industry . It is also available for immediate download and adjustment. So, changes can be made in the color, design, graphics or any other component to create a unique layout.
KPI Dashboard For Tracking Financial Management Challenges Download PDF
Following slide demonstrates KPI dashboard for monitoring business cash flow management pain points to improve organisation financial performance. It includes elements such as quick ratio, current ration, annual cash balance, monthly cash balance, accounts receivable and payables, etc. Showcasing this set of slides titled KPI Dashboard For Tracking Financial Management Challenges Download PDF. The topics addressed in these templates are Monthly Cash Flow, Account Payable By Days, Annual Revenue, Annual Cost, Annual Net Profits. All the content presented in this PPT design is completely editable. Download it and make adjustments in color, background, font etc. as per your unique business setting.
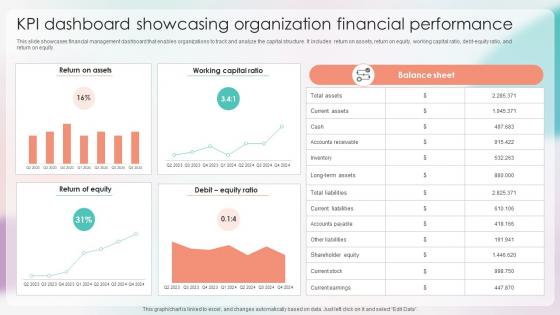
Strategies For Stabilizing Corporate KPI Dashboard Showcasing Organization Financial
This slide showcases financial management dashboard that enables organizations to track and analyze the capital structure. It includes return on assets, return on equity, working capital ratio, debt-equity ratio, and return on equity. Coming up with a presentation necessitates that the majority of the effort goes into the content and the message you intend to convey. The visuals of a PowerPoint presentation can only be effective if it supplements and supports the story that is being told. Keeping this in mind our experts created Strategies For Stabilizing Corporate KPI Dashboard Showcasing Organization Financial to reduce the time that goes into designing the presentation. This way, you can concentrate on the message while our designers take care of providing you with the right template for the situation.
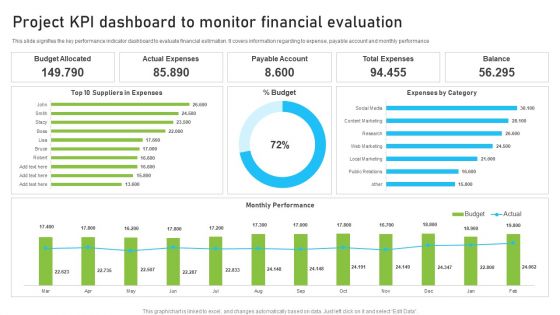
Project KPI Dashboard To Monitor Financial Evaluation Background PDF
This slide signifies the construction project management projection plan. It covers information regarding to the estimate ID, Task, effort hours, resource quantity, performance factor and duration evaluation. Pitch your topic with ease and precision using this Project KPI Dashboard To Monitor Financial Evaluation Background PDF. This layout presents information on Actual Expenses, Payable Account, Budget Allocated. It is also available for immediate download and adjustment. So, changes can be made in the color, design, graphics or any other component to create a unique layout.
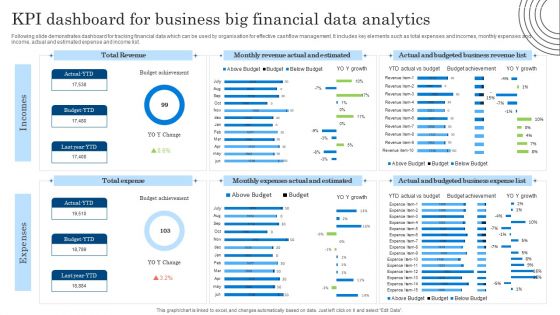
KPI Dashboard For Business Big Financial Data Analytics Diagrams PDF
Following slide demonstrates dashboard for tracking financial data which can be used by organisation for effective cashflow management. It includes key elements such as total expenses and incomes, monthly expenses and income, actual and estimated expense and income list. Showcasing this set of slides titled KPI Dashboard For Business Big Financial Data Analytics Diagrams PDF. The topics addressed in these templates are KPI Dashboard, Business Big Financial, Data Analytics. All the content presented in this PPT design is completely editable. Download it and make adjustments in color, background, font etc. as per your unique business setting.
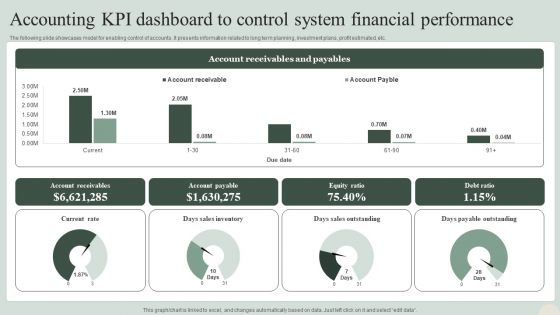
Accounting KPI Dashboard To Control System Financial Performance Formats PDF
The following slide showcases model for enabling control of accounts. It presents information related to long term planning, investment plans, profit estimated, etc. Pitch your topic with ease and precision using this Accounting KPI Dashboard To Control System Financial Performance Formats PDF. This layout presents information on Sales Outstanding, Payable Outstanding, Sales Inventory. It is also available for immediate download and adjustment. So, changes can be made in the color, design, graphics or any other component to create a unique layout.

Financials Summary With Kpi Base Plan Vs Stretch Plan Powerpoint Slides
This is a financials summary with kpi base plan vs stretch plan powerpoint slides. This is a four stage process. The stages in this process are financials summary, base plan, stretch plan, comments, kpi 1, kpi 3, revenue, cost of sales, gross profit, customer acquisition cost, other operating expense, operating profit, change in cash, ending cash, employees ftes.

Financial Functional Assessment Infrastructure KPI Dashboard Showing Project Revenue Pictures PDF
Deliver and pitch your topic in the best possible manner with this financial functional assessment infrastructure kpi dashboard showing project revenue pictures pdf. Use them to share invaluable insights on infrastructure kpi dashboard showing project revenue and impress your audience. This template can be altered and modified as per your expectations. So, grab it now.

Financial Functional Assessment Infrastructure KPI Dashboard Showing Resource Allocation Ideas PDF
Deliver an awe-inspiring pitch with this creative financial functional assessment infrastructure kpi dashboard showing resource allocation ideas pdf bundle. Topics like resource allocation, project financial, delivery timeline, resources can be discussed with this completely editable template. It is available for immediate download depending on the needs and requirements of the user.

Financial Functional Assessment Infrastructure KPI Dashboard Showing Cost Reduction And Procurement Brochure PDF
Deliver an awe-inspiring pitch with this creative financial functional assessment infrastructure kpi dashboard showing cost reduction and procurement brochure pdf bundle. Topics like cost reduction, cost savings, cost avoidance, cost of purchase, procurement roi can be discussed with this completely editable template. It is available for immediate download depending on the needs and requirements of the user.
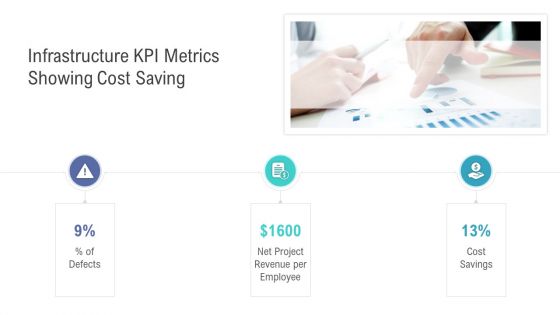
Financial Functional Assessment Infrastructure KPI Metrics Showing Cost Saving Professional PDF
This is a financial functional assessment infrastructure kpi metrics showing cost saving professional pdf template with various stages. Focus and dispense information on three stages using this creative set, that comes with editable features. It contains large content boxes to add your information on topics like cost savings, net project revenue, defects. You can also showcase facts, figures, and other relevant content using this PPT layout. Grab it now.

Financial Functional Assessment Infrastructure KPI Metrics Showing Square Meter Area Summary PDF
Presenting financial functional assessment infrastructure kpi metrics showing square meter area summary pdf to provide visual cues and insights. Share and navigate important information on three stages that need your due attention. This template can be used to pitch topics like square meter price, actual construction time, activities. In addition, this PPT design contains high-resolution images, graphics, etc, that are easily editable and available for immediate download.

KPI Dashboard With Financial Analysis Of Company Ppt PowerPoint Presentation Backgrounds
This is a kpi dashboard with financial analysis of company ppt powerpoint presentation backgrounds. This is a four stage process. The stages in this process are business, strategy, marketing, line graph, finance.

Kpi Dashboard To Analyze Financial Guide To Corporate Financial Growth Plan Designs Pdf
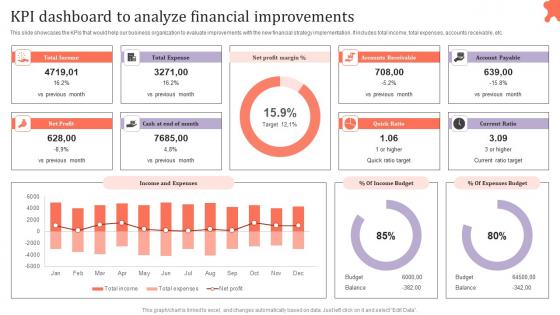
This slide showcases the KPIs that would help our business organization to evaluate improvements with the new financial strategy implementation. It includes total income, total expenses, accounts receivable, etc.Presenting this PowerPoint presentation, titled Kpi Dashboard To Analyze Financial Guide To Corporate Financial Growth Plan Designs Pdf, with topics curated by our researchers after extensive research. This editable presentation is available for immediate download and provides attractive features when used. Download now and captivate your audience. Presenting this Kpi Dashboard To Analyze Financial Guide To Corporate Financial Growth Plan Designs Pdf. Our researchers have carefully researched and created these slides with all aspects taken into consideration. This is a completely customizable Kpi Dashboard To Analyze Financial Guide To Corporate Financial Growth Plan Designs Pdf that is available for immediate downloading. Download now and make an impact on your audience. Highlight the attractive features available with our PPTs.
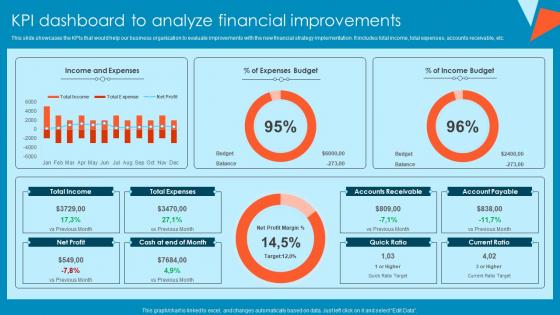
KPI Dashboard To Analyze Financial Improvements Tactical Financial Governance Brochure Pdf
This slide showcases the KPIs that would help our business organization to evaluate improvements with the new financial strategy implementation. It includes total income, total expenses, accounts receivable, etc.Boost your pitch with our creative KPI Dashboard To Analyze Financial Improvements Tactical Financial Governance Brochure Pdf. Deliver an awe-inspiring pitch that will mesmerize everyone. Using these presentation templates you will surely catch everyones attention. You can browse the ppts collection on our website. We have researchers who are experts at creating the right content for the templates. So you do not have to invest time in any additional work. Just grab the template now and use them.
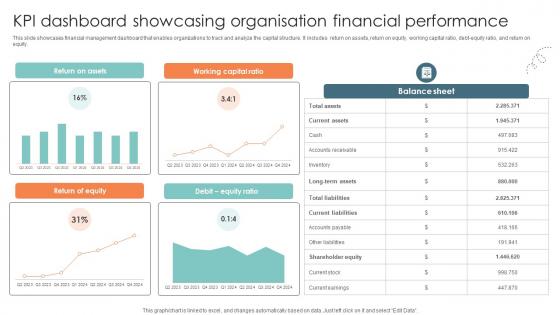
Kpi Dashboard Showcasing Organisation Financial Performance Strategic Approaches To Corporate Financial
This slide showcases financial management dashboard that enables organizations to track and analyze the capital structure. It includes return on assets, return on equity, working capital ratio, debt-equity ratio, and return on equity. This modern and well-arranged Kpi Dashboard Showcasing Organisation Financial Performance Strategic Approaches To Corporate Financial provides lots of creative possibilities. It is very simple to customize and edit with the Powerpoint Software. Just drag and drop your pictures into the shapes. All facets of this template can be edited with Powerpoint, no extra software is necessary. Add your own material, put your images in the places assigned for them, adjust the colors, and then you can show your slides to the world, with an animated slide included.
KPI Dashboard To Analyze Financial Assessing Corporate Financial Techniques Clipart Pdf
This slide showcases the KPIs that would help our business organization to evaluate improvements with the new financial strategy implementation. It includes total income, total expenses, accounts receivable, etc. Retrieve professionally designed KPI Dashboard To Analyze Financial Assessing Corporate Financial Techniques Clipart Pdf to effectively convey your message and captivate your listeners. Save time by selecting pre made slideshows that are appropriate for various topics, from business to educational purposes. These themes come in many different styles, from creative to corporate, and all of them are easily adjustable and can be edited quickly. Access them as PowerPoint templates or as Google Slides themes. You do not have to go on a hunt for the perfect presentation because Slidegeeks got you covered from everywhere.
Operational Risk Management Structure In Financial Companies Operational Risk Management Kpi Dashboard Download PDF
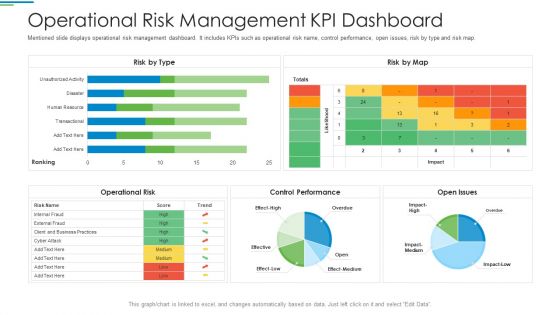
Mentioned slide displays operational risk management dashboard. It includes KPIs such as operational risk name, control performance, open issues, risk by type and risk map. Deliver and pitch your topic in the best possible manner with this operational risk management structure in financial companies operational risk management kpi dashboard download pdf. Use them to share invaluable insights on operational risk name, control performance, open issues, risk by type and risk map and impress your audience. This template can be altered and modified as per your expectations. So, grab it now.
Sustainability Calculation With KPI Key Financials Of The Company Structure PDF Themes PDF
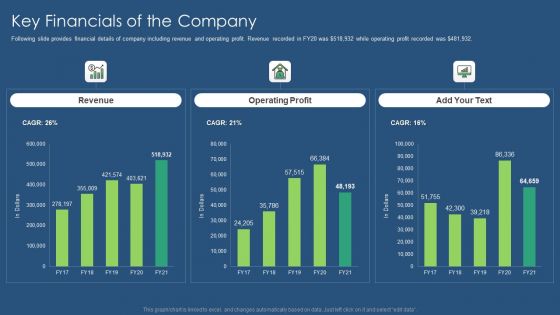
Following slide provides financial details of company including revenue and operating profit. Revenue recorded in FY20 was dollor518,932 while operating profit recorded was dollor481,932. Deliver and pitch your topic in the best possible manner with this sustainability calculation with kpi key financials of the company structure pdf. Use them to share invaluable insights on revenue, operating profit and impress your audience. This template can be altered and modified as per your expectations. So, grab it now.
How Electronic Commerce Financial Procedure Can Be Enhanced Ecommerce Kpi Dashboard Slides PDF
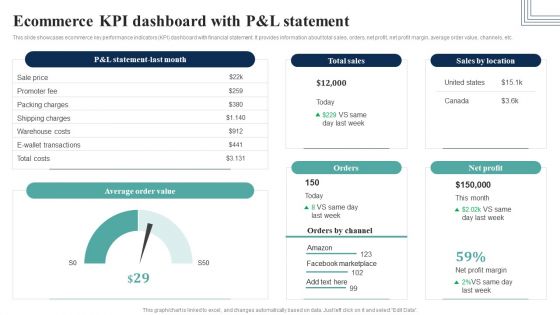
This slide showcases ecommerce key performance indicators KPI dashboard with financial statement. It provides information about total sales, orders, net profit, net profit margin, average order value, channels, etc.Create an editable How Electronic Commerce Financial Procedure Can Be Enhanced Ecommerce Kpi Dashboard Slides PDF that communicates your idea and engages your audience. Whether you are presenting a business or an educational presentation, pre-designed presentation templates help save time. How Electronic Commerce Financial Procedure Can Be Enhanced Ecommerce Kpi Dashboard Slides PDF is highly customizable and very easy to edit, covering many different styles from creative to business presentations. Slidegeeks has creative team members who have crafted amazing templates. So, go and get them without any delay.
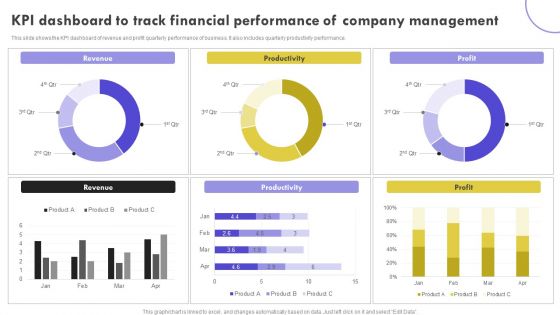
KPI Dashboard To Track Financial Performance Of Company Management Clipart PDF
This slide shows the KPI dashboard of revenue and profit quarterly performance of business. It also includes quarterly productivity performance. Pitch your topic with ease and precision using this KPI Dashboard To Track Financial Performance Of Company Management Clipart PDF. This layout presents information on Revenue, Productivity, Profit. It is also available for immediate download and adjustment. So, changes can be made in the color, design, graphics or any other component to create a unique layout.

KPI Dashboard To Monitor Financial Budget Allocation And Distribution Portrait PDF
This slide signifies the key performance indicator dashboard on organisation financial budget allocation within various department. It includes budget allocation, monthly performance, top suppliers etc.Deliver an awe inspiring pitch with this creative KPI Dashboard To Monitor Financial Budget Allocation And Distribution Portrait PDF bundle. Topics like Budget Allocated, Budget Distributed, Payable Account can be discussed with this completely editable template. It is available for immediate download depending on the needs and requirements of the user.

KPI Dashboard To Analyze Financial Improvements Effective Planning For Monetary Portrait PDF
This slide showcases the KPIs that would help our business organization to evaluate improvements with the new financial strategy implementation. It includes total income, total expenses, accounts receivable, etc.Find highly impressive KPI Dashboard To Analyze Financial Improvements Effective Planning For Monetary Portrait PDF on Slidegeeks to deliver a meaningful presentation. You can save an ample amount of time using these presentation templates. No need to worry to prepare everything from scratch because Slidegeeks experts have already done a huge research and work for you. You need to download KPI Dashboard To Analyze Financial Improvements Effective Planning For Monetary Portrait PDF for your upcoming presentation. All the presentation templates are 100precent editable and you can change the color and personalize the content accordingly. Download now,
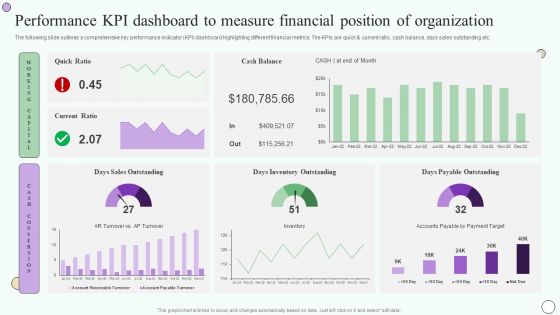
Estimating Business Overall Performance Kpi Dashboard To Measure Financial Position Inspiration PDF
The following slide outlines a comprehensive key performance indicator KPI dashboard highlighting different financial metrics. The KPIs are quick and current ratio, cash balance, days sales outstanding etc. Welcome to our selection of the Estimating Business Overall Performance Kpi Dashboard To Measure Financial Position Inspiration PDF. These are designed to help you showcase your creativity and bring your sphere to life. Planning and Innovation are essential for any business that is just starting out. This collection contains the designs that you need for your everyday presentations. All of our PowerPoints are 100 percent editable, so you can customize them to suit your needs. This multi-purpose template can be used in various situations. Grab these presentation templates today.

Overview Of Organizational Performance Kpi Dashboard To Measure Financial Position Sample PDF
The following slide outlines a comprehensive key performance indicator KPI dashboard highlighting different financial metrics. The KPIs are quick and current ratio, cash balance, days sales outstanding etc. Welcome to our selection of the Overview Of Organizational Performance Kpi Dashboard To Measure Financial Position Sample PDF. These are designed to help you showcase your creativity and bring your sphere to life. Planning and Innovation are essential for any business that is just starting out. This collection contains the designs that you need for your everyday presentations. All of our PowerPoints are 100 percent editable, so you can customize them to suit your needs. This multi-purpose template can be used in various situations. Grab these presentation templates today.
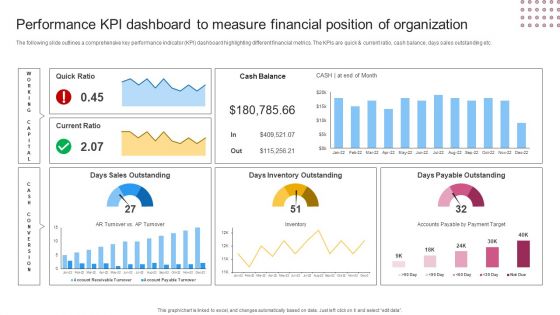
Performance KPI Dashboard To Measure Financial Position Of Organization Pictures PDF
The following slide outlines a comprehensive key performance indicator KPI dashboard highlighting different financial metrics. The KPIs are quick and current ratio, cash balance, days sales outstanding etc. Slidegeeks is here to make your presentations a breeze with Performance KPI Dashboard To Measure Financial Position Of Organization Pictures PDF With our easy to use and customizable templates, you can focus on delivering your ideas rather than worrying about formatting. With a variety of designs to choose from, you are sure to find one that suits your needs. And with animations and unique photos, illustrations, and fonts, you can make your presentation pop. So whether you are giving a sales pitch or presenting to the board, make sure to check out Slidegeeks first.
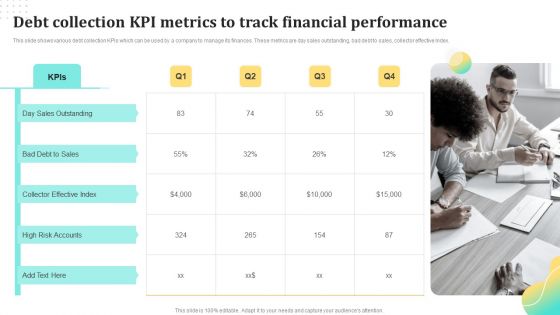
Debt Collection Kpi Metrics To Track Financial Performance Ppt Show Elements PDF
This slide shows various debt collection KPIs which can be used by a company to manage its finances. These metrics are day sales outstanding, bad debt to sales, collector effective Index. Persuade your audience using this Debt Collection Kpi Metrics To Track Financial Performance Ppt Show Elements PDF. This PPT design covers four stages, thus making it a great tool to use. It also caters to a variety of topics including Day Sales Outstanding, Collector Effective Index, High Risk Accounts. Download this PPT design now to present a convincing pitch that not only emphasizes the topic but also showcases your presentation skills.
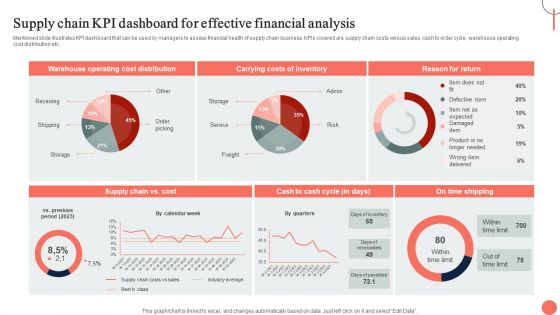
Strategies For Dynamic Supply Chain Agility Supply Chain Kpi Dashboard For Effective Financial Analysis Demonstration PDF
Mentioned slide illustrates KPI dashboard that can be used by managers to assess financial health of supply chain business. KPIs covered are supply chain costs versus sales, cash to order cycle, warehouse operating cost distribution etc. The Strategies For Dynamic Supply Chain Agility Supply Chain Kpi Dashboard For Effective Financial Analysis Demonstration PDF is a compilation of the most recent design trends as a series of slides. It is suitable for any subject or industry presentation, containing attractive visuals and photo spots for businesses to clearly express their messages. This template contains a variety of slides for the user to input data, such as structures to contrast two elements, bullet points, and slides for written information. Slidegeeks is prepared to create an impression.

KPI Dashboards Per Industry Energy Financial Dashboard Ppt PowerPoint Presentation Professional Example File PDF
Deliver and pitch your topic in the best possible manner with this kpi dashboards per industry energy financial dashboard ppt powerpoint presentation professional example file pdf. Use them to share invaluable insights on operating cashflow, total shareholder return, production costs source, sales sector, net income and impress your audience. This template can be altered and modified as per your expectations. So, grab it now.

KPI Dashboards Per Industry FMCG Financial Dashboard Ppt PowerPoint Presentation Outline Information PDF
Deliver an awe-inspiring pitch with this creative kpi dashboards per industry fmcg financial dashboard ppt powerpoint presentation outline information pdf bundle. Topics like supply chain cost, carrying costs of inventory, period 2020, supply chain costs vs sales can be discussed with this completely editable template. It is available for immediate download depending on the needs and requirements of the user.

Providing Electronic Financial Services To Existing Consumers Branch Scoreboard Kpi Dashboard Brochure PDF
This slide portrays branch scoreboard dashboard covering metrics such as accounts opened and closed, deposits to goal, accounts by type, expense to budget and referrals by product. Deliver an awe inspiring pitch with this creative Providing Electronic Financial Services To Existing Consumers Branch Scoreboard Kpi Dashboard Brochure PDF bundle. Topics like Product, Budget, Goal, Expense can be discussed with this completely editable template. It is available for immediate download depending on the needs and requirements of the user.

Guide To Healthcare Services Administration KPI Dashboard To Analyze Performance Healthcare Financial Demonstration PDF
The following slide showcases key performance indicator KPI dashboard which can be used to analyze the financial performance of hospital. The metrics covered in the slide are net profit margin, income and expenses, etc. Here you can discover an assortment of the finest PowerPoint and Google Slides templates. With these templates, you can create presentations for a variety of purposes while simultaneously providing your audience with an eye catching visual experience. Download Guide To Healthcare Services Administration KPI Dashboard To Analyze Performance Healthcare Financial Demonstration PDF to deliver an impeccable presentation. These templates will make your job of preparing presentations much quicker, yet still, maintain a high level of quality. Slidegeeks has experienced researchers who prepare these templates and write high quality content for you. Later on, you can personalize the content by editing the Guide To Healthcare Services Administration KPI Dashboard To Analyze Performance Healthcare Financial Demonstration PDF.
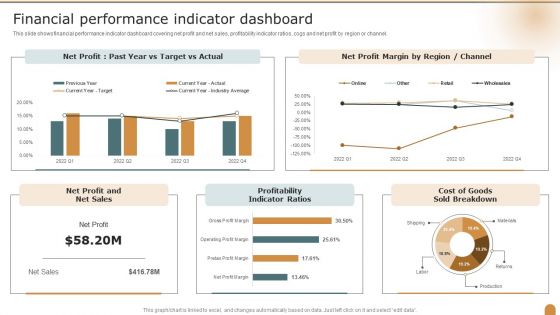
Financial Performance Indicator Dashboard Company Performance Evaluation Using KPI Structure PDF
This slide shows financial performance indicator dashboard covering net profit and net sales, profitability indicator ratios, cogs and net profit by region or channel. Deliver and pitch your topic in the best possible manner with this Financial Performance Indicator Dashboard Company Performance Evaluation Using KPI Structure PDF. Use them to share invaluable insights on Financial Performance, Indicator Dashboard, Profitability Indicator and impress your audience. This template can be altered and modified as per your expectations. So, grab it now.
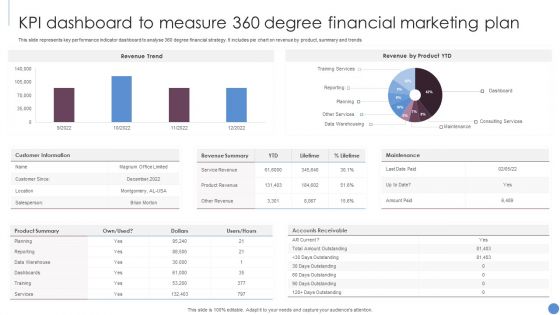
KPI Dashboard To Measure 360 Degree Financial Marketing Plan Slides PDF
This slide represents key performance indicator dashboard to analyse 360 degree financial strategy. It includes pie chart on revenue by product, summary and trends. Showcasing this set of slides titled KPI Dashboard To Measure 360 Degree Financial Marketing Plan Slides PDF. The topics addressed in these templates are Revenue Trend, Revenue Product YTD, Customer Information. All the content presented in this PPT design is completely editable. Download it and make adjustments in color, background, font etc. as per your unique business setting.
KPI Dashboard For Tracking Commercial Banking And Financial Activities Download PDF
This slide depicts a dashboard for tracking the banking and financial activities of a business enterprise to measure the income and expenses. The key performing indicators are business accounts, paid, pending and cancelled transactions etc. Pitch your topic with ease and precision using this KPI Dashboard For Tracking Commercial Banking And Financial Activities Download PDF. This layout presents information on KPI Dashboard, Tracking Commercial Banking, Financial Activities. It is also available for immediate download and adjustment. So, changes can be made in the color, design, graphics or any other component to create a unique layout.
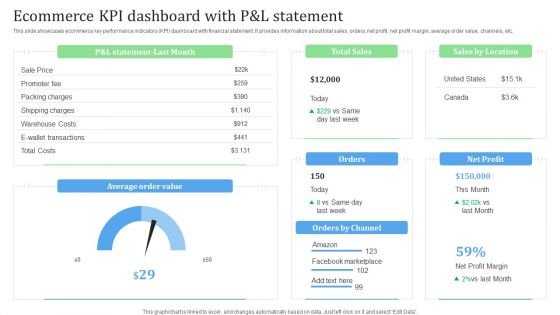
Ecommerce KPI Dashboard With P And L Statement Financial Management Strategies Background PDF
This slide showcases ecommerce key performance indicators KPI dashboard with financial statement. It provides information about total sales, orders, net profit, net profit margin, average order value, channels, etc.Whether you have daily or monthly meetings, a brilliant presentation is necessary. Ecommerce KPI Dashboard With P And L Statement Financial Management Strategies Background PDF can be your best option for delivering a presentation. Represent everything in detail using Ecommerce KPI Dashboard With P And L Statement Financial Management Strategies Background PDF and make yourself stand out in meetings. The template is versatile and follows a structure that will cater to your requirements. All the templates prepared by Slidegeeks are easy to download and edit. Our research experts have taken care of the corporate themes as well. So, give it a try and see the results.

KPI Dashboard To Analyze Performance Of Healthcare Financial Department Summary PDF
The following slide showcases key performance indicator KPI dashboard which can be used to analyze the financial performance of hospital. The metrics covered in the slide are net profit margin, income and expenses, etc. Do you have an important presentation coming up Are you looking for something that will make your presentation stand out from the rest Look no further than KPI Dashboard To Analyze Performance Of Healthcare Financial Department Summary PDF. With our professional designs, you can trust that your presentation will pop and make delivering it a smooth process. And with Slidegeeks, you can trust that your presentation will be unique and memorable. So why wait Grab KPI Dashboard To Analyze Performance Of Healthcare Financial Department Summary PDF today and make your presentation stand out from the rest.

KPI Dashboard To Analyze Performance Of Healthcare Financial Department Guidelines PDF
The following slide showcases key performance indicator KPI dashboard which can be used to analyze the financial performance of hospital. The metrics covered in the slide are net profit margin, income and expenses, etc. Retrieve professionally designed KPI Dashboard To Analyze Performance Of Healthcare Financial Department Guidelines PDF to effectively convey your message and captivate your listeners. Save time by selecting pre made slideshows that are appropriate for various topics, from business to educational purposes. These themes come in many different styles, from creative to corporate, and all of them are easily adjustable and can be edited quickly. Access them as PowerPoint templates or as Google Slides themes. You do not have to go on a hunt for the perfect presentation because Slidegeeks got you covered from everywhere.
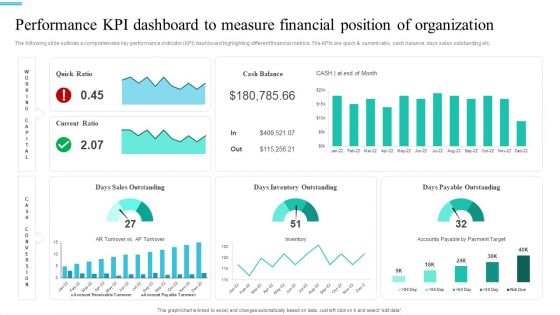
Monetary Planning And Evaluation Guide Performance KPI Dashboard To Measure Financial Position Of Organization Ppt File Slides PDF
The following slide outlines a comprehensive key performance indicator KPI dashboard highlighting different financial metrics. The KPIs are quick and current ratio, cash balance, days sales outstanding etc. The best PPT templates are a great way to save time, energy, and resources. Slidegeeks have 100 percent editable powerpoint slides making them incredibly versatile. With these quality presentation templates, you can create a captivating and memorable presentation by combining visually appealing slides and effectively communicating your message. Download Monetary Planning And Evaluation Guide Performance KPI Dashboard To Measure Financial Position Of Organization Ppt File Slides PDF from Slidegeeks and deliver a wonderful presentation.

Supply Chain Kpi Dashboard For Effective Financial Analysis Stand Out Digital Supply Chain Tactics Enhancing Graphics PDF
Mentioned slide illustrates KPI dashboard that can be used by managers to assess financial health of supply chain business. KPIs covered are supply chain costs versus sales, cash to order cycle, warehouse operating cost distribution etc.Coming up with a presentation necessitates that the majority of the effort goes into the content and the message you intend to convey. The visuals of a PowerPoint presentation can only be effective if it supplements and supports the story that is being told. Keeping this in mind our experts created Supply Chain Kpi Dashboard For Effective Financial Analysis Stand Out Digital Supply Chain Tactics Enhancing Graphics PDF to reduce the time that goes into designing the presentation. This way, you can concentrate on the message while our designers take care of providing you with the right template for the situation.

Key Financials Of The Company Company Performance Evaluation Using KPI Rules PDF
Following slide provides financial details of company including revenue and operating profit. Revenue recorded in FY22 was doller 518,932 while operating profit recorded was doller 481,932. Deliver an awe inspiring pitch with this creative Key Financials Of The Company Company Performance Evaluation Using KPI Rules PDF bundle. Topics like Revenue, Operating Profit, Company can be discussed with this completely editable template. It is available for immediate download depending on the needs and requirements of the user.
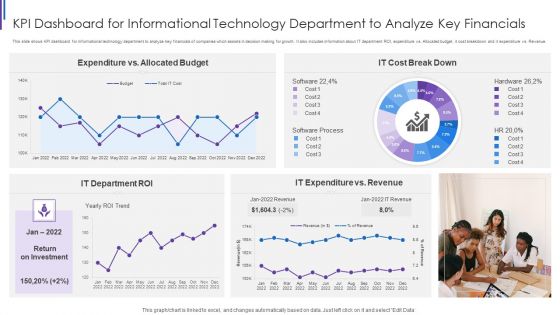
KPI Dashboard For Informational Technology Department To Analyze Key Financials Structure PDF
This slide shows KPI dashboard for informational technology department to analyze key financials of companies which assists in decision making for growth. It also includes information about IT department ROI, expenditure vs. Allocated budget, it cost breakdown and it expenditure vs. Revenue. Pitch your topic with ease and precision using this KPI Dashboard For Informational Technology Department To Analyze Key Financials Structure PDF. This layout presents information on Expenditure Vs Allocated, Budget IT Cost, Break Down IT, Expenditure Vs Revenue, IT Department ROI. It is also available for immediate download and adjustment. So, changes can be made in the color, design, graphics or any other component to create a unique layout.

Kpi Warehousing Dashboard Powerpoint Ideas
This is a kpi warehousing dashboard powerpoint ideas. This is a two stage process. The stages in this process are sales distribution, sales comparison.
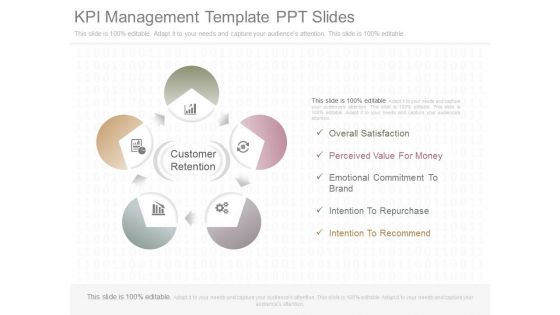
Kpi Management Template Ppt Slides
This is a kpi management template ppt slides. This is a five stage process. The stages in this process are overall satisfaction, perceived value for money, emotional commitment to brand, intention to repurchase, intention to recommend, customer retention.

Pricing Right Data Kpi Dashboard Powerpoint Layout
This is a pricing right data kpi dashboard powerpoint layout. This is a two stage process. The stages in this process are price management, transactional discounting, price waterfall, channel mix, segmentation, product mix, price elasticity, contribution margin, price realization, kpi dashboard, financial statement, pricing, data, pricing right.
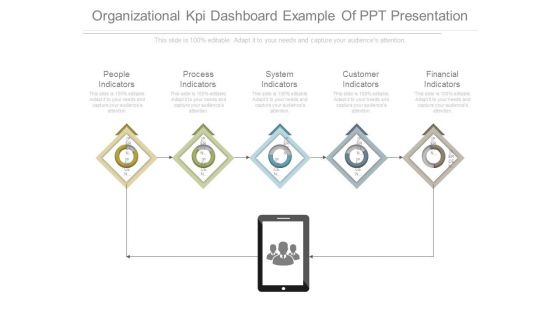
Organizational Kpi Dashboard Example Of Ppt Presentation
This is a organizational kpi dashboard example of ppt presentation. This is a five stage process. The stages in this process are people indicators, process indicators, system indicators, customer indicators, financial indicators.
Sales Kpi Tracker Ppt PowerPoint Presentation Layout
This is a sales kpi tracker ppt powerpoint presentation layout. This is a six stage process. The stages in this process are leads created, sales ratio, opportunities won, top products in revenue, actual.

Customer Service Kpi Diagram Powerpoint Slide Design
This is a customer service kpi diagram powerpoint slide design. This is a three stage process. The stages in this process are information desk, valet damage claims, gift shop sales.

Business Kpi Dashboard Metrics Ppt Sample File
This is a business kpi dashboard metrics ppt sample file. This is a five stage process. The stages in this process are business, finance, management, success, marketing, presentation.

Kpi Dashboard Ppt Presentation Background Images
This is a kpi dashboard ppt presentation background images. This is a three stage process. The stages in this process are revenue, labor cost, customer satisfaction.
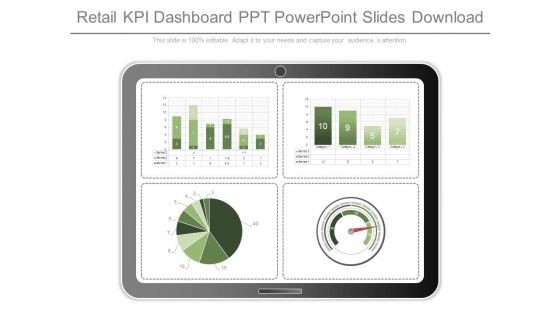
Retail Kpi Dashboard Ppt Powerpoint Slides Download
This is a retail kpi dashboard ppt powerpoint slides download. This is a four stage process. The stages in this process are business, marketing, measure, process, finance.

Sales Kpi Target Powerpoint Slide Background Picture
This is a sales kpi target powerpoint slide background picture. This is a four stage process. The stages in this process are business, management, marketing, finance, strategy.
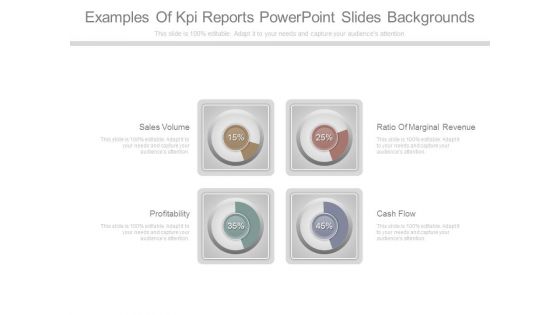
Examples Of Kpi Reports Powerpoint Slides Backgrounds
This is a examples of kpi reports powerpoint slides backgrounds. This is a four stage process. The stages in this process are sales volume, profitability, ratio of marginal revenue, cash flow.

Kpi Dashboard Ppt Powerpoint Slide Design Templates
This is a kpi dashboard ppt powerpoint slide design templates. This is a four stage process. The stages in this process are sales, new customer, budget, resource and task.
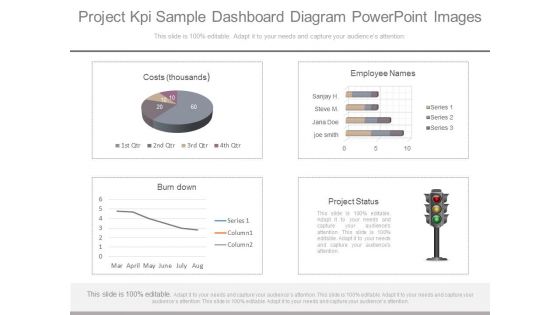
Project Kpi Sample Dashboard Diagram Powerpoint Images
This is a project kpi sample dashboard diagram powerpoint images. This is a four stage process. The stages in this process are costs thousands, employee names, burndown, project status.

Business Kpi Dashboard Diagram Powerpoint Templates
This is a business kpi dashboard diagram powerpoint templates. This is a six stage process. The stages in this process are analytics, cost per sales, reporting, kpis, dashboard, visualization.

 Home
Home