Financial Kpi
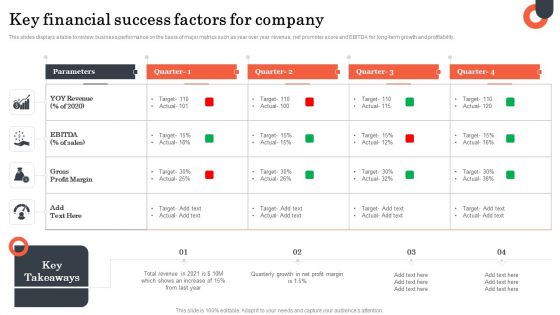
Key Financial Success Factors For Company Designs PDF
This slides displays a table to review business performance on the basis of major metrics such as year over year revenue, net promoter score and EBITDA for long-term growth and profitability. Pitch your topic with ease and precision using this Key Financial Success Factors For Company Designs PDF. This layout presents information on Key Financial Success, Factors For Company. It is also available for immediate download and adjustment. So, changes can be made in the color, design, graphics or any other component to create a unique layout.
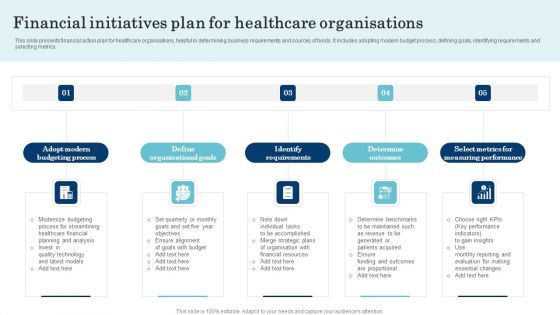
Financial Initiatives Plan For Healthcare Organisations Summary PDF
This slide presents financial action plan for healthcare organisations, helpful in determining business requirements and sources of funds. It includes adopting modern budget process, defining goals, identifying requirements and selecting metrics. Presenting Financial Initiatives Plan For Healthcare Organisations Summary PDF to dispense important information. This template comprises five stages. It also presents valuable insights into the topics including Adopt Modern Budgeting Process, Define Organisational Goals, Identify Requirements. This is a completely customizable PowerPoint theme that can be put to use immediately. So, download it and address the topic impactfully.
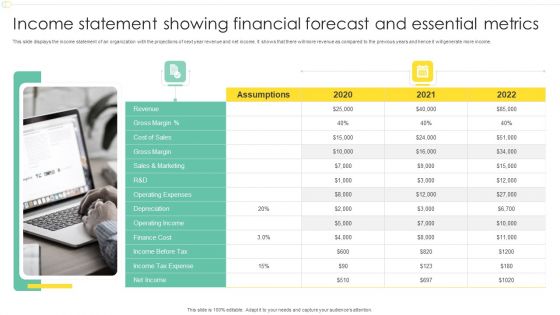
Income Statement Showing Financial Forecast And Essential Metrics Structure PDF
This slide displays the income statement of an organization with the projections of next year revenue and net income. It shows that there will more revenue as compared to the previous years and hence it will generate more income. Presenting Income Statement Showing Financial Forecast And Essential Metrics Structure PDF to dispense important information. This template comprises two stages. It also presents valuable insights into the topics including Revenue, Operating Expenses, Operating Income. This is a completely customizable PowerPoint theme that can be put to use immediately. So, download it and address the topic impactfully.
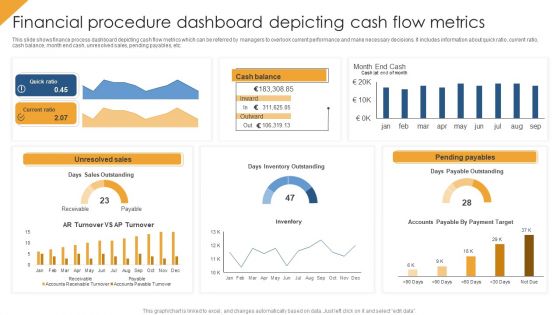
Financial Procedure Dashboard Depicting Cash Flow Metrics Structure PDF
This slide shows finance process dashboard depicting cash flow metrics which can be referred by managers to overlook current performance and make necessary decisions. It includes information about quick ratio, current ratio, cash balance, month end cash, unresolved sales, pending payables, etc. Pitch your topic with ease and precision using this Financial Procedure Dashboard Depicting Cash Flow Metrics Structure PDF. This layout presents information on Quick Ratio, Unresolved Sales, Pending Payables. It is also available for immediate download and adjustment. So, changes can be made in the color, design, graphics or any other component to create a unique layout.

Examine Positive Impact On Warehouse Financial Performance Pictures PDF
This slide analyzes the performance of warehouse financial metrics after the successful optimization of multiple dimensions of warehouse. It includes information about labor costs, inventory carrying costs, and order fulfillment rates. Slidegeeks is one of the best resources for PowerPoint templates. You can download easily and regulate Examine Positive Impact On Warehouse Financial Performance Pictures PDF for your personal presentations from our wonderful collection. A few clicks is all it takes to discover and get the most relevant and appropriate templates. Use our Templates to add a unique zing and appeal to your presentation and meetings. All the slides are easy to edit and you can use them even for advertisement purposes.
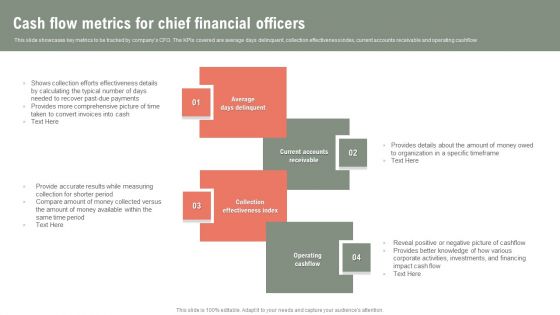
Cash Flow Metrics For Chief Financial Officers Ppt Sample PDF
This slide showcases key metrics to be tracked by companys CFO. The KPIs covered are average days delinquent, collection effectiveness index, current accounts receivable and operating cashflow. Presenting Cash Flow Metrics For Chief Financial Officers Ppt Sample PDF to dispense important information. This template comprises four stages. It also presents valuable insights into the topics including Average Days Delinquent, Current Accounts Receivable, Collection Effectiveness Index. This is a completely customizable PowerPoint theme that can be put to use immediately. So, download it and address the topic impactfully.

Financial PAR Goal 1 Performance Evaluation Ppt Professional Portfolio PDF
Deliver an awe inspiring pitch with this creative financial par goal 1 performance evaluation ppt professional portfolio pdf bundle. Topics like key metrics, headcount by geography, total employees, employees turnover rate can be discussed with this completely editable template. It is available for immediate download depending on the needs and requirements of the user.

Post Implementation Other Operation And Financial Kpis Summary PDF
The slide provides five years graphs 2022F to 2026F forecasted number of major KPIs key performance indicators, that might help to track the performance of ABC Railway. Covered KPIs include Revenue, Total Passengers, operating income, customer satisfaction rate etc.Deliver and pitch your topic in the best possible manner with this post implementation other operation and financial KPIs summary pdf. Use them to share invaluable insights on total passengers, operating income, revenue, 2022 to 2026 and impress your audience. This template can be altered and modified as per your expectations. So, grab it now.
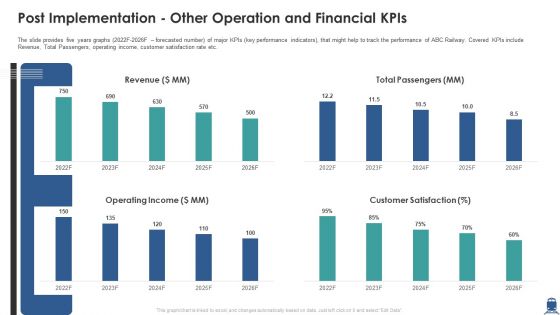
Post Implementation Other Operation And Financial Kpis Inspiration PDF
The slide provides five years graphs 2022F-2026F forecasted number of major KPIs key performance indicators, that might help to track the performance of ABC Railway. Covered KPIs include Revenue, Total Passengers, operating income, customer satisfaction rate etc. Deliver and pitch your topic in the best possible manner with this post implementation other operation and financial kpis inspiration pdf. Use them to share invaluable insights on revenue, operating income, customer satisfaction and impress your audience. This template can be altered and modified as per your expectations. So, grab it now.

Comprehensive Guide For Website Evaluate Business Current Financial Performance
Mentioned slide demonstrates business current performance over the years. It includes key performance metrics such as business revenue, operating profit, and net profit. This Comprehensive Guide For Website Evaluate Business Current Financial Performance from Slidegeeks makes it easy to present information on your topic with precision. It provides customization options, so you can make changes to the colors, design, graphics, or any other component to create a unique layout. It is also available for immediate download, so you can begin using it right away. Slidegeeks has done good research to ensure that you have everything you need to make your presentation stand out. Make a name out there for a brilliant performance.
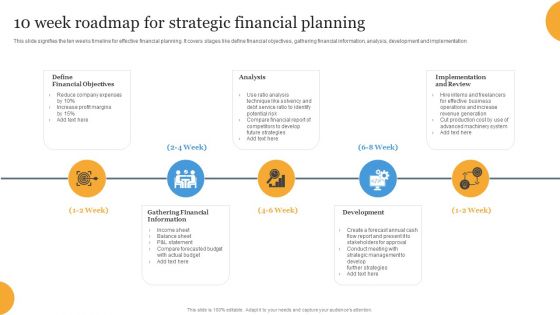
10 Week Roadmap For Strategic Financial Planning Background PDF
This slide signifies the eight week strategic timeline for email advertisement campaign. It covers steps like determine campaign target, choose platform, build list, segmentation, create campaign, automation, tracking and upgrading trends Presenting 10 Week Roadmap For Strategic Financial Planning Background PDF to dispense important information. This template comprises eight stages. It also presents valuable insights into the topics including Campaign Target, Email Campaigns, Analyze Metrics. This is a completely customizable PowerPoint theme that can be put to use immediately. So, download it and address the topic impactfully.
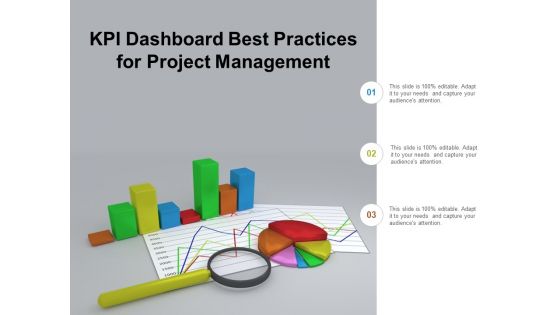
Kpi Dashboard Best Practices For Project Management Ppt Powerpoint Presentation Outline Samples
This is a kpi dashboard best practices for project management ppt powerpoint presentation outline samples. This is a three stage process. The stages in this process are business metrics, business kpi, business dashboard.

Retail Kpi Dashboard Showing Revenue Vs Units Sold Ppt PowerPoint Presentation File Formats
This is a retail kpi dashboard showing revenue vs units sold ppt powerpoint presentation file formats. This is a three stage process. The stages in this process are finance, marketing, management, investment, analysis.

Information Technology Functions Management Infrastructure KPI Metrics Showing Square Meter Area Summary PDF
Presenting information technology functions management infrastructure kpi metrics showing square meter area summary pdf to provide visual cues and insights. Share and navigate important information on three stages that need your due attention. This template can be used to pitch topics like square meter price, actual construction time, no activities starting time. In addition, this PPT design contains high-resolution images, graphics, etc, that are easily editable and available for immediate download.

Retail KPI Metrics Showing Average Purchase Value And Online Sales Template PDF
This is a retail kpi metrics showing average purchase value and online sales template pdf. template with various stages. Focus and dispense information on four stages using this creative set, that comes with editable features. It contains large content boxes to add your information on topics like sales per square foot, average purchase, value customers satisfied, online sales. You can also showcase facts, figures, and other relevant content using this PPT layout. Grab it now.
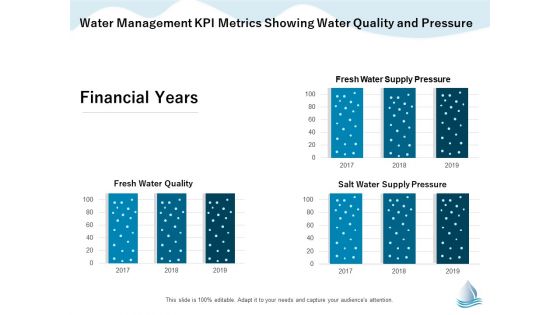
Underground Aquifer Supervision Water Management Kpi Metrics Showing Water Quality Introduction PDF
Presenting this set of slides with name underground aquifer supervision water management kpi metrics showing water quality introduction pdf. The topics discussed in these slides are supply, quality, financial years. This is a completely editable PowerPoint presentation and is available for immediate download. Download now and impress your audience.
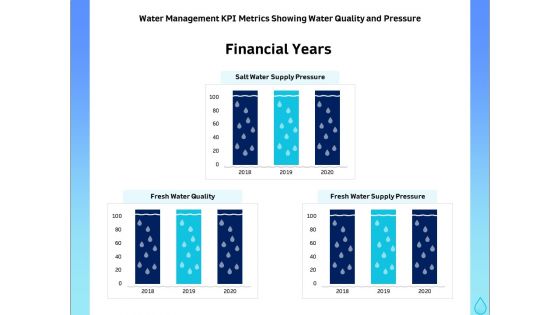
Integrated Water Resource Management Water Management KPI Metrics Showing Water Quality And Pressure Portrait PDF
Presenting this set of slides with name integrated water resource management water management kpi metrics showing water quality and pressure portrait pdf. The topics discussed in these slides are financial years, fresh water quality, fresh water supply pressure, salt water supply pressure, 2018 to 2020. This is a completely editable PowerPoint presentation and is available for immediate download. Download now and impress your audience.
All About HRM Human Resources KPI Dashboard Sales Ppt Icon Deck PDF
Presenting this set of slides with name all about hrm human resources kpi dashboard sales ppt icon deck pdf. The topics discussed in these slides are manufacturing department, sales department, engineering department, financial department. This is a completely editable PowerPoint presentation and is available for immediate download. Download now and impress your audience.
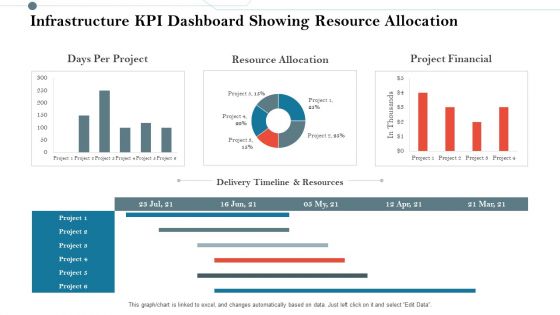
Construction Management Services And Action Plan Infrastructure KPI Dashboard Showing Resource Allocation Ideas PDF
Deliver an awe inspiring pitch with this creative construction management services and action plan infrastructure kpi dashboard showing resource allocation ideas pdf bundle. Topics like days per project, resource allocation, project financial can be discussed with this completely editable template. It is available for immediate download depending on the needs and requirements of the user.
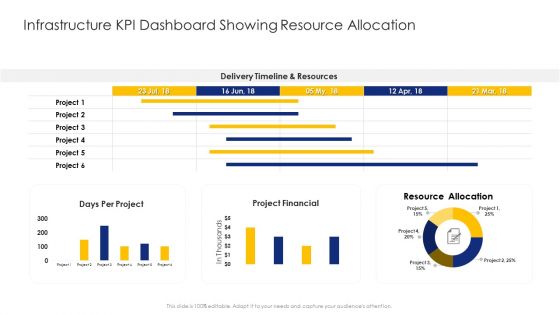
Construction Engineering And Industrial Facility Management Infrastructure KPI Dashboard Showing Resource Allocation Sample PDF
Deliver an awe-inspiring pitch with this creative construction engineering and industrial facility management infrastructure kpi dashboard showing resource allocation sample pdf bundle. Topics like delivery timeline and resources, resource allocation, project financial can be discussed with this completely editable template. It is available for immediate download depending on the needs and requirements of the user.
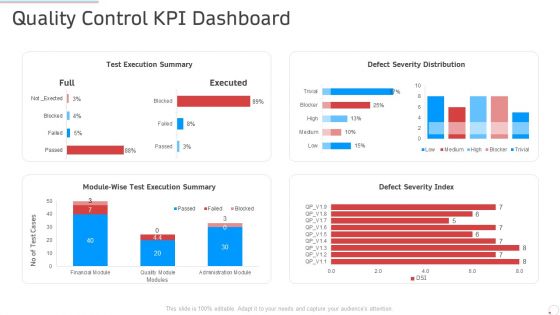
Quality Control Kpi Dashboard Manufacturing Control Ppt Infographics Master Slide PDF
Deliver an awe inspiring pitch with this creative quality control kpi dashboard manufacturing control ppt infographics master slide pdf bundle. Topics like execution, severity, financial can be discussed with this completely editable template. It is available for immediate download depending on the needs and requirements of the user.
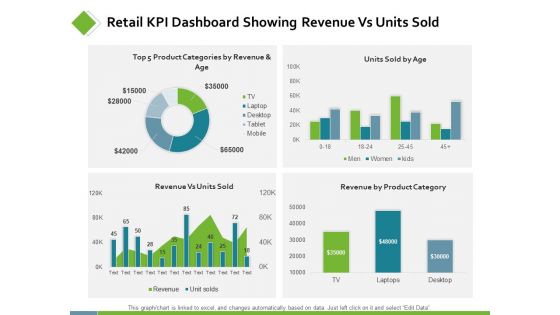
Retail KPI Dashboard Showing Revenue Vs Units Sold Ppt PowerPoint Presentation Professional Smartart
This is a retail kpi dashboard showing revenue vs units sold ppt powerpoint presentation professional smartart. This is a four stage process. The stages in this process are finance, analysis, business, investment, marketing.

Retail KPI Dashboard Showing Sales Revenue Customers Ppt PowerPoint Presentation Show Background Designs
This is a retail kpi dashboard showing sales revenue customers ppt powerpoint presentation show background designs. This is a six stage process. The stages in this process are finance, analysis, business, investment, marketing.
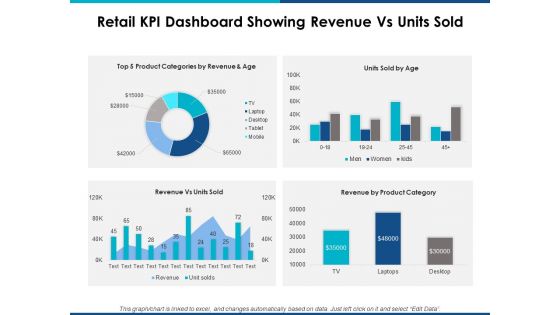
Retail Kpi Dashboard Showing Revenue Vs Units Sold Ppt Powerpoint Presentation Layouts Show
This is a retail kpi dashboard showing revenue vs units sold ppt powerpoint presentation layouts show. This is a four stage process. The stages in this process are finance, marketing, management, investment, analysis.

Digitalization Corporate Initiative Ecommerce Management KPI Metrics Average Ppt Styles Slide Portrait Pdf
digitalization corporate initiative ecommerce management kpi metrics average ppt styles slide portrait pdf template with various stages. Focus and dispense information on five stages using this creative set, that comes with editable features. It contains large content boxes to add your information on topics like ecommerce management kpi metrics. You can also showcase facts, figures, and other relevant content using this PPT layout. Grab it now.
Talent Management Systems KPI Metrics And Dashboard Ppt File Vector PDF
This is a talent management systems kpi metrics and dashboard ppt file vector pdf template with various stages. Focus and dispense information on one stage using this creative set, that comes with editable features. It contains large content boxes to add your information on topics like kpi metrics and dashboard. You can also showcase facts, figures, and other relevant content using this PPT layout. Grab it now.
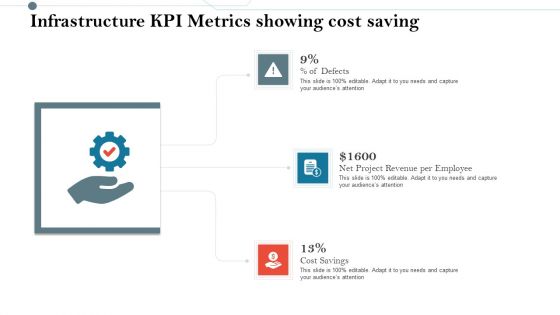
Construction Management Services And Action Plan Infrastructure KPI Metrics Showing Cost Saving Pictures PDF
Presenting construction management services and action plan infrastructure kpi metrics showing cost saving pictures pdf to provide visual cues and insights. Share and navigate important information on three stages that need your due attention. This template can be used to pitch topics like infrastructure kpi metrics showing cost saving. In addtion, this PPT design contains high resolution images, graphics, etc, that are easily editable and available for immediate download.
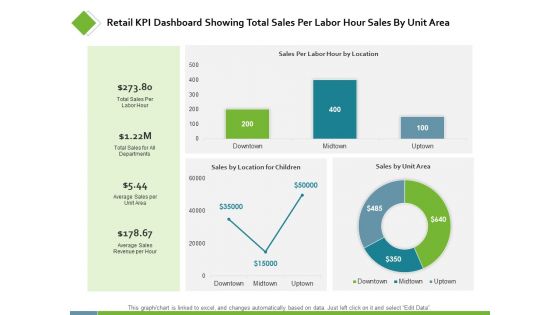
Retail KPI Dashboard Showing Total Sales Per Labor Ppt PowerPoint Presentation Styles Examples
This is a retail kpi dashboard showing total sales per labor ppt powerpoint presentation styles examples. This is a three stage process. The stages in this process are finance, analysis, business, investment, marketing.
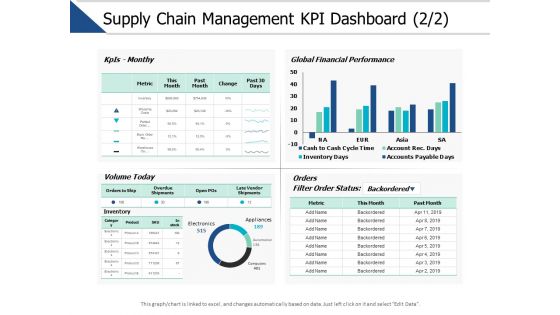
Supply Chain Management Kpi Dashboard Marketing Ppt PowerPoint Presentation File Tips
This is a supply chain management kpi dashboard marketing ppt powerpoint presentation file tips. This is a three stage process. The stages in this process are finance, marketing, management, investment, analysis.
Service Level Agreement KPI Dashboard With Graph And Analytics Icon Inspiration PDF
Persuade your audience using this Service Level Agreement KPI Dashboard With Graph And Analytics Icon Inspiration PDF. This PPT design covers three stages, thus making it a great tool to use. It also caters to a variety of topics including Service Level, Agreement KPI Dashboard, Graph And Analytics, Icon. Download this PPT design now to present a convincing pitch that not only emphasizes the topic but also showcases your presentation skills.
Vendor Performance KPI Analytical Dashboard Icon For Data Management Background PDF
Persuade your audience using this Vendor Performance KPI Analytical Dashboard Icon For Data Management Background PDF. This PPT design covers three stages, thus making it a great tool to use. It also caters to a variety of topics including Vendor Performance, KPI Analytical Dashboard, Icon Data Management. Download this PPT design now to present a convincing pitch that not only emphasizes the topic but also showcases your presentation skills.

Managing Agriculture Land And Water Water Management KPI Metrics Showing Water Quality And Pressure Themes PDF
Presenting this set of slides with name managing agriculture land and water water management kpi metrics showing water quality and pressure themes pdf. The topics discussed in these slides are financial years, fresh water quality, fresh water supply pressure, salt water supply pressure, 2018 to 2020. This is a completely editable PowerPoint presentation and is available for immediate download. Download now and impress your audience.

Building Innovation Capabilities And USP Detection Marketing KPI And Dashboard Ppt Infographic Template Pictures PDF
Show your sale and financial highlights of through our dashboard. Deliver an awe-inspiring pitch with this creative building innovation capabilities and usp detection marketing kpi and dashboard ppt infographic template pictures pdf bundle. Topics like revenue per acquisition, per acquisition, marketing spend, total revenu, leads, acquisitions, profit, return on investment can be discussed with this completely editable template. It is available for immediate download depending on the needs and requirements of the user.

Agenda For Sustainability Calculation With KPI Ppt PowerPoint Presentation Gallery Designs PDF
This is a agenda for sustainability calculation with kpi ppt powerpoint presentation gallery designs pdf template with various stages. Focus and dispense information on three stages using this creative set, that comes with editable features. It contains large content boxes to add your information on topics like financial profitability, employee performance, customer satisfaction. You can also showcase facts, figures, and other relevant content using this PPT layout. Grab it now.
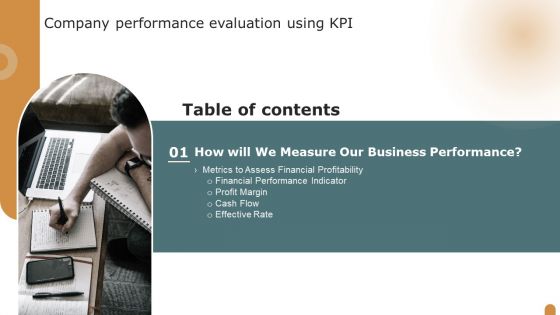
G9 Table Of Contents Company Performance Evaluation Using KPI Elements PDF
This is a G9 Table Of Contents Company Performance Evaluation Using KPI Elements PDF template with various stages. Focus and dispense information on one stage using this creative set, that comes with editable features. It contains large content boxes to add your information on topics like Business Performance, Financial Profitability, Company Performance. You can also showcase facts, figures, and other relevant content using this PPT layout. Grab it now.

Firm Productivity Administration Business Intelligence KPI Metrics SEO Ppt PowerPoint Presentation File Visual Aids PDF
Presenting this set of slides with name firm productivity administration business intelligence kpi metrics seo ppt powerpoint presentation file visual aids pdf. This is a four stage process. The stages in this process are seo traffic weekly, trip distance, usa clients, ytd revenue millions. This is a completely editable PowerPoint presentation and is available for immediate download. Download now and impress your audience.

Construction Production Facilities Infrastructure KPI Metrics Showing Cost Saving Background PDF
Presenting this set of slides with name construction production facilities infrastructure kpi metrics showing cost saving background pdf. This is a three stage process. The stages in this process are net project revenue per employee, cost savings, defects. This is a completely editable PowerPoint presentation and is available for immediate download. Download now and impress your audience.

Firm Productivity Administration Business Intelligence KPI Metrics Average Ppt PowerPoint Presentation Infographics Guidelines PDF
Presenting this set of slides with name firm productivity administration business intelligence kpi metrics average ppt powerpoint presentation infographics guidelines pdf. This is a four stage process. The stages in this process are average purchase value, average lifetime value, average unit price, category id max. This is a completely editable PowerPoint presentation and is available for immediate download. Download now and impress your audience.
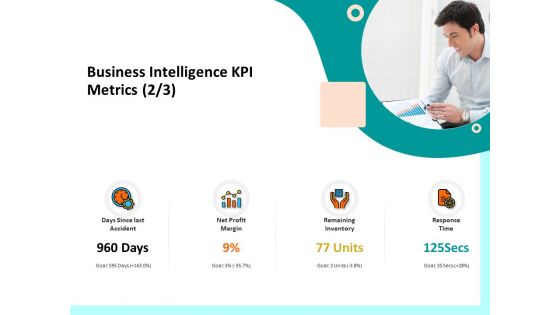
Firm Productivity Administration Business Intelligence KPI Metrics Inventory Ppt PowerPoint Presentation Inspiration Guide PDF
Presenting this set of slides with name firm productivity administration business intelligence kpi metrics inventory ppt powerpoint presentation inspiration guide pdf. This is a four stage process. The stages in this process are days since last accident, net profit margin, remaining inventory, response time. This is a completely editable PowerPoint presentation and is available for immediate download. Download now and impress your audience.

Healthcare Management KPI Metrics Showing Treatment Cost And Waiting Time Ppt PowerPoint Presentation Ideas Files
Presenting this set of slides with name healthcare management kpi metrics showing treatment cost and waiting time ppt powerpoint presentation ideas files. This is a three stage process. The stages in this process are business, management, planning, strategy, marketing. This is a completely editable PowerPoint presentation and is available for immediate download. Download now and impress your audience.
Healthcare Management KPI Metrics Showing Incidents Length Of Stay Ppt PowerPoint Presentation Icon Background
Presenting this set of slides with name healthcare management kpi metrics showing incidents length of stay ppt powerpoint presentation icon background. This is a four stage process. The stages in this process are incidents, average waiting time, overall patient satisfaction, management, marketing. This is a completely editable PowerPoint presentation and is available for immediate download. Download now and impress your audience.
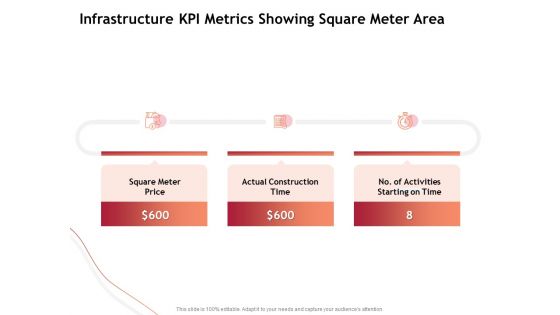
Performance Measuement Of Infrastructure Project Infrastructure KPI Metrics Showing Square Meter Area Download PDF
Presenting this set of slides with name performance measuement of infrastructure project infrastructure kpi metrics showing square meter area download pdf. This is a three stage process. The stages in this process are square meter price, actual construction time, number of activities starting on time. This is a completely editable PowerPoint presentation and is available for immediate download. Download now and impress your audience.

Introducing CRM Framework Within Organization Customer Relationship Management KPI Metrics Orders Background PDF
Presenting this set of slides with name introducing crm framework within organization customer relationship management kpi metrics orders background pdf. This is a four stage process. The stages in this process are customer, feedback form, total orders, mails 30 days. This is a completely editable PowerPoint presentation and is available for immediate download. Download now and impress your audience.

Executive Leadership Programs Leadership Management KPI Metrics Ppt PowerPoint Presentation Infographics Format Ideas PDF
Presenting this set of slides with name executive leadership programs leadership management kpi metrics ppt powerpoint presentation infographics format ideas pdf. This is a three stage process. The stages in this process are managerial quality index, current initiatives driven it, staff team excess sick leave. This is a completely editable PowerPoint presentation and is available for immediate download. Download now and impress your audience.
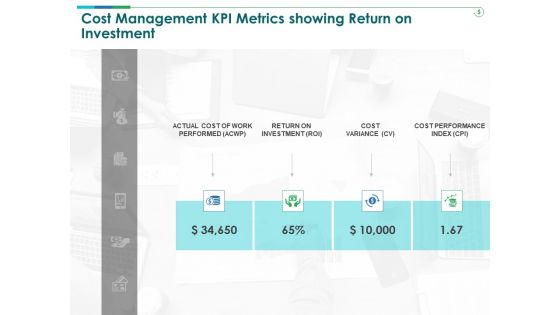
TCM Cost Management KPI Metrics Showing Return On Investment Ppt Professional Graphics PDF
Presenting this set of slides with name tcm cost management kpi metrics showing return on investment ppt professional graphics pdf. This is a four stage process. The stages in this process are performed, cost, investment, variance, return. This is a completely editable PowerPoint presentation and is available for immediate download. Download now and impress your audience.

Facts Assessment Business Intelligence KPI Dashboard Processing Ppt PowerPoint Presentation Summary Graphics Template PDF
Presenting this set of slides with name facts assessment business intelligence kpi dashboard processing ppt powerpoint presentation summary graphics template pdf. This is a one stage process. The stages in this process are brand awareness, web traffic, social media, grp, mind, processing. This is a completely editable PowerPoint presentation and is available for immediate download. Download now and impress your audience.

Firm Productivity Administration Business Intelligence KPI Dashboard Mind Ppt PowerPoint Presentation Outline Graphics PDF
Presenting this set of slides with name firm productivity administration business intelligence kpi dashboard mind ppt powerpoint presentation outline graphics pdf. This is a four stage process. The stages in this process are social media, web traffic, grp, brand awareness, mind, processing. This is a completely editable PowerPoint presentation and is available for immediate download. Download now and impress your audience.

Business Activities Assessment Examples Infrastructure KPI Metrics Showing Cost Saving Infographics PDF
Presenting business activities assessment examples infrastructure kpi metrics showing cost saving infographics pdf to provide visual cues and insights. Share and navigate important information on three stages that need your due attention. This template can be used to pitch topics like net project revenue per employee, cost savings . In addtion, this PPT design contains high resolution images, graphics, etc, that are easily editable and available for immediate download.

IT And Cloud Facilities Management Infrastructure KPI Metrics Showing Cost Saving Information PDF
This is a it and cloud facilities management infrastructure kpi metrics showing cost saving information pdf template with various stages. Focus and dispense information on three stages using this creative set, that comes with editable features. It contains large content boxes to add your information on topics like defects, net project revenue per employee, cost savings. You can also showcase facts, figures, and other relevant content using this PPT layout. Grab it now.

IT Infrastructure Governance Infrastructure KPI Metrics Showing Cost Saving Ppt Infographic Template Graphic Images PDF
This is a it infrastructure governance infrastructure kpi metrics showing cost saving ppt infographic template graphic images pdf. template with various stages. Focus and dispense information on three stages using this creative set, that comes with editable features. It contains large content boxes to add your information on topics like defects, net project revenue per employee, cost savings. You can also showcase facts, figures, and other relevant content using this PPT layout. Grab it now
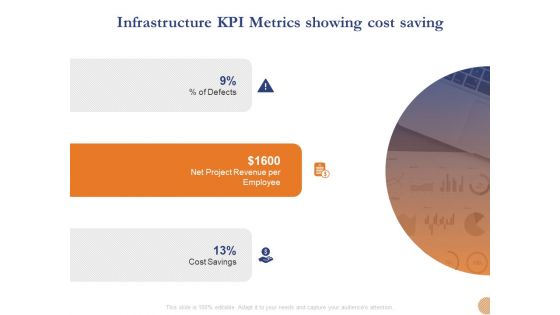
Substructure Segment Analysis Infrastructure KPI Metrics Showing Cost Saving Ppt Ideas Background Designs PDF
Presenting substructure segment analysis infrastructure kpi metrics showing cost saving ppt ideas background designs pdf to provide visual cues and insights. Share and navigate important information on three stages that need your due attention. This template can be used to pitch topics like cost savings, net project revenue per employee, defects. In addition, this PPT design contains high-resolution images, graphics, etc, that are easily editable and available for immediate download.
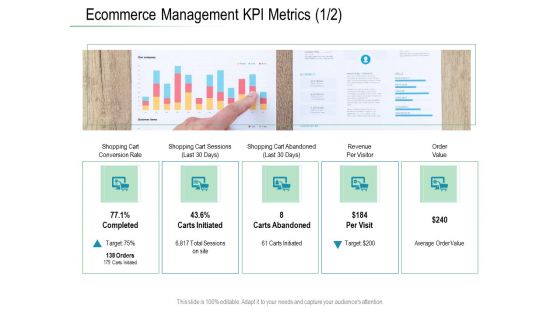
Online Distribution Services Ecommerce Management KPI Metrics Visitor Ppt Gallery Skills PDF
Presenting online distribution services ecommerce management kpi metrics visitor ppt gallery skills pdf to provide visual cues and insights. Share and navigate important information on five stages that need your due attention. This template can be used to pitch topics like conversion rate, revenue, value, target. In addtion, this PPT design contains high resolution images, graphics, etc, that are easily editable and available for immediate download.
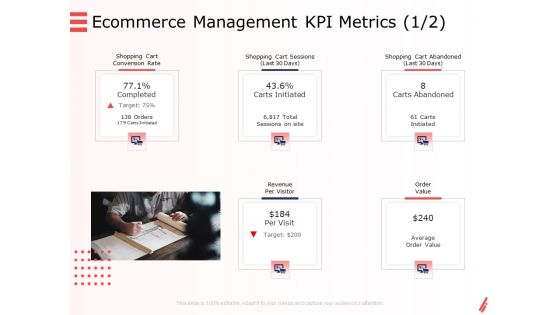
Digital Products And Services Ecommerce Management KPI Metrics Management Ppt Slides Gridlines PDF
Presenting digital products and services ecommerce management kpi metrics management ppt slides gridlines pdf to provide visual cues and insights. Share and navigate important information on five stages that need your due attention. This template can be used to pitch topics like conversion rate, revenue, value, target. In addtion, this PPT design contains high resolution images, graphics, etc, that are easily editable and available for immediate download.
Facility Management Infrastructure KPI Metrics Showing Cost Saving Ppt Icon Skills PDF
This is a facility management infrastructure kpi metrics showing cost saving ppt icon skills pdf template with various stages. Focus and dispense information on three stages using this creative set, that comes with editable features. It contains large content boxes to add your information on topics like percent of defects, net project revenue per employee, cost savings. You can also showcase facts, figures, and other relevant content using this PPT layout. Grab it now.

Infrastructure Strategies Infrastructure KPI Metrics Showing Cost Saving Ppt Ideas Maker PDF
This is a infrastructure strategies infrastructure kpi metrics showing cost saving ppt ideas maker pdf template with various stages. Focus and dispense information on three stages using this creative set, that comes with editable features. It contains large content boxes to add your information on topics like percent of defects, net project revenue per employee, cost savings. You can also showcase facts, figures, and other relevant content using this PPT layout. Grab it now.

IT Infrastructure Administration Infrastructure KPI Metrics Showing Cost Saving Graphics PDF
This is a it infrastructure administration infrastructure kpi metrics showing cost saving graphics pdf template with various stages. Focus and dispense information on three stages using this creative set, that comes with editable features. It contains large content boxes to add your information on topics like percent of defects, net project revenue per employee, cost savings. You can also showcase facts, figures, and other relevant content using this PPT layout. Grab it now.

Information Technology Functions Management Infrastructure KPI Metrics Showing Cost Saving Ppt File Topics PDF
This is a information technology functions management infrastructure kpi metrics showing cost saving ppt file topics pdf template with various stages. Focus and dispense information on three stages using this creative set, that comes with editable features. It contains large content boxes to add your information on topics like percent defects, net project revenue per employee, cost savings. You can also showcase facts, figures, and other relevant content using this PPT layout. Grab it now.

Utilizing Infrastructure Management Using Latest Methods Infrastructure KPI Metrics Showing Cost Saving Background PDF
This is a utilizing infrastructure management using latest methods infrastructure kpi metrics showing cost saving background pdf template with various stages. Focus and dispense information on three stages using this creative set, that comes with editable features. It contains large content boxes to add your information on topics like percent defects, net project revenue per employee, cost savings. You can also showcase facts, figures, and other relevant content using this PPT layout. Grab it now.
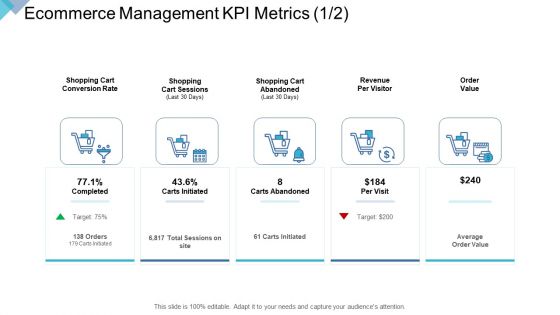
Digital Enterprise Management Ecommerce Management KPI Metrics Ppt PowerPoint Presentation Layout PDF
Presenting digital enterprise management ecommerce management kpi metrics ppt powerpoint presentation layout pdf to provide visual cues and insights. Share and navigate important information on five stages that need your due attention. This template can be used to pitch topics like shopping cart conversion rate, shopping cart sessions, shopping cart abandoned, revenue per visitor, order value. In addition, this PPT design contains high-resolution images, graphics, etc, that are easily editable and available for immediate download.

Infrastructure Designing And Administration Infrastructure KPI Metrics Showing Cost Saving Download PDF
This is a infrastructure designing and administration infrastructure kpi metrics showing cost saving download pdf template with various stages. Focus and dispense information on three stages using this creative set, that comes with editable features. It contains large content boxes to add your information on topics like percent of defects, net project revenue per employee, cost savings. You can also showcase facts, figures, and other relevant content using this PPT layout. Grab it now.

 Home
Home