Financial Kpi

Social Media Metrics Ppt PowerPoint Presentation Styles Topics
This is a social media metrics ppt powerpoint presentation styles topics. This is a eight stage process. The stages in this process are fans count, followers, subscribers, engagement rate, mentions, video views, likes.

Banking Performance Metrics Ppt PowerPoint Presentation Professional Good Cpb Pdf
Presenting this set of slides with name banking performance metrics ppt powerpoint presentation professional good cpb pdf. This is an editable Powerpoint six stages graphic that deals with topics like banking performance metrics to help convey your message better graphically. This product is a premium product available for immediate download and is 100 percent editable in Powerpoint. Download this now and use it in your presentations to impress your audience.
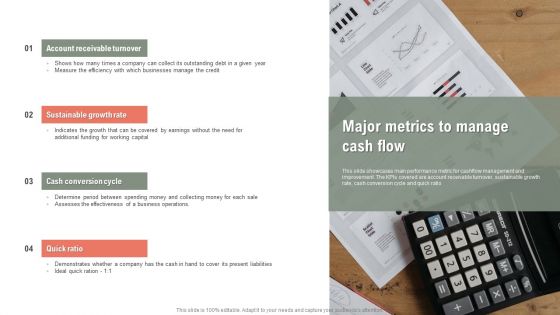
Major Metrics To Manage Cash Flow Ppt Infographics Portfolio PDF
This slide showcases main performance metric for cashflow management and improvement. The KPIs covered are account receivable turnover, sustainable growth rate, cash conversion cycle and quick ratio. Presenting Major Metrics To Manage Cash Flow Ppt Infographics Portfolio PDF to dispense important information. This template comprises four stages. It also presents valuable insights into the topics including Account Receivable Turnover, Sustainable Growth Rate, Cash Conversion Cycle. This is a completely customizable PowerPoint theme that can be put to use immediately. So, download it and address the topic impactfully.
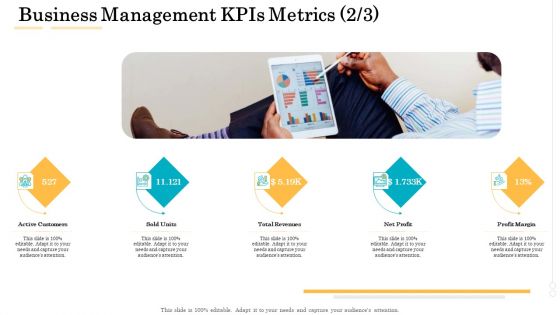
Administrative Regulation Business Management KPIs Metrics Profit Ppt PowerPoint Presentation Portfolio Brochure PDF
This is a administrative regulation business management kpis metrics profit ppt powerpoint presentation portfolio brochure pdf template with various stages. Focus and dispense information on five stages using this creative set, that comes with editable features. It contains large content boxes to add your information on topics like active customers, sold units, total revenues, net profit, profit margin. You can also showcase facts, figures, and other relevant content using this PPT layout. Grab it now.

Administrative Regulation Business Management KPIs Metrics Ppt PowerPoint Presentation Slides Shapes PDF
This is a administrative regulation business management kpis metrics ppt powerpoint presentation slides shapes pdf template with various stages. Focus and dispense information on six stages using this creative set, that comes with editable features. It contains large content boxes to add your information on topics like budgeted income, received income, accounts receivable, budgeted expenses, paid expenses, accounts payable. You can also showcase facts, figures, and other relevant content using this PPT layout. Grab it now.
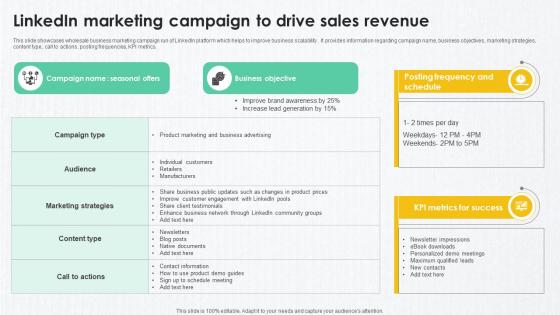
B2B Marketing Techniques Linkedin Marketing Campaign To Drive Sales Revenue
This slide showcases wholesale business marketing campaign run of LinkedIn platform which helps to improve business scalability . It provides information regarding campaign name, business objectives, marketing strategies, content type, call to actions, posting frequencies, KPI metrics. Whether you have daily or monthly meetings, a brilliant presentation is necessary. B2B Marketing Techniques Linkedin Marketing Campaign To Drive Sales Revenue can be your best option for delivering a presentation. Represent everything in detail using B2B Marketing Techniques Linkedin Marketing Campaign To Drive Sales Revenue and make yourself stand out in meetings. The template is versatile and follows a structure that will cater to your requirements. All the templates prepared by Slidegeeks are easy to download and edit. Our research experts have taken care of the corporate themes as well. So, give it a try and see the results.

Sales And Business Development Action Plan Marketing Future Action Metrics Ppt Infographics Designs Download PDF
Presenting this set of slides with name sales and business development action plan marketing future action metrics ppt infographics designs download pdf. This is a one stage process. The stages in this process are metrics, current, goal, timeline, brand awareness, conversion rate optimization. This is a completely editable PowerPoint presentation and is available for immediate download. Download now and impress your audience.

Formulating Branding Strategy To Enhance Revenue And Sales Addressing The Process To Develop Brand Designs PDF
The following slide outlines the six step process to develop and strengthen brand communication strategy. Understanding of target audience, selecting the channels, developing customer persona, determining the product USP, crafting the message and establishing key performance indicators KPI are the steps which are mentioned in the slide Crafting an eye catching presentation has never been more straightforward. Let your presentation shine with this tasteful yet straightforward Formulating Branding Strategy To Enhance Revenue And Sales Addressing The Process To Develop Brand Designs PDF template. It offers a minimalistic and classy look that is great for making a statement. The colors have been employed intelligently to add a bit of playfulness while still remaining professional. Construct the ideal Formulating Branding Strategy To Enhance Revenue And Sales Addressing The Process To Develop Brand Designs PDF that effortlessly grabs the attention of your audience. Begin now and be certain to wow your customers.

Various Kpis Included In Performance Sales Report Graphics PDF
The slide covers the key performance indicators of a report to measure product sales. Various KPIs included are conversion rate, referrals and customer lifetime value. Persuade your audience using this Various Kpis Included In Performance Sales Report Graphics PDF. This PPT design covers three stages, thus making it a great tool to use. It also caters to a variety of topics including Conversion Rate, Referrals, Customer Lifetime Value. Download this PPT design now to present a convincing pitch that not only emphasizes the topic but also showcases your presentation skills.
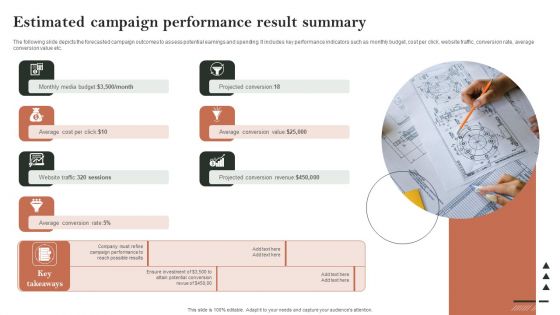
Search Engine Marketing Estimated Campaign Performance Result Summary Designs PDF
The following slide depicts the forecasted campaign outcomes to assess potential earnings and spending. It includes key performance indicators such as monthly budget, cost per click, website traffic, conversion rate, average conversion value etc. Do you know about Slidesgeeks Search Engine Marketing Estimated Campaign Performance Result Summary Designs PDF These are perfect for delivering any kind od presentation. Using it, create PowerPoint presentations that communicate your ideas and engage audiences. Save time and effort by using our pre-designed presentation templates that are perfect for a wide range of topic. Our vast selection of designs covers a range of styles, from creative to business, and are all highly customizable and easy to edit. Download as a PowerPoint template or use them as Google Slides themes.

ATS Administration To Improve Asset Management Dashboard To Track System Guidelines PDF
This slide covers KPI dashboard to track system performance. It involves detail such as total number of assets, value of assets and purchases in fiscal year. Get a simple yet stunning designed ATS Administration To Improve Asset Management Dashboard To Track System Guidelines PDF. It is the best one to establish the tone in your meetings. It is an excellent way to make your presentations highly effective. So, download this PPT today from Slidegeeks and see the positive impacts. Our easy-to-edit ATS Administration To Improve Asset Management Dashboard To Track System Guidelines PDF can be your go-to option for all upcoming conferences and meetings. So, what are you waiting for Grab this template today.
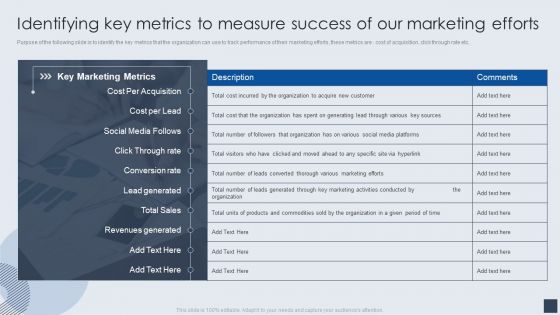
Identifying Key Metrics To Measure Success Of Our Marketing Efforts Download PDF
Purpose of the following slide is to identify the key metrics that the organization can use to track performance of their marketing efforts, these metrics are cost of acquisition, click through rate etc. Presenting Identifying Key Metrics To Measure Success Of Our Marketing Efforts Download PDF to provide visual cues and insights. Share and navigate important information on one stages that need your due attention. This template can be used to pitch topics like Social Media, Cost Per Acquisition, Key Marketing Metrics. In addtion, this PPT design contains high resolution images, graphics, etc, that are easily editable and available for immediate download.
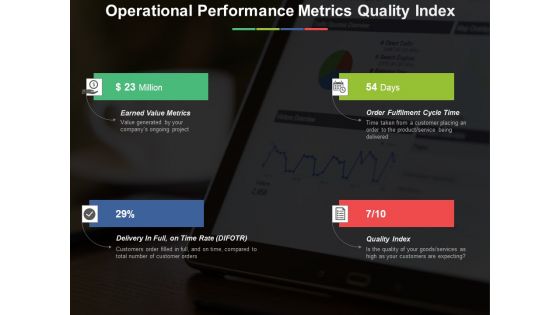
Operational Performance Metrics Quality Index Ppt PowerPoint Presentation Summary Layout Ideas
This is a operational performance metrics quality index ppt powerpoint presentation summary layout ideas. This is a four stage process. The stages in this process are earned value metrics, order fulfilment cycle time, quality index, delivery in full on time rate.

Redis Cache Data Structure IT Performance Memory And Activity Metrics Introduction PDF
This slide depicts performance memory and activity metrics dashboard for Redis cache, including cache hit ratio, slow log, latency, used memory, etc. This is a redis cache data structure it performance memory and activity metrics introduction pdf template with various stages. Focus and dispense information on one stages using this creative set, that comes with editable features. It contains large content boxes to add your information on topics like performance memory and activity metrics dashboard for redis cache. You can also showcase facts, figures, and other relevant content using this PPT layout. Grab it now.

Operational Performance Metrics Customer Support Tickets Ppt PowerPoint Presentation Outline Graphics Design
This is a operational performance metrics customer support tickets ppt powerpoint presentation outline graphics design. This is a four stage process. The stages in this process are customer support tickets, percentage of product defects, lob efficiency measure, process downtime level.
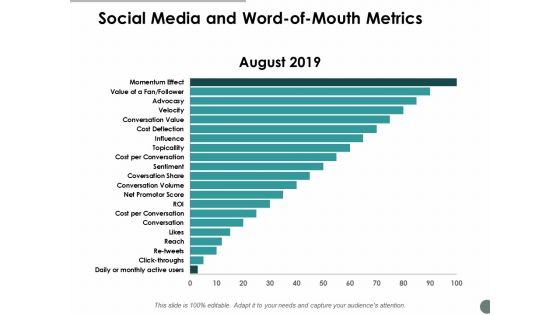
Social Media And Word Of Mouth Metrics Ppt Powerpoint Presentation Show Example Introduction
This is a social media and word of mouth metrics ppt powerpoint presentation show example introduction. This is a two stage process. The stages in this process are finance, marketing, management, investment, analysis.
Metrics To Improve Cash Flow Tracking Icon Ppt Inspiration Outfit PDF
Persuade your audience using this Metrics To Improve Cash Flow Tracking Icon Ppt Inspiration Outfit PDF. This PPT design covers three stages, thus making it a great tool to use. It also caters to a variety of topics including Metrics To Improve, Cash Flow, Tracking Icon. Download this PPT design now to present a convincing pitch that not only emphasizes the topic but also showcases your presentation skills.

Cloud Content Delivery Network Key CDN Metrics To Watch Background PDF
This slide represents the key CDN metrics to watch while looking for a CDN provider, such as the time it takes DNS to reply. Explore a selection of the finest Cloud Content Delivery Network Key CDN Metrics To Watch Background PDF here. With a plethora of professionally designed and pre made slide templates, you can quickly and easily find the right one for your upcoming presentation. You can use our Cloud Content Delivery Network Key CDN Metrics To Watch Background PDF to effectively convey your message to a wider audience. Slidegeeks has done a lot of research before preparing these presentation templates. The content can be personalized and the slides are highly editable. Grab templates today from Slidegeeks.

Collection Of Quality Assurance PPT Data Quality Management Metrics Information PDF
Mentioned slide displays customer data quality management dashboard with metrics namely consistency, accuracy, completeness, auditability, orderliness, uniqueness and timeliness. This is a collection of quality assurance ppt data quality management metrics information pdf template with various stages. Focus and dispense information on eight stages using this creative set, that comes with editable features. It contains large content boxes to add your information on topics like accuracy, auditability, consistency, completeness, uniqueness. You can also showcase facts, figures, and other relevant content using this PPT layout. Grab it now.

Quality Assurance Templates Set 2 Data Quality Management Metrics Pictures PDF
Mentioned slide displays customer data quality management dashboard with metrics namely consistency, accuracy, completeness, auditability, orderliness, uniqueness and timeliness. Presenting quality assurance templates set 2 data quality management metrics pictures pdf to provide visual cues and insights. Share and navigate important information on eight stages that need your due attention. This template can be used to pitch topics like consistency, completeness, orderliness, timelines, accuracy. In addtion, this PPT design contains high resolution images, graphics, etc, that are easily editable and available for immediate download.
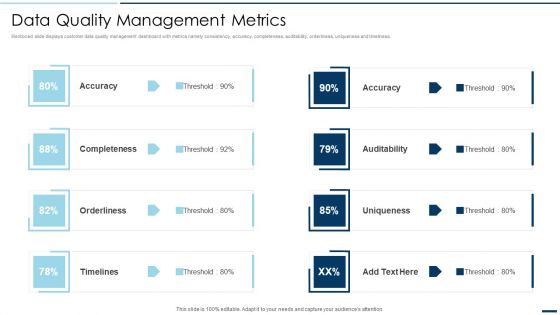
QA Plan Set 2 Data Quality Management Metrics Ppt PowerPoint Presentation Gallery Background Image PDF
Mentioned slide displays customer data quality management dashboard with metrics namely consistency, accuracy, completeness, auditability, orderliness, uniqueness and timeliness. Presenting QA Plan Set 2 Data Quality Management Metrics Ppt PowerPoint Presentation Gallery Background Image PDF to provide visual cues and insights. Share and navigate important information on eight stages that need your due attention. This template can be used to pitch topics like Accuracy Completeness, Orderliness Timelines. In addtion, this PPT design contains high resolution images, graphics, etc, that are easily editable and available for immediate download.

Job Rotation Plan For Staff Metrics To Measure Success Of Job Rotation Programme Diagrams PDF
This slide showcases KPIs that can help organization to measure the success and effectiveness of job rotation programme. It also highlights measurement methods to calculate job rotation programme metrics. Slidegeeks is one of the best resources for PowerPoint templates. You can download easily and regulate Job Rotation Plan For Staff Metrics To Measure Success Of Job Rotation Programme Diagrams PDF for your personal presentations from our wonderful collection. A few clicks is all it takes to discover and get the most relevant and appropriate templates. Use our Templates to add a unique zing and appeal to your presentation and meetings. All the slides are easy to edit and you can use them even for advertisement purposes.
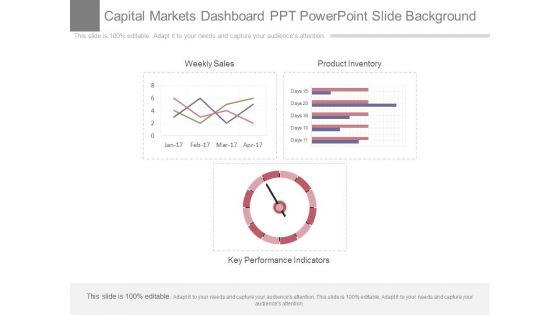
Capital Markets Dashboard Ppt Powerpoint Slide Background
This is a capital markets dashboard ppt powerpoint slide background. This is a three stage process. The stages in this process are weekly sales, product inventory, key performance indicators.
Referral Program Performance Tracking Dashboard Consumer Contact Point Guide Icons PDF
This slide covers the KPI dashboard for analyzing referral campaign results. It includes metrics such as total revenue generated, monthly recurring revenue, new customers, clicks, cancelled customers, paying customers, etc. Are you in need of a template that can accommodate all of your creative concepts This one is crafted professionally and can be altered to fit any style. Use it with Google Slides or PowerPoint. Include striking photographs, symbols, depictions, and other visuals. Fill, move around, or remove text boxes as desired. Test out color palettes and font mixtures. Edit and save your work, or work with colleagues. Download Referral Program Performance Tracking Dashboard Consumer Contact Point Guide Icons PDF and observe how to make your presentation outstanding. Give an impeccable presentation to your group and make your presentation unforgettable.

Commodity Line Expansion Product Line Market Performance Assessment Download PDF
This slide showcases market analysis KPI dashboard for checking performance of product line items. It provides details about product revenue, revenue breakdown, time to market, existing products, etc. Explore a selection of the finest Commodity Line Expansion Product Line Market Performance Assessment Download PDF here. With a plethora of professionally designed and pre-made slide templates, you can quickly and easily find the right one for your upcoming presentation. You can use our Commodity Line Expansion Product Line Market Performance Assessment Download PDF to effectively convey your message to a wider audience. Slidegeeks has done a lot of research before preparing these presentation templates. The content can be personalized and the slides are highly editable. Grab templates today from Slidegeeks.

Search Engine Marketing Annual Sem Campaign Performance Plan Guidelines PDF
The following slide showcases the yearly search engine marketing campaign performance plan to project results . It KPI such as revenue, pay-per-click, media spend, management fee, total cost, paid search revenue etc. Welcome to our selection of the Search Engine Marketing Annual Sem Campaign Performance Plan Guidelines PDF. These are designed to help you showcase your creativity and bring your sphere to life. Planning and Innovation are essential for any business that is just starting out. This collection contains the designs that you need for your everyday presentations. All of our PowerPoints are 100 percent editable, so you can customize them to suit your needs. This multi-purpose template can be used in various situations. Grab these presentation templates today.
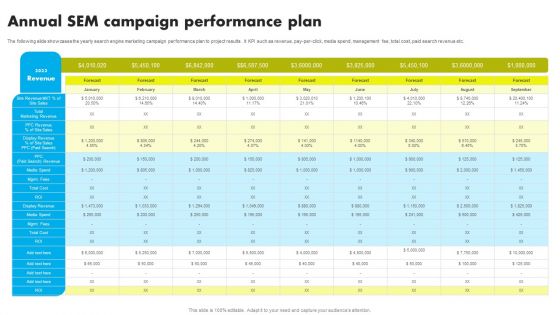
Annual SEM Campaign Performance Plan Ppt Layouts Templates PDF
Improving PPC Campaign Results Annual Sem Campaign Performance Plan Icons Pdf
The following slide showcases the yearly search engine marketing campaign performance plan to project results. It KPI such as revenue, pay-per-click, media spend, management fee, total cost, paid search revenue etc. Slidegeeks is one of the best resources for PowerPoint templates. You can download easily and regulate Improving PPC Campaign Results Annual Sem Campaign Performance Plan Icons Pdf for your personal presentations from our wonderful collection. A few clicks is all it takes to discover and get the most relevant and appropriate templates. Use our Templates to add a unique zing and appeal to your presentation and meetings. All the slides are easy to edit and you can use them even for advertisement purposes.
Dashboard For Tracking Impact Of Implementing Sales Techniques For Achieving Rules Pdf
This slide covers the KPI dashboard for tracking KPIs such as new customer YTD, sales revenue, profit, average weekly sales, above sales target, average revenue per unit, customer lifetime value, etc. Do you have an important presentation coming up Are you looking for something that will make your presentation stand out from the rest Look no further than Dashboard For Tracking Impact Of Implementing Sales Techniques For Achieving Rules Pdf. With our professional designs, you can trust that your presentation will pop and make delivering it a smooth process. And with Slidegeeks, you can trust that your presentation will be unique and memorable. So why wait Grab Dashboard For Tracking Impact Of Implementing Sales Techniques For Achieving Rules Pdf today and make your presentation stand out from the rest
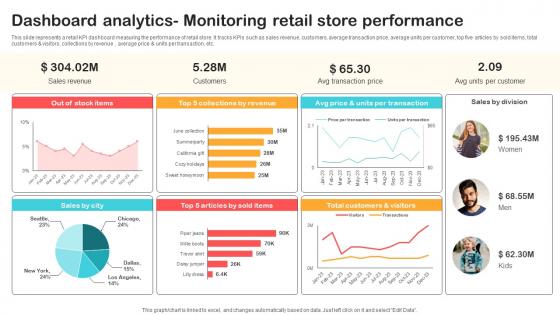
Dashboard Analytics Monitoring Retail Store Performance Optimizing Retail Operations With Digital DT SS V
This slide represents a retail KPI dashboard measuring the performance of retail store. It tracks KPIs such as sales revenue, customers, average transaction price, average units per customer, top five articles by sold items, total customers and visitors, collections by revenue , average price and units per transaction, etc.Are you in need of a template that can accommodate all of your creative concepts This one is crafted professionally and can be altered to fit any style. Use it with Google Slides or PowerPoint. Include striking photographs, symbols, depictions, and other visuals. Fill, move around, or remove text boxes as desired. Test out color palettes and font mixtures. Edit and save your work, or work with colleagues. Download Dashboard Analytics Monitoring Retail Store Performance Optimizing Retail Operations With Digital DT SS V and observe how to make your presentation outstanding. Give an impeccable presentation to your group and make your presentation unforgettable.
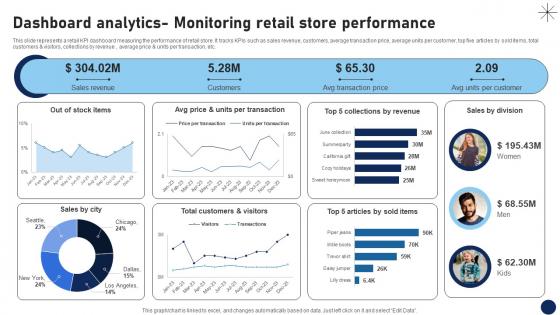
Dashboard Analytics Monitoring Retail Store Performance DT SS V
This slide represents a retail KPI dashboard measuring the performance of retail store. It tracks KPIs such as sales revenue, customers, average transaction price, average units per customer, top five articles by sold items, total customers and visitors, collections by revenue , average price and units per transaction, etc.Are you in need of a template that can accommodate all of your creative concepts This one is crafted professionally and can be altered to fit any style. Use it with Google Slides or PowerPoint. Include striking photographs, symbols, depictions, and other visuals. Fill, move around, or remove text boxes as desired. Test out color palettes and font mixtures. Edit and save your work, or work with colleagues. Download Dashboard Analytics Monitoring Retail Store Performance DT SS V and observe how to make your presentation outstanding. Give an impeccable presentation to your group and make your presentation unforgettable.

Brand Extension Techniques Product Line Market Performance Assessment Dashboard Strategy SS V
This slide showcases market analysis KPI dashboard for checking performance of product line items. It provides details about product revenue, revenue breakdown, time to market, existing products, etc. This Brand Extension Techniques Product Line Market Performance Assessment Dashboard Strategy SS V from Slidegeeks makes it easy to present information on your topic with precision. It provides customization options, so you can make changes to the colors, design, graphics, or any other component to create a unique layout. It is also available for immediate download, so you can begin using it right away. Slidegeeks has done good research to ensure that you have everything you need to make your presentation stand out. Make a name out there for a brilliant performance.

Product Line Market Performance Implementing Product Diversification PPT Sample Strategy SS V
This slide showcases market analysis KPI dashboard for checking performance of product line items. It provides details about product revenue, revenue breakdown, time to market, existing products, etc. Do you know about Slidesgeeks Product Line Market Performance Implementing Product Diversification PPT Sample Strategy SS V. These are perfect for delivering any kind od presentation. Using it, create PowerPoint presentations that communicate your ideas and engage audiences. Save time and effort by using our pre-designed presentation templates that are perfect for a wide range of topic. Our vast selection of designs covers a range of styles, from creative to business, and are all highly customizable and easy to edit. Download as a PowerPoint template or use them as Google Slides themes.
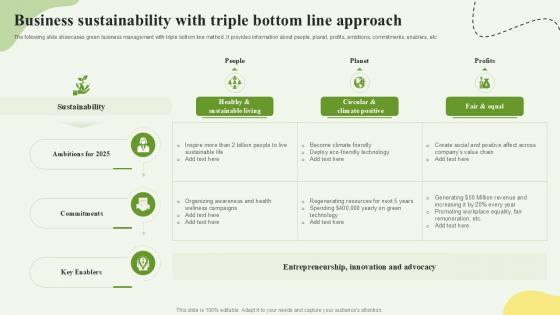
Business Sustainability With Triple Bottom Line Approach Ppt Example SS
This slide mentions the KPI dashboard for pharmaceutical companies. The purpose of this slide is analysis the 6 months gross selling of the company that can be utilized by the managers to determine actual revenue and profits. It includes details regarding discounts, unit sold per segment, profit by product, monthly revenue, etc. Get a simple yet stunning designed Business Sustainability With Triple Bottom Line Approach Ppt Example SS It is the best one to establish the tone in your meetings. It is an excellent way to make your presentations highly effective. So, download this PPT today from Slidegeeks and see the positive impacts. Our easy-to-edit Business Sustainability With Triple Bottom Line Approach Ppt Example SS can be your go-to option for all upcoming conferences and meetings. So, what are you waiting for Grab this template today.
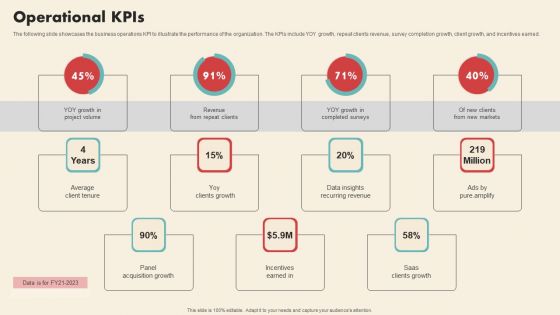
Data Driven Marketing Solutions Firm Company Profile Operational Kpis Graphics PDF
The following slide showcases the business operations KPI to illustrate the performance of the organization. The KPIs include YOY growth, repeat clients revenue, survey completion growth, client growth, and incentives earned. Are you searching for a Data Driven Marketing Solutions Firm Company Profile Operational Kpis Graphics PDF that is uncluttered, straightforward, and original Its easy to edit, and you can change the colors to suit your personal or business branding. For a presentation that expresses how much effort you have put in, this template is ideal. With all of its features, including tables, diagrams, statistics, and lists, its perfect for a business plan presentation. Make your ideas more appealing with these professional slides. Download Data Driven Marketing Solutions Firm Company Profile Operational Kpis Graphics PDF from Slidegeeks today.
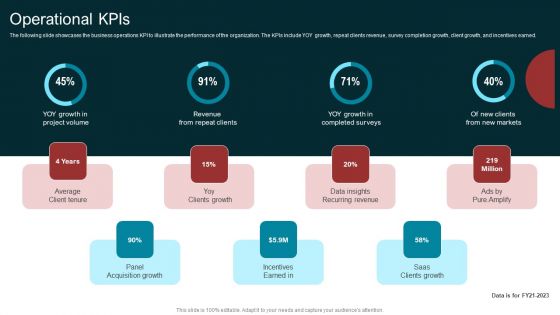
Marketing Agency Company Outline Operational Kpis Themes PDF
The following slide showcases the business operations KPI to illustrate the performance of the organization. The KPIs include YOY growth, repeat clients revenue, survey completion growth, client growth, and incentives earned. Here you can discover an assortment of the finest PowerPoint and Google Slides templates. With these templates, you can create presentations for a variety of purposes while simultaneously providing your audience with an eye catching visual experience. Download Marketing Agency Company Outline Operational Kpis Themes PDF to deliver an impeccable presentation. These templates will make your job of preparing presentations much quicker, yet still, maintain a high level of quality. Slidegeeks has experienced researchers who prepare these templates and write high quality content for you. Later on, you can personalize the content by editing the Marketing Agency Company Outline Operational Kpis Themes PDF.

Operational KPIsA Marketing Research Services Management Business Sample Pdf
The following slide showcases the business operations KPI to illustrate the performance of the organization. The KPIs include YOY growth, repeat clients revenue, survey completion growth, client growth, and incentives earned. Are you searching for a Operational KPIsA Marketing Research Services Management Business Sample Pdf that is uncluttered, straightforward, and original It is easy to edit, and you can change the colors to suit your personal or business branding. For a presentation that expresses how much effort you have put in, this template is ideal With all of its features, including tables, diagrams, statistics, and lists, it is perfect for a business plan presentation. Make your ideas more appealing with these professional slides. Download Operational KPIsA Marketing Research Services Management Business Sample Pdf from Slidegeeks today.
Dashboard For Tracking Ambassador Techniques For Generating Brand Awareness Graphics Pdf
This slide covers the KPI dashboard for companies to evaluate the performance of ambassador marketing campaigns. It includes metrics such as the number of brand ambassadors, the total number of shares, clicks, CPS, revenue, commissions, etc. Do you have an important presentation coming up Are you looking for something that will make your presentation stand out from the rest Look no further than Dashboard For Tracking Ambassador Techniques For Generating Brand Awareness Graphics Pdf. With our professional designs, you can trust that your presentation will pop and make delivering it a smooth process. And with Slidegeeks, you can trust that your presentation will be unique and memorable. So why wait Grab Dashboard For Tracking Ambassador Techniques For Generating Brand Awareness Graphics Pdf today and make your presentation stand out from the rest
Dashboard For Tracking Referral Techniques For Generating Brand Awareness Sample Pdf
This slide covers the KPI dashboard for brands to evaluate the performance of referral marketing campaigns. It includes metrics such as referral participation rate, referred customers, referral conversion rate, total revenue generated, etc Whether you have daily or monthly meetings, a brilliant presentation is necessary. Dashboard For Tracking Referral Techniques For Generating Brand Awareness Sample Pdf can be your best option for delivering a presentation. Represent everything in detail using Dashboard For Tracking Referral Techniques For Generating Brand Awareness Sample Pdf and make yourself stand out in meetings. The template is versatile and follows a structure that will cater to your requirements. All the templates prepared by Slidegeeks are easy to download and edit. Our research experts have taken care of the corporate themes as well. So, give it a try and see the results.
Dashboard For Tracking Ambassador Marketing Tracking Word Mouth Marketing Summary PDF
This slide covers the KPI dashboard for companies to evaluate the performance of ambassador marketing campaigns. It includes metrics such as the number of brand ambassadors, the total number of shares, clicks, CPS, revenue, commissions, etc. Do you have an important presentation coming up Are you looking for something that will make your presentation stand out from the rest Look no further than Dashboard For Tracking Ambassador Marketing Tracking Word Mouth Marketing Summary PDF. With our professional designs, you can trust that your presentation will pop and make delivering it a smooth process. And with Slidegeeks, you can trust that your presentation will be unique and memorable. So why wait Grab Dashboard For Tracking Ambassador Marketing Tracking Word Mouth Marketing Summary PDF today and make your presentation stand out from the rest
Dashboard For Tracking Referral Marketing Tracking Word Mouth Marketing Slides PDF
This slide covers the KPI dashboard for brands to evaluate the performance of referral marketing campaigns. It includes metrics such as referral participation rate, referred customers, referral conversion rate, total revenue generated, etc. Whether you have daily or monthly meetings, a brilliant presentation is necessary. Dashboard For Tracking Referral Marketing Tracking Word Mouth Marketing Slides PDF can be your best option for delivering a presentation. Represent everything in detail using Dashboard For Tracking Referral Marketing Tracking Word Mouth Marketing Slides PDF and make yourself stand out in meetings. The template is versatile and follows a structure that will cater to your requirements. All the templates prepared by Slidegeeks are easy to download and edit. Our research experts have taken care of the corporate themes as well. So, give it a try and see the results.
Dashboard For Tracking Referral Implementing Social Media Tactics For Boosting WOM Icons Pdf
This slide covers the KPI dashboard for brands to evaluate the performance of referral marketing campaigns. It includes metrics such as referral participation rate, referred customers, referral conversion rate, total revenue generated, etc.Do you have an important presentation coming up Are you looking for something that will make your presentation stand out from the rest Look no further than Dashboard For Tracking Referral Implementing Social Media Tactics For Boosting WOM Icons Pdf. With our professional designs, you can trust that your presentation will pop and make delivering it a smooth process. And with Slidegeeks, you can trust that your presentation will be unique and memorable. So why wait Grab Dashboard For Tracking Referral Implementing Social Media Tactics For Boosting WOM Icons Pdf today and make your presentation stand out from the rest
Dashboard Tracking Ambassador Implementing Social Media Tactics For Boosting WOM Demonstration Pdf
This slide covers the KPI dashboard for companies to evaluate the performance of ambassador marketing campaigns. It includes metrics such as the number of brand ambassadors, the total number of shares, clicks, CPS, revenue, commissions, etc.Find highly impressive Dashboard Tracking Ambassador Implementing Social Media Tactics For Boosting WOM Demonstration Pdf on Slidegeeks to deliver a meaningful presentation. You can save an ample amount of time using these presentation templates. No need to worry to prepare everything from scratch because Slidegeeks experts have already done a huge research and work for you. You need to download Dashboard Tracking Ambassador Implementing Social Media Tactics For Boosting WOM Demonstration Pdf for your upcoming presentation. All the presentation templates are 100 percent editable and you can change the color and personalize the content accordingly. Download now
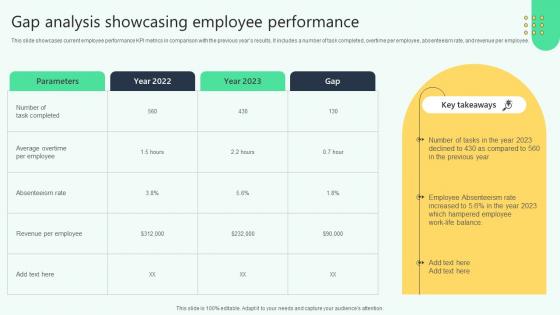
Gap Analysis Showcasing Employee Performance Analysing Hr Data For Effective Decision Making
This slide showcases current employee performance KPI metrics in comparison with the previous years results. It includes a number of task completed, overtime per employee, absenteeism rate, and revenue per employee. This modern and well-arranged Gap Analysis Showcasing Employee Performance Analysing Hr Data For Effective Decision Making provides lots of creative possibilities. It is very simple to customize and edit with the Powerpoint Software. Just drag and drop your pictures into the shapes. All facets of this template can be edited with Powerpoint, no extra software is necessary. Add your own material, put your images in the places assigned for them, adjust the colors, and then you can show your slides to the world, with an animated slide included.

Measuring Customer Satisfaction Improving Customer Retention PPT Template
The following slide covers KPI dashboard to evaluate customer satisfaction score. It includes elements such as requests answered, total revenue, service level, cost per support, retention rate, average time taken to resolve an issue etc. This modern and well-arranged Measuring Customer Satisfaction Improving Customer Retention PPT Template provides lots of creative possibilities. It is very simple to customize and edit with the Powerpoint Software. Just drag and drop your pictures into the shapes. All facets of this template can be edited with Powerpoint, no extra software is necessary. Add your own material, put your images in the places assigned for them, adjust the colors, and then you can show your slides to the world, with an animated slide included.

Measuring Customer Satisfaction Enhancing Customer Experience Ppt Sample
The following slide covers KPI dashboard to evaluate customer satisfaction score. It includes elements such as requests answered, total revenue, service level, cost per support, retention rate, average time taken to resolve an issue etc. This modern and well-arranged Measuring Customer Satisfaction Enhancing Customer Experience Ppt Sample provides lots of creative possibilities. It is very simple to customize and edit with the Powerpoint Software. Just drag and drop your pictures into the shapes. All facets of this template can be edited with Powerpoint, no extra software is necessary. Add your own material, put your images in the places assigned for them, adjust the colors, and then you can show your slides to the world, with an animated slide included.
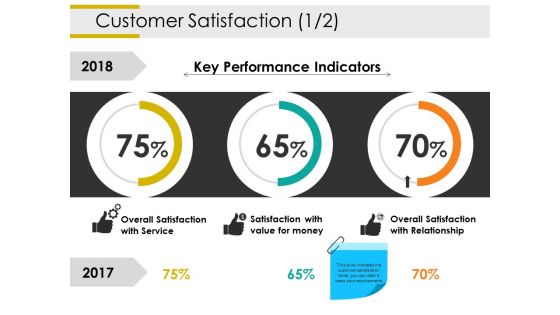
Customer Satisfaction Template 1 Ppt PowerPoint Presentation Portfolio Graphics Example
This is a customer satisfaction template 1 ppt powerpoint presentation portfolio graphics example. This is a three stage process. The stages in this process are overall satisfaction with service, satisfaction with value for money, overall satisfaction with relationship, key performance indicators, business, percentage.
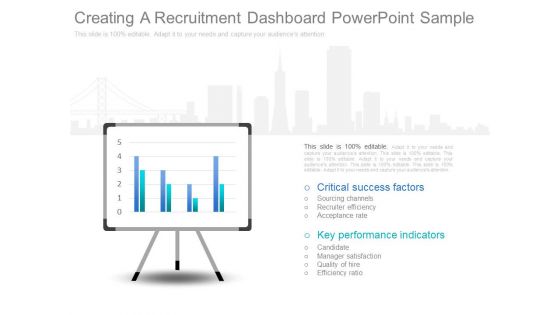
Creating A Recruitment Dashboard Powerpoint Sample
This is a creating a recruitment dashboard powerpoint sample. This is a two stage process. The stages in this process are critical success factors, sourcing channels, recruiter efficiency, acceptance rate, key performance indicators, candidate, manager satisfaction, quality of hire, efficiency ratio.

Chart With Magnifying Glass For Business Research Ppt PowerPoint Presentation Inspiration Shapes
This is a chart with magnifying glass for business research ppt powerpoint presentation inspiration shapes. This is a two stage process. The stages in this process are metrics icon, kpis icon, statistics icon.
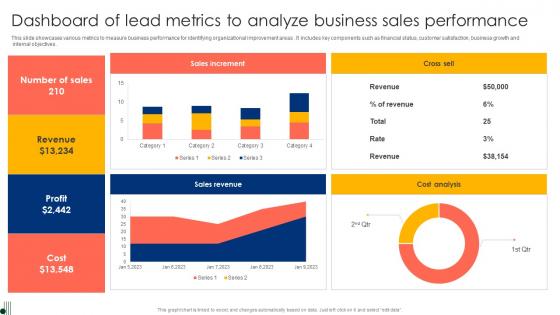
Dashboard Of Lead Metrics To Analyze Business Sales Performance Ppt Summary Graphics Pdf
This slide showcases various metrics to measure business performance for identifying organizational improvement areas. It includes key components such as financial status, customer satisfaction, business growth and internal objectives. Showcasing this set of slides titled Dashboard Of Lead Metrics To Analyze Business Sales Performance Ppt Summary Graphics Pdf. The topics addressed in these templates are Sales Increment, Cross Sell, Cost Analysis. All the content presented in this PPT design is completely editable. Download it and make adjustments in color, background, font etc. as per your unique business setting.

Price Architecture Cost Sheet Ratio Cont Ppt PowerPoint Presentation Portfolio Guidelines PDF
These four key performance indicator calculates a gross profit margin. Presenting price architecture cost sheet ratio cont ppt powerpoint presentation portfolio guidelines pdf to provide visual cues and insights. Share and navigate important information on four stages that need your due attention. This template can be used to pitch topics like gross profit margin, direct material cost per unit, direct labor cost per unit, fixed overhead cost per unit, sales volume, sales revenue. In addition, this PPT design contains high-resolution images, graphics, etc, that are easily editable and available for immediate download.
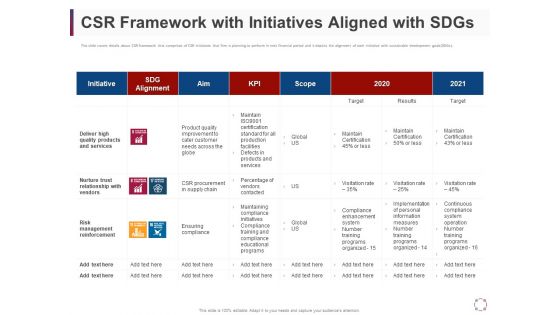
CSR Activities Company Reputation Management CSR Framework With Initiatives Aligned With Sdgs Ppt Layouts Inspiration PDF
This slide covers details about CSR framework that comprises of CSR initiatives that firm is planning to perform in next financial period and it depicts the alignment of each initiative with sustainable development goals SDGs. Deliver and pitch your topic in the best possible manner with this csr activities company reputation management csr framework with initiatives aligned with sdgs ppt layouts inspiration pdf. Use them to share invaluable insights on initiative, kpi, scope, sdg alignment, risk management and impress your audience. This template can be altered and modified as per your expectations. So, grab it now.
Sales Order Processing Performance Tracking Indicators Graphics PDF
The following slide showcases key performance indicators for sales order fulfilment to meet customer expectations, specifications, deliver goods on time, compare order fulfilment against past orders. It includes elements such as category, key performance indicators, expected rate and actual rate. Showcasing this set of slides titled Sales Order Processing Performance Tracking Indicators Graphics PDF. The topics addressed in these templates are Customer Metrics, Inbound Metrics, Financial Metrics. All the content presented in this PPT design is completely editable. Download it and make adjustments in color, background, font etc. as per your unique business setting.

Stock Market Research Report Balance Sheet FY19 Tabular Form Equity Information PDF
The purpose of the following slide is to display the key performance indicators of the balance sheet for four quarters of FY 2019. These KPIs can be Current assets, Current Liability , Total Assets and Total Liabilities. Presenting stock market research report balance sheet fy19 tabular form equity information pdf to provide visual cues and insights. Share and navigate important information on one stages that need your due attention. This template can be used to pitch topics like non current liabilities, short term borrowings, trade payables, other current liabilities, short term provisions. In addition, this PPT design contains high-resolution images, graphics, etc, that are easily editable and available for immediate download.

Real Estate Marketing Strategy Vendors Real Estate Customer Service Kpis Topics PDF
This template covers real estate companys Key performance indicators that are used to measure customer services for real estate company. Presenting real estate marketing strategy vendors real estate customer service kpis topics pdf to provide visual cues and insights. Share and navigate important information on six stages that need your due attention. This template can be used to pitch topics like measurement, buyer clients, service. In addtion, this PPT design contains high resolution images, graphics, etc, that are easily editable and available for immediate download.
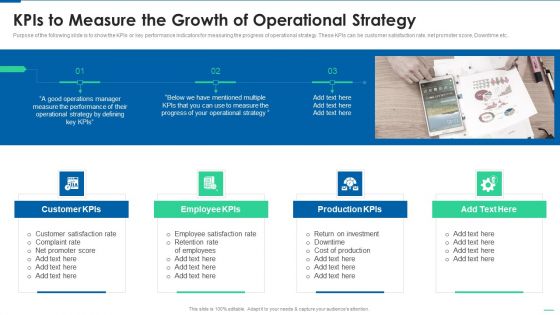
Six Sigma Continuous Process Kpis To Measure The Growth Of Operational Strategy Rules PDF
Purpose of the following slide is to show the KPIs or key performance indicators for measuring the progress of operational strategy. These KPIs can be customer satisfaction rate, net promoter score, Downtime etc. This is a Six Sigma Continuous Process Kpis To Measure The Growth Of Operational Strategy Rules PDF template with various stages. Focus and dispense information on four stages using this creative set, that comes with editable features. It contains large content boxes to add your information on topics like Customer KPIs, Employee KPIs, Production KPIs. You can also showcase facts, figures, and other relevant content using this PPT layout. Grab it now.

Yearly Sales Assessment With Key Performance Indicator Matrix Introduction PDF
This slide covers quarterly product units sold through out a financial year in an organization with growth in revenue, profit and number of customer from previous years sales. It includes product sold and growth rate. Presenting Yearly Sales Assessment With Key Performance Indicator Matrix Introduction PDF to dispense important information. This template comprises four stages. It also presents valuable insights into the topics including Sold Growth Rate, Customers, Growth In Profit. This is a completely customizable PowerPoint theme that can be put to use immediately. So, download it and address the topic impactfully.

Logistics Management Dashboard With Monthly Key Performance Indicators Rules PDF
This slide showcases status dashboard for shipping that can help organization to calculate accurate shipping information and identify latest tracking updates. Its key components are order status, volume today, global financial performance, inventory and monthly KPIs. Pitch your topic with ease and precision using this Logistics Management Dashboard With Monthly Key Performance Indicators Rules PDF. This layout presents information on Orders, Inventory, Kpis Monthly. It is also available for immediate download and adjustment. So, changes can be made in the color, design, graphics or any other component to create a unique layout.

Monthly Social Media Dashboard Ppt PowerPoint Presentation Model Slide
This is a monthly social media dashboard ppt powerpoint presentation model slide. This is a four stage process. The stages in this process are sales, social events, business, finance, key social metrics.

Hr Dashboard Ppt PowerPoint Presentation Shapes
This is a hr dashboard ppt powerpoint presentation shapes. This is a four stage process. The stages in this process are total employees, key metrics, employee churn, open positions by divisions.

 Home
Home