Financial Kpi
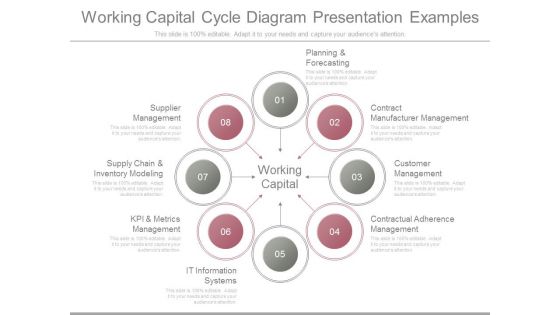
Working Capital Cycle Diagram Presentation Examples
This is a working capital cycle diagram presentation examples. This is a eight stage process. The stages in this process are planning and forecasting, contract manufacturer management, customer management, contractual adherence management, it information systems, kpi and metrics management, supply chain and inventory modeling, supplier management.
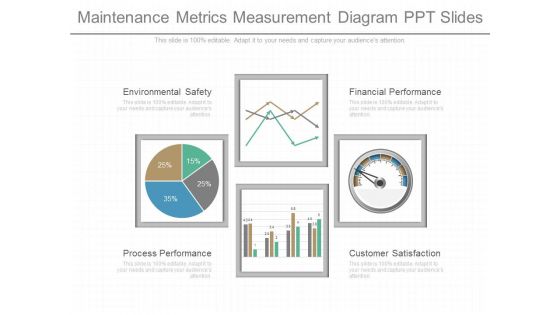
Maintenance Metrics Measurement Diagram Ppt Slides
This is a maintenance metrics measurement diagram ppt slides. This is a four stage process. The stages in this process are environmental safety, process performance, financial performance, customer satisfaction.
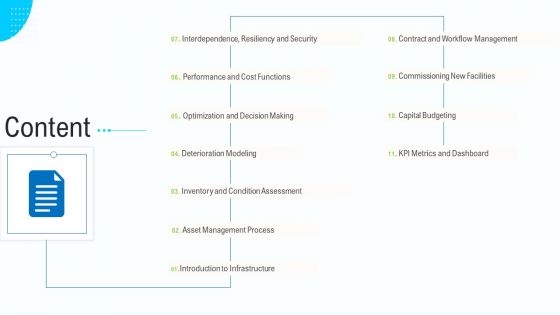
Business Activities Assessment Examples Content Professional PDF
Deliver an awe inspiring pitch with this creative business activities assessment examples content professional pdf bundle. Topics like contract and workflow management, commissioning new facilities, capital budgeting, kpi metrics and dashboard, asset management process can be discussed with this completely editable template. It is available for immediate download depending on the needs and requirements of the user.
Online Business Promotion Performance Analysis To Fulfill Business Objectives Ppt PowerPoint Presentation Summary Icon PDF
Pitch your topic with ease and precision using this online business promotion performance analysis to fulfill business objectives ppt powerpoint presentation summary icon pdf. This layout presents information on KPI performance metric, advertiser revenue, sell products. It is also available for immediate download and adjustment. So, changes can be made in the color, design, graphics or any other component to create a unique layout.
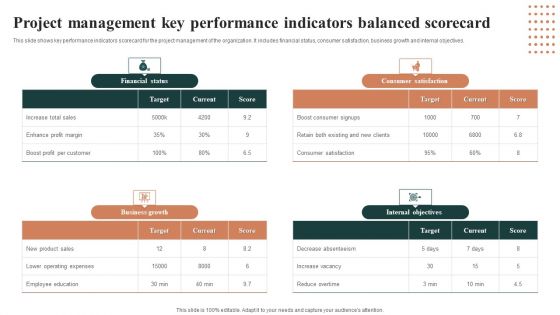
Project Management Key Performance Indicators Balanced Scorecard Introduction PDF
This slide shows key performance indicators scorecard for the project management of the organization. It includes financial status, consumer satisfaction, business growth and internal objectives. Pitch your topic with ease and precision using this Project Management Key Performance Indicators Balanced Scorecard Introduction PDF. This layout presents information on Financial Status, Business Growth, Consumer Satisfaction. It is also available for immediate download and adjustment. So, changes can be made in the color, design, graphics or any other component to create a unique layout.
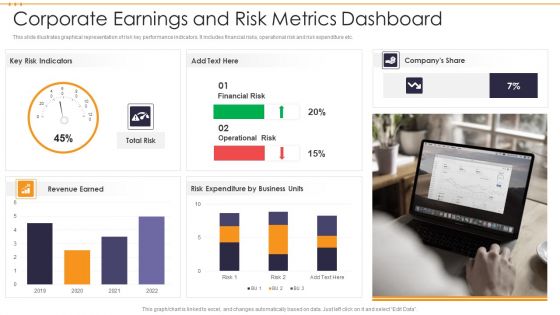
Corporate Earnings And Risk Metrics Dashboard Guidelines PDF
This slide illustrates graphical representation of risk key performance indicators. It includes financial risks, operational risk and risk expenditure etc. Pitch your topic with ease and precision using this Corporate Earnings And Risk Metrics Dashboard Guidelines PDF. This layout presents information on Financial Risk, Operational Risk Expenditure. It is also available for immediate download and adjustment. So, changes can be made in the color, design, graphics or any other component to create a unique layout.
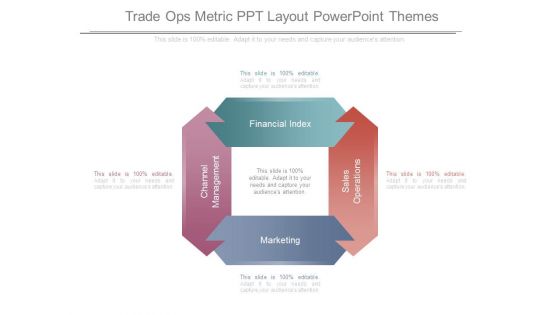
Trade Ops Metric Ppt Layout Powerpoint Themes
This is a trade ops metric ppt layout powerpoint themes. This is a four stage process. The stages in this process are channel management, marketing, sales operations, financial index.

Advanced Email Metrics And Analysis Services Diagram Slide
This is a advanced email metrics and analysis services diagram slide. This is a four stage process. The stages in this process are analytics data warehouse, data mining, financial modeling.

Supply Chain Management Operational Metrics Performance Measures Designs PDF
This is a supply chain management operational metrics performance measures designs pdf. template with various stages. Focus and dispense information on two stages using this creative set, that comes with editable features. It contains large content boxes to add your information on topics like NON financial measures, financial measures. You can also showcase facts, figures, and other relevant content using this PPT layout. Grab it now.

Service Business Plan Example Powerpoint Ideas
This is a service business plan example powerpoint ideas. This is a nine stage process. The stages in this process are business plan, product or service, marketing plan, financial plan, key management, focused strategy, investors, metrics.
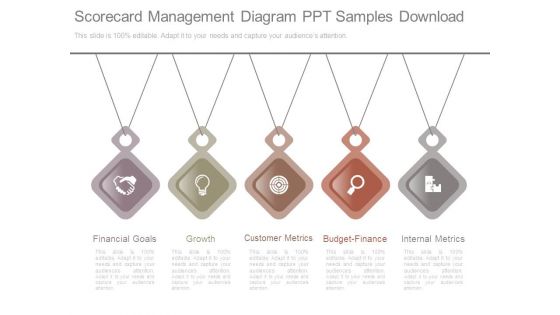
Scorecard Management Diagram Ppt Samples Download
This is a scorecard management diagram ppt samples download. This is a five stage process. The stages in this process are financial goals, growth, customer metrics, budget finance, internal metrics.
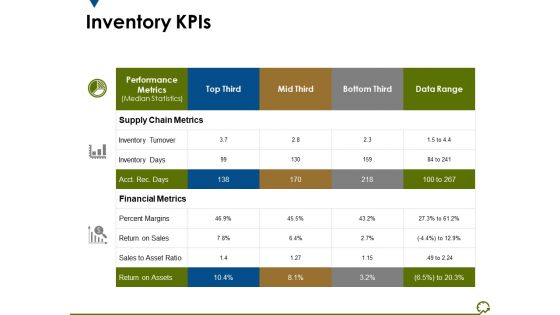
Inventory Kpis Ppt PowerPoint Presentation Infographic Template Display
This is a inventory kpis ppt powerpoint presentation infographic template display. This is a three stage process. The stages in this process are supply chain metrics, financial metrics, percent margins, return on assets, inventory turnover.
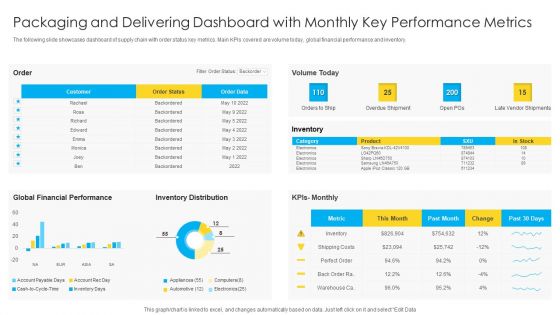
Packaging And Delivering Dashboard With Monthly Key Performance Metrics Microsoft PDF
The following slide showcases dashboard of supply chain with order status key metrics. Main KPIs covered are volume today, global financial performance and inventory. Pitch your topic with ease and precision using this Packaging And Delivering Dashboard With Monthly Key Performance Metrics Microsoft PDF. This layout presents information on Customer, Global Financial Performance, Inventory Distribution. It is also available for immediate download and adjustment. So, changes can be made in the color, design, graphics or any other component to create a unique layout.
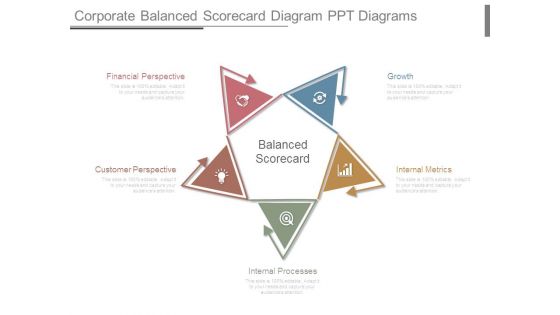
Corporate Balanced Scorecard Diagram Ppt Diagrams
This is a corporate balanced scorecard diagram ppt diagrams. This is a five stage process. The stages in this process are financial perspective, customer perspective, internal processes, growth, internal metrics, balanced scorecard.
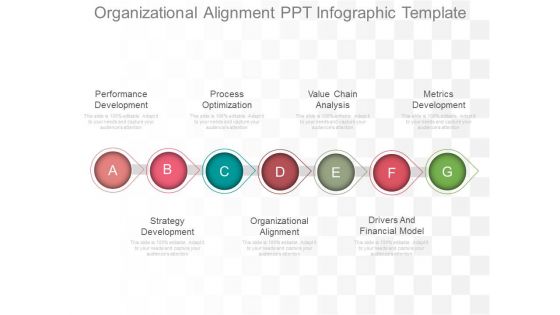
Organizational Alignment Ppt Infographic Template
This is a organizational alignment ppt infographic template. This is a seven stage process. The stages in this process are performance development, process optimization, value chain analysis, metrics development, strategy development, organizational alignment, drivers and financial model.
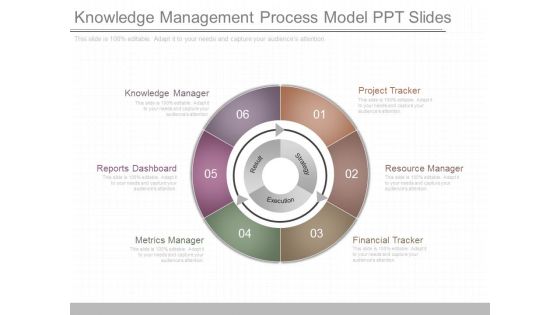
Knowledge Management Process Model Ppt Slides
This is a knowledge management process model ppt slides. This is a six stage process. The stages in this process are knowledge manager, reports dashboard, metrics manager, financial tracker, resource manager, project tracker, result, strategy, execution.

Matrix For Retirement Considerations And Options Ratings Infographics PDF
This slide illustrates decision making and ratings table regarding individual retirement. It includes metrics like personal health, financial health, family, age etc. Showcasing this set of slides titled Matrix For Retirement Considerations And Options Ratings Infographics PDF. The topics addressed in these templates are Personal Health, Financial Health, Family. All the content presented in this PPT design is completely editable. Download it and make adjustments in color, background, font etc. as per your unique business setting.
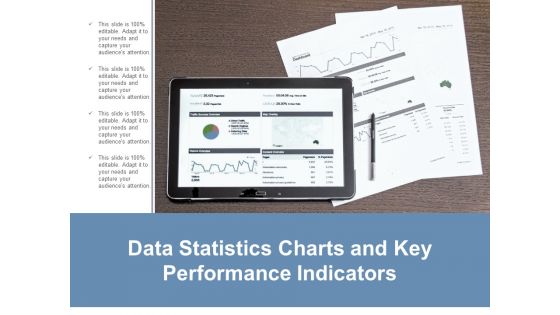
Data Statistics Charts And Key Performance Indicators Ppt Powerpoint Presentation Layouts Guide
This is a data statistics charts and key performance indicators ppt powerpoint presentation layouts guide. This is a four stage process. The stages in this process are business metrics, business kpi, business dashboard.
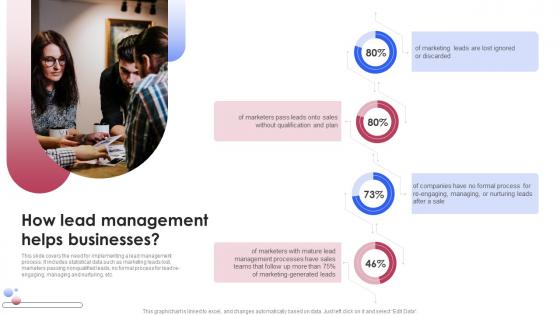
How Lead Management Helps Businesses Various Techniques For Managing Mockup PDF
This slide covers the KPI dashboard for tracking improved lead management system performance. It includes metrics such as visitors, social media followers, email subscribers, organic leads, etc. This slide covers the KPI dashboard for tracking improved lead management system performance. It includes metrics such as visitors, social media followers, email subscribers, organic leads, etc. Make sure to capture your audiences attention in your business displays with our gratis customizable How Lead Management Helps Businesses Various Techniques For Managing Mockup PDF. These are great for business strategies, office conferences, capital raising or task suggestions. If you desire to acquire more customers for your tech business and ensure they stay satisfied, create your own sales presentation with these plain slides.

Business Strategy And Promotional Approach For Multiplayer Oriented Mobile Game Kpis For Measuring Marketing Efforts Topics PDF
The following slide helps organization in understanding the essential KPIs for measuring marketing activities for Web3 P2E based NFT game. These KPIs can be general mobile app KPI, App engagement metrics, revenue focused mobile KPI and all store KPIs Do you know about Slidesgeeks Business Strategy And Promotional Approach For Multiplayer Oriented Mobile Game Kpis For Measuring Marketing Efforts Topics PDF. These are perfect for delivering any kind od presentation. Using it, create PowerPoint presentations that communicate your ideas and engage audiences. Save time and effort by using our pre designed presentation templates that are perfect for a wide range of topic. Our vast selection of designs covers a range of styles, from creative to business, and are all highly customizable and easy to edit. Download as a PowerPoint template or use them as Google Slides themes.

Web 3 0 Blockchain Based P2E Mobile Game Sector Report Promotional Plan Kpis For Measuring Marketing Diagrams PDF
The following slide helps organization in understanding the essential KPIs for measuring marketing activities for Web3 P2E based NFT game. These KPIs can be general mobile app KPI, App engagement metrics, revenue- focused mobile KPI and all store Kpis. Find highly impressive Web 3 0 Blockchain Based P2E Mobile Game Sector Report Promotional Plan Kpis For Measuring Marketing Diagrams PDF on Slidegeeks to deliver a meaningful presentation. You can save an ample amount of time using these presentation templates. No need to worry to prepare everything from scratch because Slidegeeks experts have already done a huge research and work for you. You need to download Web 3 0 Blockchain Based P2E Mobile Game Sector Report Promotional Plan Kpis For Measuring Marketing Topics PDF for your upcoming presentation. All the presentation templates are 100 percent editable and you can change the color and personalize the content accordingly. Download now.

Smartphone Game Development And Advertising Technique Kpis For Measuring Marketing Efforts And Application Guidelines PDF
The following slide helps organization in understanding the essential KPIs for measuring marketing activities for Web3 P2E based NFT game. These KPIs can be general mobile app KPI, App engagement metrics, revenue focused mobile KPI and all store KPIs Present like a pro with Smartphone Game Development And Advertising Technique Kpis For Measuring Marketing Efforts And Application Guidelines PDF Create beautiful presentations together with your team, using our easy to use presentation slides. Share your ideas in real time and make changes on the fly by downloading our templates. So whether you are in the office, on the go, or in a remote location, you can stay in sync with your team and present your ideas with confidence. With Slidegeeks presentation got a whole lot easier. Grab these presentations today.

Yearly Project Engineering Performance Metrics Dashboard Information PDF
This slide covers project engineering KPI dashboard on yearly basis. It involves KPIs such as total revenue, support cost, research and development cost and units economics. Pitch your topic with ease and precision using this Yearly Project Engineering Performance Metrics Dashboard Information PDF. This layout presents information on Support Cost, Revenue, Measures. It is also available for immediate download and adjustment. So, changes can be made in the color, design, graphics or any other component to create a unique layout.
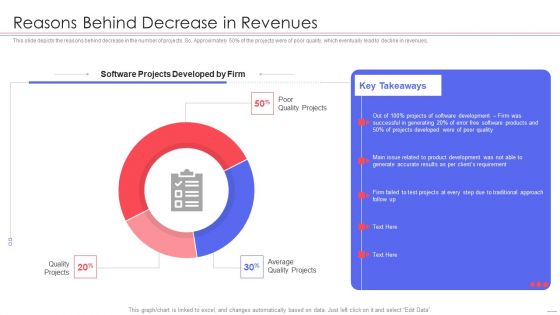
Agile QA Procedure Reasons Behind Decrease In Revenues Elements PDF
This slide depicts the reasons behind decrease in the number of projects. So, Approximately 50 parcent of the projects were of poor quality, which eventually lead to decline in revenues. Deliver and pitch your topic in the best possible manner with this agile qa procedure quality control kpi dashboard topics pdf. Use them to share invaluable insights on reasons behind decrease in revenues and impress your audience. This template can be altered and modified as per your expectations. So, grab it now.

Essentials Of Statistics For Business And Economics Ppt Powerpoint Presentation Pictures Styles
This is a essentials of statistics for business and economics ppt powerpoint presentation pictures styles. This is a three stage process. The stages in this process are business metrics, business kpi, business dashboard.

Calculator With Business Reports For Operational Efficiency Ppt Powerpoint Presentation Ideas Infographic Template
This is a calculator with business reports for operational efficiency ppt powerpoint presentation ideas infographic template. This is a four stage process. The stages in this process are business metrics, business kpi, business dashboard.
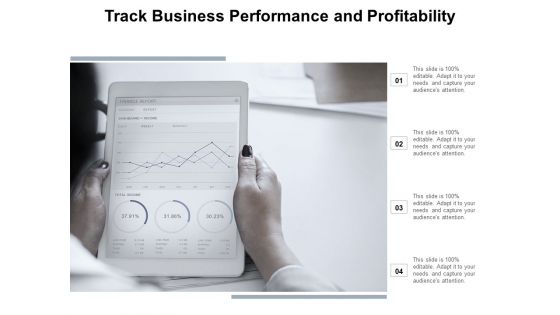
Track Business Performance And Profitability Ppt Powerpoint Presentation File Master Slide
This is a track business performance and profitability ppt powerpoint presentation file master slide. This is a four stage process. The stages in this process are business metrics, business kpi, business dashboard.
Online Customer Interaction Referral Program Performance Tracking Dashboard Sample PDF
This slide covers the KPI dashboard for analyzing referral campaign results. It includes metrics such as total revenue generated, monthly recurring revenue, new customers, clicks, cancelled customers, paying customers, etc. Deliver an awe inspiring pitch with this creative Online Customer Interaction Referral Program Performance Tracking Dashboard Sample PDF bundle. Topics like Revenue Generated, Recurring Revenue, Paying Customers can be discussed with this completely editable template. It is available for immediate download depending on the needs and requirements of the user.
Referral Program Performance Tracking Dashboard Elements PDF
This slide covers the KPI dashboard for analyzing referral campaign results. It includes metrics such as total revenue generated, monthly recurring revenue, new customers, clicks, cancelled customers, paying customers, etc. Deliver an awe inspiring pitch with this creative Referral Program Performance Tracking Dashboard Elements PDF bundle. Topics like Dashboard, Monthly Recurring Revenue, Paying Customers can be discussed with this completely editable template. It is available for immediate download depending on the needs and requirements of the user.
E Commerce Transactions Performance Tracking Dashboard Topics PDF
This slide displays KPI dashboard to help company in tracking and monitoring total online purchases made. It includes metrics such as revenue, customers, average price, top articles sold, etc. Showcasing this set of slides titled E Commerce Transactions Performance Tracking Dashboard Topics PDF. The topics addressed in these templates are Total Customers, Division, Revenue. All the content presented in this PPT design is completely editable. Download it and make adjustments in color, background, font etc. as per your unique business setting.
Online Customer Interaction Loyalty Program Performance Tracking Dashboard Rules PDF
This slide covers the KPI dashboard for analyzing customer loyalty campaign results. It includes metrics such as revenue, liability, NQP accrued, transaction count, members, redemption ratio, etc.Deliver an awe inspiring pitch with this creative Online Customer Interaction Loyalty Program Performance Tracking Dashboard Rules PDF bundle. Topics like Revenue Liability, Transaction Count, Redemption Ratio can be discussed with this completely editable template. It is available for immediate download depending on the needs and requirements of the user.
Loyalty Program Performance Tracking Dashboard Background PDF
This slide covers the KPI dashboard for analyzing customer loyalty campaign results. It includes metrics such as revenue, liability, NQP accrued, transaction count, members, redemption ratio, etc. Deliver an awe inspiring pitch with this creative Loyalty Program Performance Tracking Dashboard Background PDF bundle. Topics like Liability, Revenue, Redemption Ratio can be discussed with this completely editable template. It is available for immediate download depending on the needs and requirements of the user.
Referral Program Performance Tracking Dashboard Summary PDF
This slide covers the KPI dashboard for analyzing referral campaign results. It includes metrics such as total revenue generated, monthly recurring revenue, new customers, clicks, cancelled customers, paying customers, etc. Deliver and pitch your topic in the best possible manner with this Referral Program Performance Tracking Dashboard Summary PDF. Use them to share invaluable insights on Referral Program Performance, Tracking Dashboard and impress your audience. This template can be altered and modified as per your expectations. So, grab it now.

IT Infrastructure Governance Content Ppt Slides Graphic Tips PDF
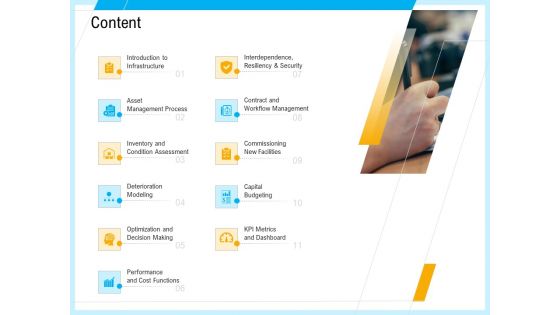
Deliver an awe inspiring pitch with this creative it infrastructure governance content ppt slides graphic tips pdf. bundle. Topics like introduction to infrastructure, asset management process, inventory and condition assessment, contract and workflow management, commissioning new facilities, capital budgeting, kpi metrics and dashboard can be discussed with this completely editable template. It is available for immediate download depending on the needs and requirements of the user.
IT And Cloud Facilities Management Content Ppt PowerPoint Presentation Infographics Layouts PDF
Presenting it and cloud facilities management content ppt powerpoint presentation infographics layouts pdf to provide visual cues and insights. Share and navigate important information on eleven stages that need your due attention. This template can be used to pitch topics like optimization and decision making, performance and cost functions, capital budgeting, kpi metrics and dashboard, contract and workflow management, interdependence, resiliency and security. In addition, this PPT design contains high-resolution images, graphics, etc, that are easily editable and available for immediate download.
Loyalty Program Performance Tracking Dashboard Topics PDF
This slide covers the KPI dashboard for analyzing customer loyalty campaign results. It includes metrics such as revenue, liability, NQP accrued, transaction count, members, redemption ratio, etc. Deliver an awe inspiring pitch with this creative Loyalty Program Performance Tracking Dashboard Topics PDF bundle. Topics like Loyalty Program Performance, Tracking Dashboard can be discussed with this completely editable template. It is available for immediate download depending on the needs and requirements of the user.

NSS Electronic Manufacturing Company Dashboard Portrait PDF
This slide shows a NSS Electronic Manufacturing Company Dashboard with KPI s such as Company Revenue , Production Volumes, Cost Breakdown, Average Cost by Production Component , total cost per unit etc. Deliver an awe inspiring pitch with this creative nss electronic manufacturing company dashboard portrait pdf bundle. Topics like nss electronic manufacturing company dashboard can be discussed with this completely editable template. It is available for immediate download depending on the needs and requirements of the user.
Strategies Envr Onmental Operational Challenges Dashboards Related To The Patients Of Pharmaceutical Themes PDF
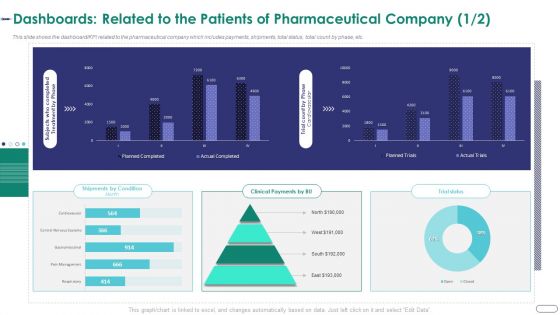
This slide shows the dashboard KPI related to the pharmaceutical company which includes payments, shipments, total status, total count by phase, etc. Deliver and pitch your topic in the best possible manner with this strategies envr onmental operational challenges dashboards related to the patients of pharmaceutical themes pdf. Use them to share invaluable insights on business overview, total employees, total revenue, total profit, headquarter and impress your audience. This template can be altered and modified as per your expectations. So, grab it now.
Information Technology Service Integration Post Acquisition Merger Customer Service Measuring Icons PDF
This slide illustrates customer service dashboard covering informational stats about NPS score, growth rate, customer distribution, top customer locations, inbound leads and revenue by type. Deliver an awe inspiring pitch with this creative information technology service integration post acquisition merger customer service measuring icons pdf bundle. Topics like customer service measuring kpi dashboard can be discussed with this completely editable template. It is available for immediate download depending on the needs and requirements of the user.
Agile QA Procedure Regression Testing In Quality Assurance Stages Icons PDF
This slide defines how regression testing is performed in quality assurance stages with different iterations. This is a agile qa procedure quality control kpi dashboard topics pdf template with various stages. Focus and dispense information on two stages using this creative set, that comes with editable features. It contains large content boxes to add your information on topics like reasons behind decrease in revenues. You can also showcase facts, figures, and other relevant content using this PPT layout. Grab it now.
Clients Segmentation And Target Overview Dashboard Microsoft Pdf
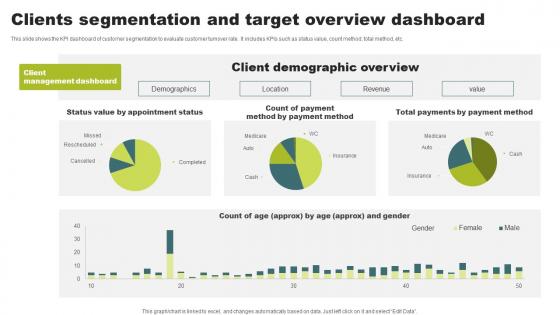
This slide shows the KPI dashboard of customer segmentation to evaluate customer turnover rate. It includes KPIs such as status value, count method, total method, etc. Showcasing this set of slides titled Clients Segmentation And Target Overview Dashboard Microsoft Pdf. The topics addressed in these templates are Client Demographic Overview, Revenue, Location. All the content presented in this PPT design is completely editable. Download it and make adjustments in color, background, font etc. as per your unique business setting.
Lead Metrics To Measure Business Operations Effectiveness Ppt Styles Graphics Pdf
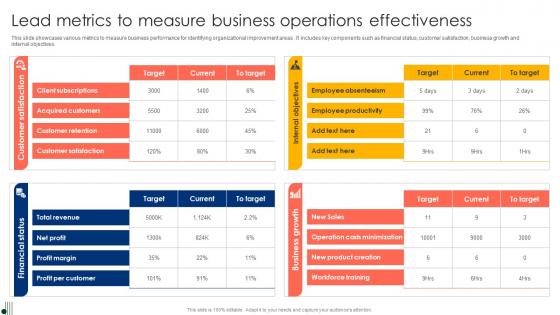
This slide showcases various metrics to measure business performance for identifying organizational improvement areas. It includes key components such as financial status, customer satisfaction, business growth and internal objectives. Pitch your topic with ease and precision using this Lead Metrics To Measure Business Operations Effectiveness Ppt Styles Graphics Pdf. This layout presents information on Financial Status, Customer Satisfaction, Business Growth. It is also available for immediate download and adjustment. So, changes can be made in the color, design, graphics or any other component to create a unique layout.

Strategical And Tactical Planning Developing Appropriate Key Performance Indicators Brochure PDF
This template covers appropriate key performance areas and KPIs for strategic execution. Performance areas that need to be monitored are financial point of view, customers and market, internal business processes, sustainable learning and growth etc. Deliver an awe inspiring pitch with this creative Strategical And Tactical Planning Developing Appropriate Key Performance Indicators Brochure PDF bundle. Topics like Performance Areas, Key Performance Indicators, Financial can be discussed with this completely editable template. It is available for immediate download depending on the needs and requirements of the user.
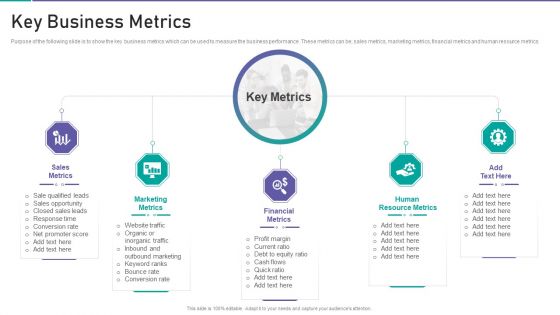
Corporate Organization Playbook Key Business Metrics Ppt Inspiration Elements PDF
Purpose of the following slide is to show the key business metrics which can be used to measure the business performance. These metrics can be sales metrics, marketing metrics, financial metrics and human resource metrics. Presenting corporate organization playbook key business metrics ppt inspiration elements pdf to provide visual cues and insights. Share and navigate important information on five stages that need your due attention. This template can be used to pitch topics like sales metrics, marketing metrics, financial metrics, human resource metrics. In addtion, this PPT design contains high resolution images, graphics, etc, that are easily editable and available for immediate download.
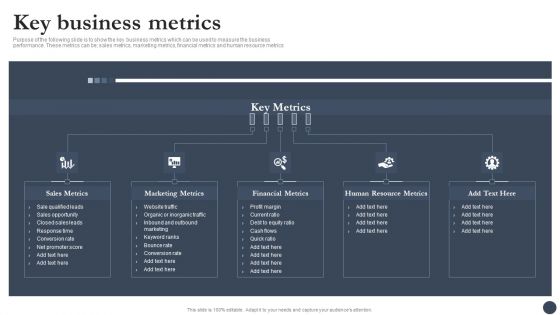
Strategic Playbook For Enterprise Administration Key Business Metrics Diagrams PDF
Purpose of the following slide is to show the key business metrics which can be used to measure the business performance. These metrics can be sales metrics, marketing metrics, financial metrics and human resource metrics. This is a Strategic Playbook For Enterprise Administration Key Business Metrics Diagrams PDF template with various stages. Focus and dispense information on five stages using this creative set, that comes with editable features. It contains large content boxes to add your information on topics like Marketing Metrics, Financial Metrics, Human Resource Metrics. You can also showcase facts, figures, and other relevant content using this PPT layout. Grab it now.
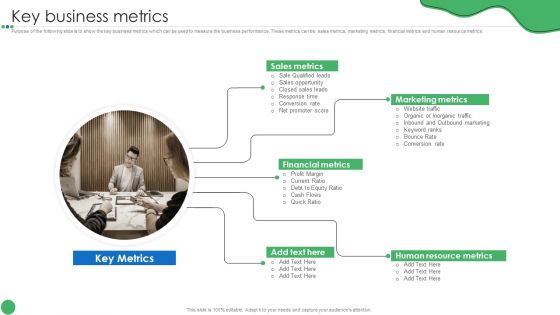
Key Business Metrics Guide To Enhance Organic Growth By Advancing Business Procedures Professional PDF
Purpose of the following slide is to show the key business metrics which can be used to measure the business performance. These metrics can be sales metrics, marketing metrics, financial metrics and human resource metrics.This is a Key Business Metrics Guide To Enhance Organic Growth By Advancing Business Procedures Professional PDF template with various stages. Focus and dispense information on five stages using this creative set, that comes with editable features. It contains large content boxes to add your information on topics like Marketing Metrics, Financial Metrics, Human Resource. You can also showcase facts, figures, and other relevant content using this PPT layout. Grab it now.
Metrics Scorecard With Internal Objectives And Customer Satisfaction Icons PDF
The purpose of this slide is to showcase different KPIs for company business. Information covered in this slide is related to financial status, business growth, internal objectives and customer satisfaction. Showcasing this set of slides titled Metrics Scorecard With Internal Objectives And Customer Satisfaction Icons PDF. The topics addressed in these templates are Financial Status, Customer Satisfaction, Internal Objectives. All the content presented in this PPT design is completely editable. Download it and make adjustments in color, background, font etc. as per your unique business setting.
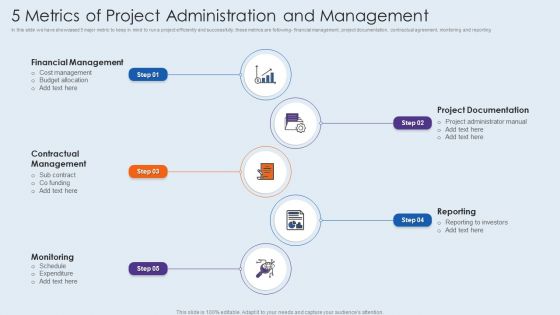
5 Metrics Of Project Administration And Management Structure PDF
In this slide we have showcased 5 major metric to keep in mind to run a project efficiently and successfully, these metrics are following financial management, project documentation, contractual agreement, monitoring and reporting. Persuade your audience using this 5 metrics of project administration and management structure pdf. This PPT design covers five stages, thus making it a great tool to use. It also caters to a variety of topics including financial management, contractual management, monitoring. Download this PPT design now to present a convincing pitch that not only emphasizes the topic but also showcases your presentation skills.
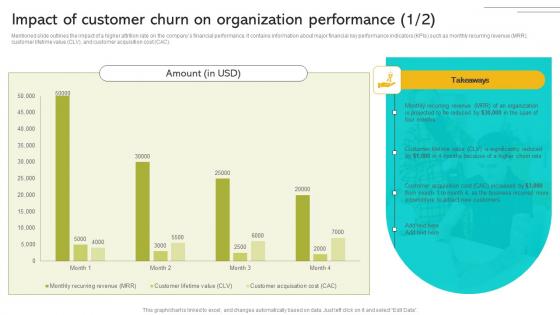
Implementing Strategies To Enhance Impact Of Customer Churn On Organization Performance Infographics PDF
Mentioned slide outlines the impact of a higher attrition rate on the companys financial performance. It contains information about major financial key performance indicators KPIs such as monthly recurring revenue MRR, customer lifetime value CLV, and customer acquisition cost CAC. Make sure to capture your audiences attention in your business displays with our gratis customizable Implementing Strategies To Enhance Impact Of Customer Churn On Organization Performance Infographics PDF These are great for business strategies, office conferences, capital raising or task suggestions. If you desire to acquire more customers for your tech business and ensure they stay satisfied, create your own sales presentation with these plain slides.
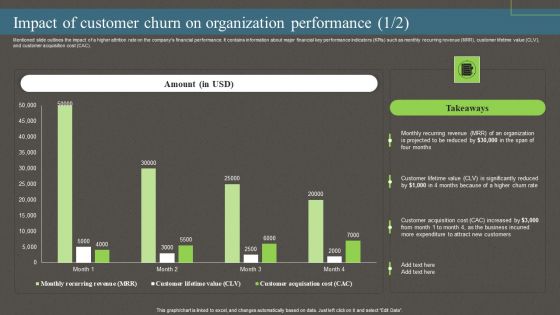
Impact Of Customer Churn On Organization Performance Ppt PowerPoint Presentation File Pictures PDF
Mentioned slide outlines the impact of a higher attrition rate on the companys financial performance. It contains information about major financial key performance indicators KPIs such as monthly recurring revenue MRR, customer lifetime value CLV, and customer acquisition cost CAC. The best PPT templates are a great way to save time, energy, and resources. Slidegeeks have 100 percent editable powerpoint slides making them incredibly versatile. With these quality presentation templates, you can create a captivating and memorable presentation by combining visually appealing slides and effectively communicating your message. Download Impact Of Customer Churn On Organization Performance Ppt PowerPoint Presentation File Pictures PDF from Slidegeeks and deliver a wonderful presentation.
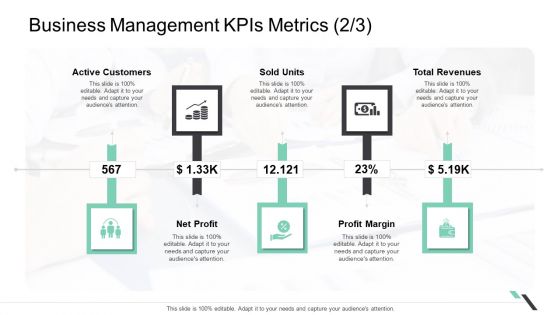
Business Management Kpis Metrics Net Profit Ppt Show Structure PDF
Presenting business management kpis metrics net profit ppt show structure pdf. to provide visual cues and insights. Share and navigate important information on five stages that need your due attention. This template can be used to pitch topics like active customers sold units, total revenues, profit margin, net profit. In addtion, this PPT design contains high resolution images, graphics, etc, that are easily editable and available for immediate download.

Successful Mobile Strategies For Business App Metrics Dashboard Microsoft PDF
Presenting successful mobile strategies for business app metrics dashboard microsoft pdf to provide visual cues and insights. Share and navigate important information on six stages that need your due attention. This template can be used to pitch topics like app metrics dashboard. In addtion, this PPT design contains high resolution images, graphics, etc, that are easily editable and available for immediate download.
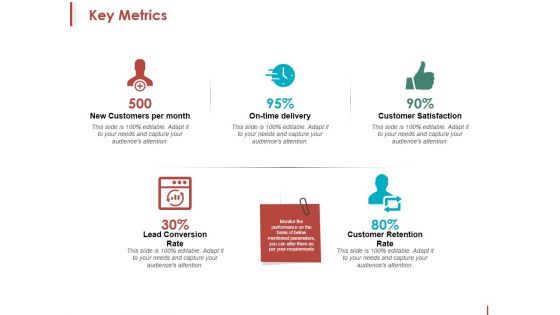
Key Metrics Ppt PowerPoint Presentation Inspiration Format
This is a key metrics ppt powerpoint presentation inspiration format. This is a five stage process. The stages in this process are new customers per month, on time delivery, customer satisfaction, customer retention rate.

Business Meeting Plan With Discussion Areas Diagrams PDF
The following slide outlines the corporate meeting plan with discussion areas. This includes components such as calibration, financial metrics and company building and updates and the name of the presenter and the timeline.Showcasing this set of slides titled business meeting plan with discussion areas diagrams pdf The topics addressed in these templates are financial metrics, company building and updates, calibration All the content presented in this PPT design is completely editable. Download it and make adjustments in color, background, font etc. as per your unique business setting.
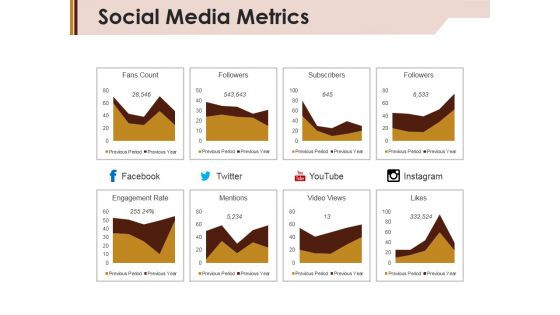
Social Media Metrics Ppt PowerPoint Presentation Ideas Graphics Example
This is a social media metrics ppt powerpoint presentation ideas graphics example. This is a eight stage process. The stages in this process are fans count, followers, subscribers, engagement rate.

HR Scoreboard Call Center Template PDF
The purpose of this slide is to outline the balanced HR scorecard in order to monitor day-to-day key operations. It includes several key performance indicators such as financial, customer, organizational structure, and capacity. Showcasing this set of slides titled HR Scoreboard Call Center Template PDF. The topics addressed in these templates are Financial Sustainability, Customer Experience, Internal Structures. All the content presented in this PPT design is completely editable. Download it and make adjustments in color, background, font etc. as per your unique business setting.
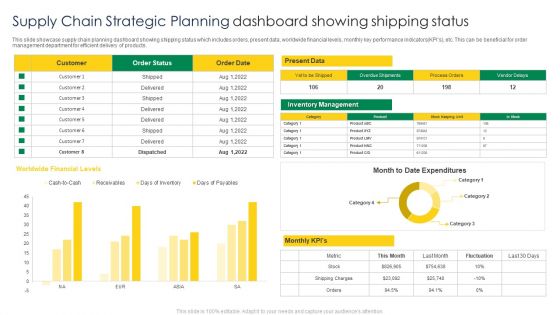
Supply Chain Strategic Planning Dashboard Showing Shipping Status Structure PDF
This slide showcase supply chain planning dashboard showing shipping status which includes orders, present data, worldwide financial levels, monthly key performance indicators KPIs, etc. This can be beneficial for order management department for efficient delivery of products. Showcasing this set of slides titled Supply Chain Strategic Planning Dashboard Showing Shipping Status Structure PDF. The topics addressed in these templates are Worldwide Financial Levels, Present Data, Customer. All the content presented in this PPT design is completely editable. Download it and make adjustments in color, background, font etc. as per your unique business setting.
Social Media And Word Of Mouth Metrics Ppt PowerPoint Presentation Model Icon
This is a social media and word of mouth metrics ppt powerpoint presentation model icon. This is a two stage process. The stages in this process are finance, management, strategy, analysis, marketing.

Social Media And Word Of Mouth Metrics Ppt PowerPoint Presentation Layouts Graphics
This is a social media and word of mouth metrics ppt powerpoint presentation layouts graphics. This is a three stage process. The stages in this process are finance, marketing, management, investment, analysis.
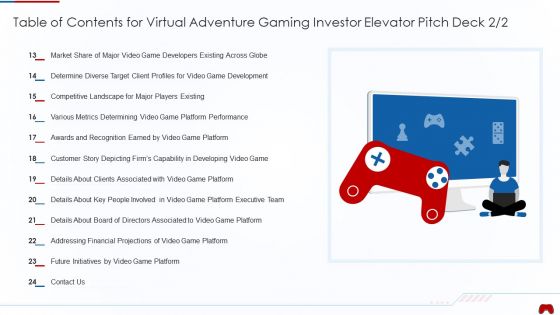
Table Of Contents For Virtual Adventure Gaming Investor Elevator Pitch Deck Capability Professional PDF
This slide caters details about financial projections of video game platform progress for next years with gross profit, EBITDA, Y or Y growth, net income. Deliver and pitch your topic in the best possible manner with this table of contents for virtual adventure gaming investor elevator pitch deck capability professional pdf. Use them to share invaluable insights on financial projections, capability, developing, metrics, competitive landscape, target and impress your audience. This template can be altered and modified as per your expectations. So, grab it now.

 Home
Home