Data Architecture Diagram
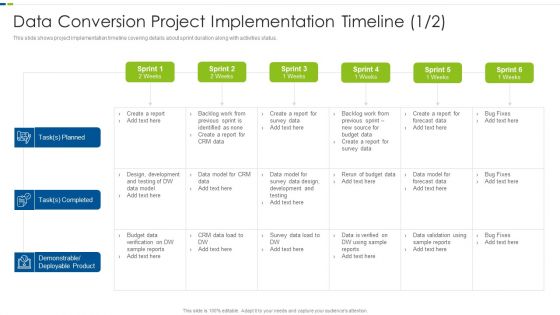
Utilizing Agile Methodology In Data Transformation Project IT Data Conversion Project Implementation Diagrams PDF
This slide shows project implementation timeline covering details about sprint duration along with activities status. Deliver and pitch your topic in the best possible manner with this utilizing agile methodology in data transformation project it data conversion project implementation diagrams pdf. Use them to share invaluable insights on planned, budget, survey data, development, design and impress your audience. This template can be altered and modified as per your expectations. So, grab it now.
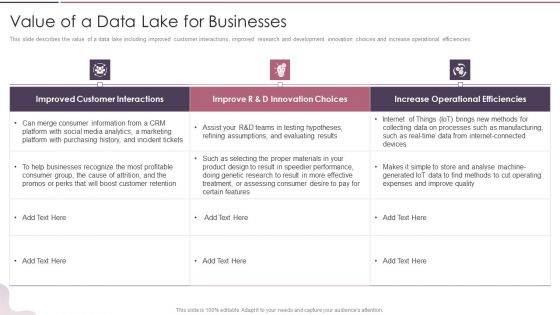
Data Lake Development With Azure Cloud Software Value Of A Data Lake For Businesses Diagrams PDF
This slide describes the value of a data lake including improved customer interactions, improved research and development innovation choices and increase operational efficiencies. Deliver and pitch your topic in the best possible manner with this Data Lake Development With Azure Cloud Software Value Of A Data Lake For Businesses Diagrams PDF. Use them to share invaluable insights on Teams, Product Design, Materials and impress your audience. This template can be altered and modified as per your expectations. So, grab it now.
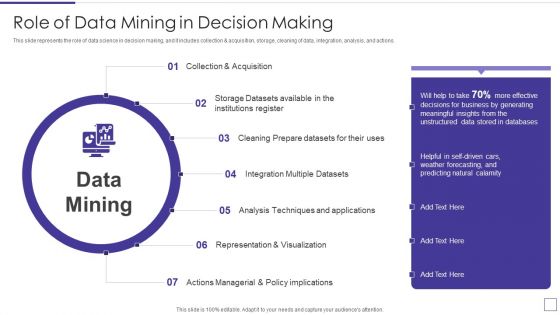
Data Mining Implementation Role Of Data Mining In Decision Making Diagrams PDF
This slide represents the role of data science in decision making, and it includes collection and acquisition, storage, cleaning of data, integration, analysis, and actions.Presenting data mining implementation role of data mining in decision making diagrams pdf to provide visual cues and insights. Share and navigate important information on seven stages that need your due attention. This template can be used to pitch topics like collection and acquisition, cleaning prepare datasets, integration multiple datasets In addtion, this PPT design contains high resolution images, graphics, etc, that are easily editable and available for immediate download.
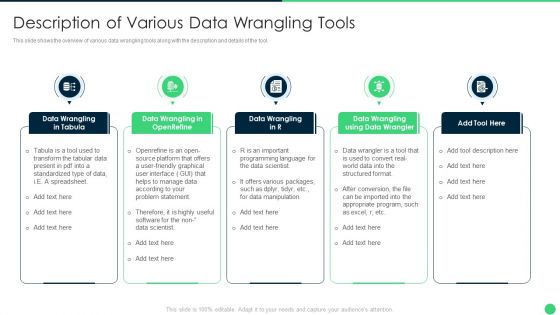
Effective Data Management To Description Of Various Data Wrangling Tools Diagrams PDF
This slide shows the overview of various data wrangling tools along with the description and details of the tool. Presenting Effective Data Management To Description Of Various Data Wrangling Tools Diagrams PDF to provide visual cues and insights. Share and navigate important information on five stages that need your due attention. This template can be used to pitch topics like Enriching Data, Incorporating And Linking, Information To Provide In addtion, this PPT design contains high resolution images, graphics, etc, that are easily editable and available for immediate download.
Data Lake Implementation What Are The Benefits Of A Data Lake Diagrams PDF
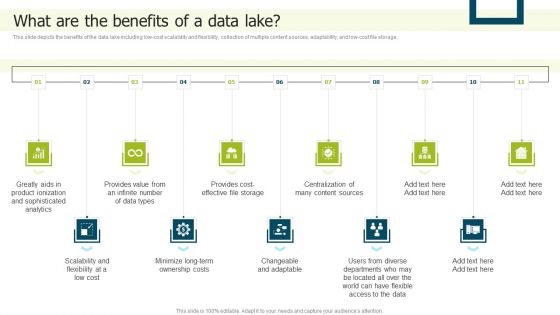
This slide depicts the benefits of the data lake including low-cost scalability and flexibility, collection of multiple content sources, adaptability, and low-cost file storage. Do you have an important presentation coming up Are you looking for something that will make your presentation stand out from the rest Look no further than Data Lake Implementation What Are The Benefits Of A Data Lake Diagrams PDF. With our professional designs, you can trust that your presentation will pop and make delivering it a smooth process. And with Slidegeeks, you can trust that your presentation will be unique and memorable. So why wait Grab Data Lake Implementation What Are The Benefits Of A Data Lake Diagrams PDF today and make your presentation stand out from the rest.

Toolkit For Data Science And Analytics Transition RACI Matrix For Analyzing Data In Project Diagrams PDF
The slide explains the RACI Matrix with the roles on vertical axis and tasks on horizontal axis for executing data analytics project. Explore a selection of the finest Toolkit For Data Science And Analytics Transition RACI Matrix For Analyzing Data In Project Diagrams PDF here. With a plethora of professionally designed and pre made slide templates, you can quickly and easily find the right one for your upcoming presentation. You can use our Toolkit For Data Science And Analytics Transition RACI Matrix For Analyzing Data In Project Diagrams PDF to effectively convey your message to a wider audience. Slidegeeks has done a lot of research before preparing these presentation templates. The content can be personalized and the slides are highly editable. Grab templates today from Slidegeeks.

Data And Analytics Playbook How To Overcome Automated Data Analysis Powered By Ml Diagrams PDF
This template illustrates that automated discovery of insights utilizes machine learning algorithms to analyze billions of data points in seconds to perform complex segmentation, anomaly detection, and trend-based analysis without coding. This is a Data And Analytics Playbook How To Overcome Automated Data Analysis Powered By Ml Diagrams PDF template with various stages. Focus and dispense information on one stages using this creative set, that comes with editable features. It contains large content boxes to add your information on topics like Self Service Analytics Software, Top Recommendations, Explore Segment. You can also showcase facts, figures, and other relevant content using this PPT layout. Grab it now.
Data Monetization And Management Statistics Related To Power Of Data Diagrams PDF
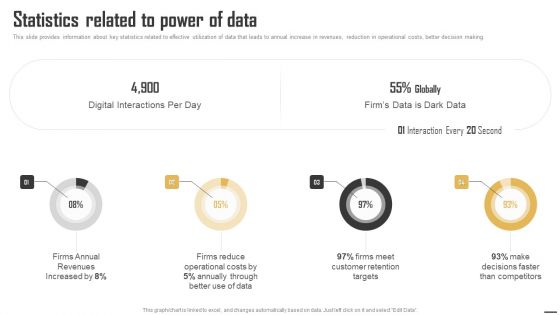
This slide provides information about key statistics related to effective utilization of data that leads to annual increase in revenues, reduction in operational costs, better decision making. Find a pre-designed and impeccable Data Monetization And Management Statistics Related To Power Of Data Diagrams PDF. The templates can ace your presentation without additional effort. You can download these easy-to-edit presentation templates to make your presentation stand out from others. So, what are you waiting for Download the template from Slidegeeks today and give a unique touch to your presentation.
Application Of Data Lineage In Different Industries Deploying Data Lineage IT Diagrams PDF
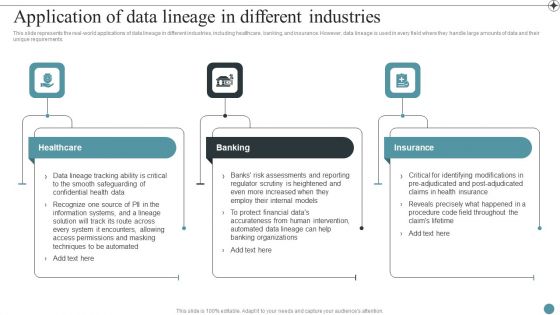
This slide represents the real-world applications of data lineage in different industries, including healthcare, banking, and insurance. However, data lineage is used in every field where they handle large amounts of data and their unique requirements.Take your projects to the next level with our ultimate collection of Application Of Data Lineage In Different Industries Deploying Data Lineage IT Diagrams PDF. Slidegeeks has designed a range of layouts that are perfect for representing task or activity duration, keeping track of all your deadlines at a glance. Tailor these designs to your exact needs and give them a truly corporate look with your own brand colors they all make your projects stand out from the rest.
Principles Of Linked Data System Integrating Linked Data To Enhance Operational Effectiveness Diagrams PDF
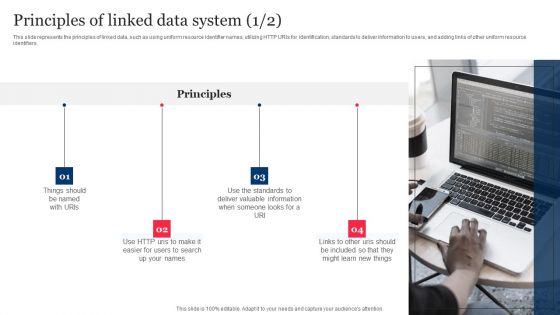
This slide represents the principles of linked data, such as using uniform resource identifier names, utilizing HTTP URIs for identification, standards to deliver information to users, and adding links of other uniform resource identifiers.If your project calls for a presentation, then Slidegeeks is your go-to partner because we have professionally designed, easy-to-edit templates that are perfect for any presentation. After downloading, you can easily edit Principles Of Linked Data System Integrating Linked Data To Enhance Operational Effectiveness Diagrams PDF and make the changes accordingly. You can rearrange slides or fill them with different images. Check out all the handy templates.
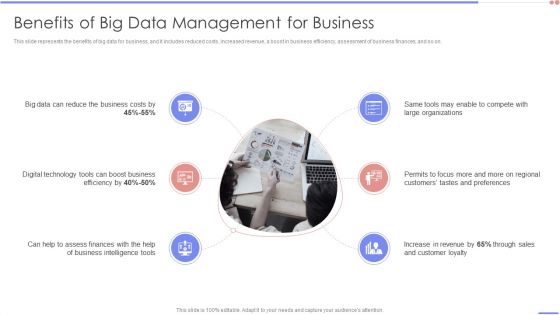
Data Analytics Management Benefits Of Big Data Management For Business Diagrams PDF
This slide represents the benefits of big data for business, and it includes reduced costs, increased revenue, a boost in business efficiency, assessment of business finances, and so on.Presenting Data Analytics Management Benefits Of Big Data Management For Business Diagrams PDF to provide visual cues and insights. Share and navigate important information on six stages that need your due attention. This template can be used to pitch topics like Digital Technology, Reduce Business, Large Organizations. In addtion, this PPT design contains high resolution images, graphics, etc, that are easily editable and available for immediate download.
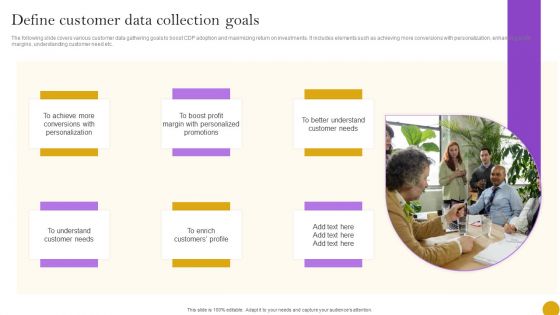
Comprehensive Customer Data Platform Guide Optimizing Promotional Initiatives Define Customer Data Collection Goals Diagrams PDF
The following slide covers various customer data gathering goals to boost CDP adoption and maximizing return on investments. It includes elements such as achieving more conversions with personalization, enhancing profit margins, understanding customer need etc. Retrieve professionally designed Comprehensive Customer Data Platform Guide Optimizing Promotional Initiatives Define Customer Data Collection Goals Diagrams PDF to effectively convey your message and captivate your listeners. Save time by selecting pre made slideshows that are appropriate for various topics, from business to educational purposes. These themes come in many different styles, from creative to corporate, and all of them are easily adjustable and can be edited quickly. Access them as PowerPoint templates or as Google Slides themes. You do not have to go on a hunt for the perfect presentation because Slidegeeks got you covered from everywhere.
Effective Data Arrangement For Data Accessibility And Processing Readiness Data Preparation Process Step 3 Cleanse And Validate Data Icons PDF
Presenting effective data arrangement for data accessibility and processing readiness data preparation process step 3 cleanse and validate data icons pdf to provide visual cues and insights. Share and navigate important information on four stages that need your due attention. This template can be used to pitch topics like data preparation process step 3 cleanse and validate data. In addtion, this PPT design contains high resolution images, graphics, etc, that are easily editable and available for immediate download.
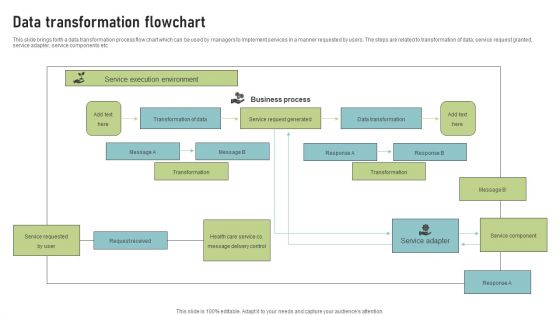
Data Transformation Flowchart Themes PDF
This slide brings forth a data transformation process flow chart which can be used by managers to implement services in a manner requested by users. The steps are related to transformation of data, service request granted, service adapter, service components etc. Persuade your audience using this Data Transformation Flowchart Themes PDF. This PPT design covers One stages, thus making it a great tool to use. It also caters to a variety of topics including Service Execution Environment, Business Process, Data Transformation. Download this PPT design now to present a convincing pitch that not only emphasizes the topic but also showcases your presentation skills.

Quarterly Data Analytics Roadmap Pictures
Introducing our quarterly data analytics roadmap pictures. This PPT presentation is Google Slides compatible, therefore, you can share it easily with the collaborators for measuring the progress. Also, the presentation is available in both standard screen and widescreen aspect ratios. So edit the template design by modifying the font size, font type, color, and shapes as per your requirements. As this PPT design is fully editable it can be presented in PDF, JPG and PNG formats.
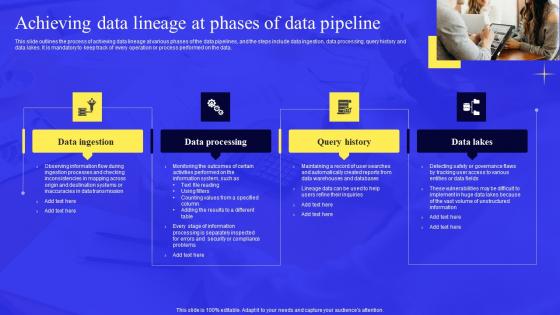
Business Process Data Lineage Achieving Data Lineage At Phases Of Data Pipeline Portrait Pdf
This slide outlines the process of achieving data lineage at various phases of the data pipelines, and the steps include data ingestion, data processing, query history and data lakes. It is mandatory to keep track of every operation or process performed on the data. Create an editable Business Process Data Lineage Achieving Data Lineage At Phases Of Data Pipeline Portrait Pdf that communicates your idea and engages your audience. Whether you are presenting a business or an educational presentation, pre designed presentation templates help save time. Business Process Data Lineage Achieving Data Lineage At Phases Of Data Pipeline Portrait Pdf is highly customizable and very easy to edit, covering many different styles from creative to business presentations. Slidegeeks has creative team members who have crafted amazing templates. So, go and get them without any delay.
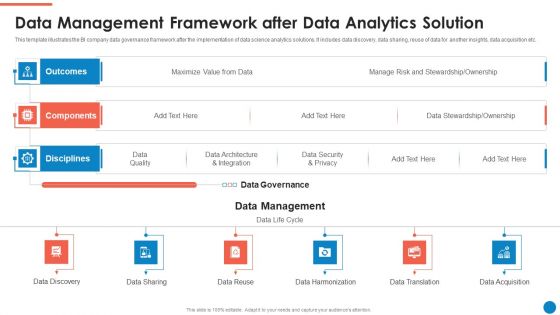
Data And Analytics Playbook Data Management Framework After Data Analytics Solution Designs PDF
This template illustrates the BI company data governance framework after the implementation of data science analytics solutions. It includes data discovery, data sharing, reuse of data for another insights, data acquisition etc. Deliver an awe inspiring pitch with this creative Data And Analytics Playbook Data Management Framework After Data Analytics Solution Designs PDF bundle. Topics like Outcomes, Components, Disciplines, Data Management, Data Governance can be discussed with this completely editable template. It is available for immediate download depending on the needs and requirements of the user.

Data Preparation Infrastructure And Phases Data Preparation Steps Involved In Data Preprocessing Brochure PDF
This slide shows the various steps that are involved in data preprocessing such as data cleaning, data integration, data transformation and data reduction. Presenting Data Preparation Infrastructure And Phases Data Preparation Steps Involved In Data Preprocessing Brochure PDF to provide visual cues and insights. Share and navigate important information on four stages that need your due attention. This template can be used to pitch topics like Data Cleaning, Data Transformation, Data Reduction In addtion, this PPT design contains high resolution images, graphics, etc, that are easily editable and available for immediate download.

Approaches To Execute Data Integration Data Virtualization Data Analytics SS V
This slide explains data virtualization aimed at providing businesses with unified data view by combing the same from various platforms. It covers description as well as illustration explaining working of data virtualization.If you are looking for a format to display your unique thoughts, then the professionally designed Approaches To Execute Data Integration Data Virtualization Data Analytics SS V is the one for you. You can use it as a Google Slides template or a PowerPoint template. Incorporate impressive visuals, symbols, images, and other charts. Modify or reorganize the text boxes as you desire. Experiment with shade schemes and font pairings. Alter, share or cooperate with other people on your work. Download Approaches To Execute Data Integration Data Virtualization Data Analytics SS V and find out how to give a successful presentation. Present a perfect display to your team and make your presentation unforgettable.
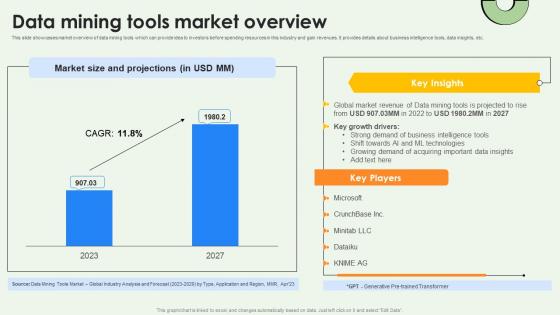
Data Mining Tools Market Overview Data Warehousing And Data Mining Guide AI SS V
This slide showcases market overview of data mining tools which can provide idea to investors before spending resources in this industry and gain revenues. It provides details about business intelligence tools, data insights, etc. This Data Mining Tools Market Overview Data Warehousing And Data Mining Guide AI SS V is perfect for any presentation, be it in front of clients or colleagues. It is a versatile and stylish solution for organizing your meetings. The Data Mining Tools Market Overview Data Warehousing And Data Mining Guide AI SS V features a modern design for your presentation meetings. The adjustable and customizable slides provide unlimited possibilities for acing up your presentation. Slidegeeks has done all the homework before launching the product for you. So, do not wait, grab the presentation templates today

Data Mining Techniques Clustering Method Data Warehousing And Data Mining Guide AI SS V
This slide showcases clustering data mining technique to help data experts ease their data sorting tasks to get actionable insights. It provides details about partitioning, hierarchal, density, grid, etc. If you are looking for a format to display your unique thoughts, then the professionally designed Data Mining Techniques Clustering Method Data Warehousing And Data Mining Guide AI SS V is the one for you. You can use it as a Google Slides template or a PowerPoint template. Incorporate impressive visuals, symbols, images, and other charts. Modify or reorganize the text boxes as you desire. Experiment with shade schemes and font pairings. Alter, share or cooperate with other people on your work. Download Data Mining Techniques Clustering Method Data Warehousing And Data Mining Guide AI SS V and find out how to give a successful presentation. Present a perfect display to your team and make your presentation unforgettable.
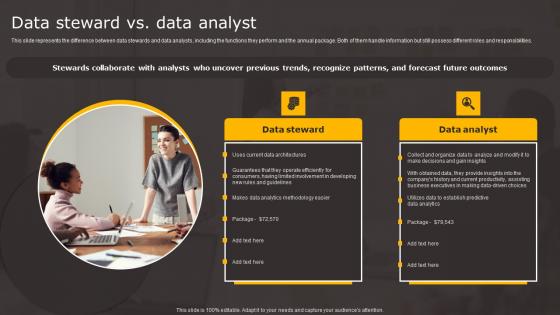
Data Stewardship In Business Processes Data Steward Vs Data Analyst Themes Pdf
This slide represents the difference between data stewards and data analysts, including the functions they perform and the annual package. Both of them handle information but still possess different roles and responsibilities. Find a pre designed and impeccable Data Stewardship In Business Processes Data Steward Vs Data Analyst Themes Pdf. The templates can ace your presentation without additional effort. You can download these easy to edit presentation templates to make your presentation stand out from others. So, what are you waiting for Download the template from Slidegeeks today and give a unique touch to your presentation.

Data Stewardship In Business Processes Data Object Or Domain Data Themes Pdf
This slide describes the data object steward or domain data steward, including its job description, example, key characteristics and considerations. It also caters to the type of reference data and attributes it manages, such as company structure, address, company code, contact details and financial data. Do you know about Slidesgeeks Data Stewardship In Business Processes Data Object Or Domain Data Themes Pdf These are perfect for delivering any kind od presentation. Using it, create PowerPoint presentations that communicate your ideas and engage audiences. Save time and effort by using our pre designed presentation templates that are perfect for a wide range of topic. Our vast selection of designs covers a range of styles, from creative to business, and are all highly customizable and easy to edit. Download as a PowerPoint template or use them as Google Slides themes.

Data Mining Implementation Phases Of Data Mining Data Preparation Structure PDF
This slide depicts the data preparation phase of data science, including its various stages such as raw data, structure data, data preprocessing, EDA, etc.Presenting data mining implementation phases of data mining data preparation structure pdf to provide visual cues and insights. Share and navigate important information on five stages that need your due attention. This template can be used to pitch topics like essential process, divided into two phases, data preprocessing consists In addtion, this PPT design contains high resolution images, graphics, etc, that are easily editable and available for immediate download.

Comprehensive Analysis Of Different Data Lineage Classification Achieving Data Lineage At Phases Data Structure PDF
This slide outlines the process of achieving data lineage at various phases of the data pipelines, and the steps include data ingestion, data processing, query history and data lakes. It is mandatory to keep track of every operation or process performed on the data. Create an editable Comprehensive Analysis Of Different Data Lineage Classification Achieving Data Lineage At Phases Data Structure PDF that communicates your idea and engages your audience. Whether you are presenting a business or an educational presentation, pre designed presentation templates help save time. Comprehensive Analysis Of Different Data Lineage Classification Achieving Data Lineage At Phases Data Structure PDF is highly customizable and very easy to edit, covering many different styles from creative to business presentations. Slidegeeks has creative team members who have crafted amazing templates. So, go and get them without any delay.
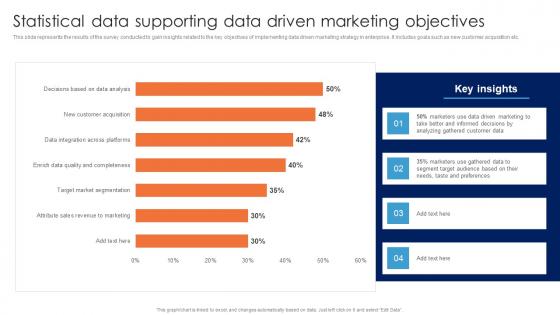
Statistical Data Supporting Data Driven Marketing Objectives Guide For Data Driven Advertising Elements Pdf
This slide represents the results of the survey conducted to gain insights related to the key objectives of implementing data driven marketing strategy in enterprise. It includes goals such as new customer acquisition etc.The Statistical Data Supporting Data Driven Marketing Objectives Guide For Data Driven Advertising Elements Pdf is a compilation of the most recent design trends as a series of slides. It is suitable for any subject or industry presentation, containing attractive visuals and photo spots for businesses to clearly express their messages. This template contains a variety of slides for the user to input data, such as structures to contrast two elements, bullet points, and slides for written information. Slidegeeks is prepared to create an impression.

Linked Data Visualization Data Quality Dashboard For Linked Data Pictures PDF
This slide describes the data quality dashboard for linked data by covering details of account information quality, contact details quality, financial data quality, and missing account information. Create an editable Linked Data Visualization Data Quality Dashboard For Linked Data Pictures PDF that communicates your idea and engages your audience. Whether youre presenting a business or an educational presentation, pre-designed presentation templates help save time. Linked Data Visualization Data Quality Dashboard For Linked Data Pictures PDF is highly customizable and very easy to edit, covering many different styles from creative to business presentations. Slidegeeks has creative team members who have crafted amazing templates. So, go and get them without any delay.

Data Mining Types Of Data Using Data Mining Tools To Optimize Processes AI SS V
This slide showcases various types of data which is potentially mined during data mining process, can be referred by various industrial experts. It provides details about data such as multimedia, text, web, spatiotemporal, etc. Retrieve professionally designed Data Mining Types Of Data Using Data Mining Tools To Optimize Processes AI SS V to effectively convey your message and captivate your listeners. Save time by selecting pre-made slideshows that are appropriate for various topics, from business to educational purposes. These themes come in many different styles, from creative to corporate, and all of them are easily adjustable and can be edited quickly. Access them as PowerPoint templates or as Google Slides themes. You do not have to go on a hunt for the perfect presentation because Slidegeeks got you covered from everywhere.
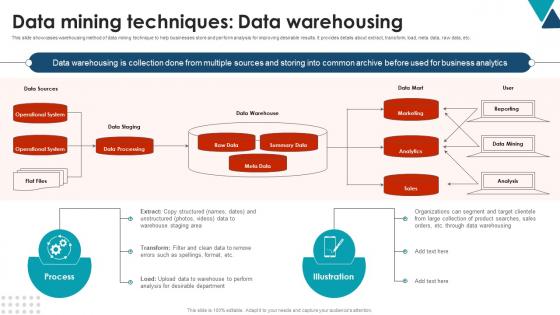
Data Mining Techniques Data Warehousing Using Data Mining Tools To Optimize Processes AI SS V
This slide showcases warehousing method of data mining technique to help businesses store and perform analysis for improving desirable results. It provides details about extract, transform, load, meta data, raw data, etc. Retrieve professionally designed Data Mining Techniques Data Warehousing Using Data Mining Tools To Optimize Processes AI SS V to effectively convey your message and captivate your listeners. Save time by selecting pre-made slideshows that are appropriate for various topics, from business to educational purposes. These themes come in many different styles, from creative to corporate, and all of them are easily adjustable and can be edited quickly. Access them as PowerPoint templates or as Google Slides themes. You do not have to go on a hunt for the perfect presentation because Slidegeeks got you covered from everywhere.
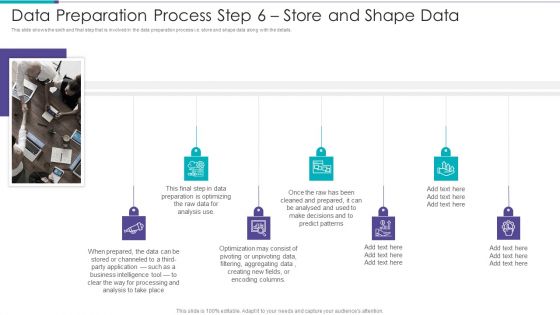
Data Preparation Infrastructure And Phases Data Preparation Process Step 6 Store And Shape Data Clipart PDF
This slide shows the sixth and final step that is involved in the data preparation process i.e. store and shape data along with the details.Presenting Data Preparation Infrastructure And Phases Data Preparation Process Step 6 Store And Shape Data Clipart PDF to provide visual cues and insights. Share and navigate important information on six stages that need your due attention. This template can be used to pitch topics like Enrichment Process, Similar Information, Enriching Data In addtion, this PPT design contains high resolution images, graphics, etc, that are easily editable and available for immediate download.

Data Preparation Infrastructure And Phases Implementing Data Preprocessing Handling Noisy Data Pictures PDF
This slide shows the different methods that can be used to handle the noisy data during the data preparation i.e. data binning, preprocessing in clustering, machine learning and removing manually.Presenting Data Preparation Infrastructure And Phases Implementing Data Preprocessing Handling Noisy Data Pictures PDF to provide visual cues and insights. Share and navigate important information on four stages that need your due attention. This template can be used to pitch topics like Preprocessing In Clustering, Machine Learning, Removing Manually In addtion, this PPT design contains high resolution images, graphics, etc, that are easily editable and available for immediate download.

Deploying Data Center Data Center Relocation Process Step 1 Assessing The Current Data Summary PDF
This slide shows the first step that is involved in data center relocation process which is to be implemented for minimizing data center costs and improving scalability i.e. assessing the current data center. Get a simple yet stunning designed Deploying Data Center Data Center Relocation Process Step 1 Assessing The Current Data Summary PDF. It is the best one to establish the tone in your meetings. It is an excellent way to make your presentations highly effective. So, download this PPT today from Slidegeeks and see the positive impacts. Our easy-to-edit Deploying Data Center Data Center Relocation Process Step 1 Assessing The Current Data Summary PDF can be your go-to option for all upcoming conferences and meetings. So, what are you waiting for Grab this template today.

Data Preparation Infrastructure And Phases Data Preparation Process Step 2 Discover And Access Data Brochure PDF
This slide shows the second step that is involved in the data preparation process i.e. discover and access data along with the details.Presenting Data Preparation Infrastructure And Phases Data Preparation Process Step 2 Discover And Access Data Brochure PDF to provide visual cues and insights. Share and navigate important information on seven stages that need your due attention. This template can be used to pitch topics like Preparation Process, Existing Catalogue, Analysts Aware In addtion, this PPT design contains high resolution images, graphics, etc, that are easily editable and available for immediate download.

Data Quality Dashboard For Linked Data Integrating Linked Data To Enhance Operational Template PDF
This slide describes the data quality dashboard for linked data by covering details of account information quality, contact details quality, financial data quality, and missing account information.This Data Quality Dashboard For Linked Data Integrating Linked Data To Enhance Operational Template PDF from Slidegeeks makes it easy to present information on your topic with precision. It provides customization options, so you can make changes to the colors, design, graphics, or any other component to create a unique layout. It is also available for immediate download, so you can begin using it right away. Slidegeeks has done good research to ensure that you have everything you need to make your presentation stand out. Make a name out there for a brilliant performance.

Using Data Science Technologies For Business Transformation Data Science With Data Analytics Formats PDF
This slide represents the difference between data science and data analytics based on skillset, scope, exploration and goals and how both will work together. Do you know about Slidesgeeks Using Data Science Technologies For Business Transformation Data Science With Data Analytics Formats PDF These are perfect for delivering any kind od presentation. Using it, create PowerPoint presentations that communicate your ideas and engage audiences. Save time and effort by using our pre designed presentation templates that are perfect for a wide range of topic. Our vast selection of designs covers a range of styles, from creative to business, and are all highly customizable and easy to edit. Download as a PowerPoint template or use them as Google Slides themes.

Business Diagram 3d Pie Chart With Arrows For Data Representation PowerPoint Slide
This business slide displays pie chart with timeline graphics. This diagram has been designed with graphic of with four arrows representing yearly data. Use this diagram, in your presentations to display process steps, stages, for business management.

Business Diagram 3d Thumb Chart And Tablet For Data Representation PowerPoint Slide
This business diagram displays graphic of 3d thumb up chart with icons on computer screen. This business slide contains the concept of business data representation. Use this diagram to build professional presentations for your viewers.
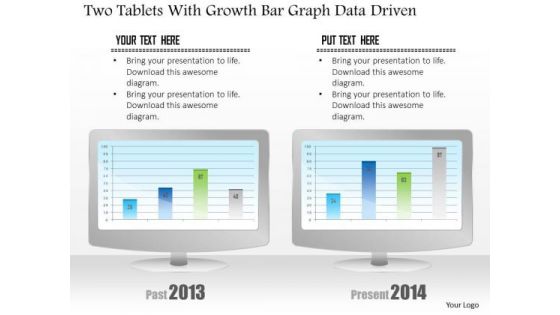
Business Diagram Two Tablets With Growth Bar Graph Data Driven PowerPoint Slide
This business diagram has been designed with comparative charts on tablets. This slide suitable for data representation. You can also use this slide to present business reports and information. Use this diagram to present your views in a wonderful manner.
Business Diagram Flask And Test Tubes For Data Driven PowerPoint Slide
This data driven diagram has been designed with flask and test tubes. Download this diagram to give your presentations more effective look. It helps in clearly conveying your message to clients and audience.
Business Diagram 3d Capsule With Multiple Icons For Business Data Flow PowerPoint Slide
This diagram has been designed with 3d graphic of capsule with multiple icons. This data driven PowerPoint slide can be used to give your presentations more effective look. It helps in clearly conveying your message to clients and audience.

Business Diagram Three Heads With Pie For Data Driven Technology PowerPoint Slide
This business diagram displays three human faces with pie charts. This Power Point template has been designed to compare and present business data. You may use this diagram to impart professional appearance to your presentations.
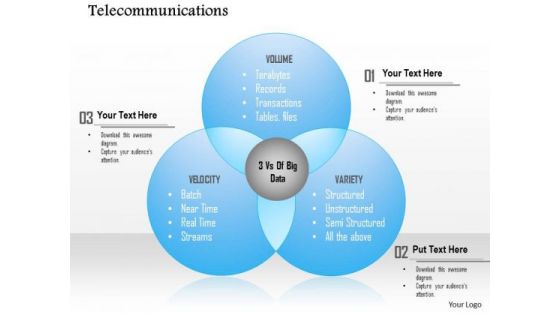
Business Diagram Three Vs Of Big Data Volume Velocity Variety Presentation Template
Blue colored Venn diagram has been used to design this slide. This Venn diagram represented the three Vs of data technology. We have displayed volume, velocity and variety of any big data. Use this PPT slide for data related presentations.
Business Diagram Exponentially Growing Big Data With Icons Surrounding Cloud Ppt Slide
This slide contains the graphic of clouds and icons. This diagram has been designed with concept of big data growth. This diagram displays the exponential growth of data analysis. Use this diagram slide for your data technology related presentations.

Business Diagram 3d Bulb Graphic For Data Driven And Idea Generation PowerPoint Slide
This Power Point template has been designed with 3d bulb graphic. Use this slide to represent technology idea and strategy concepts. Download this diagram for your business presentations and get exclusive comments on your efforts.
Business Diagram Icons Of Big Data Content Surrounding A Public Of Private Cloud Ppt Slide
This diagram has been designed with graphic of big data icons. This technology slide contains the concept of data transfer. Display public and private data transfer with cloud technology. Download this diagram to make technical presentations.

Business Diagram Map Shuffle Reduce Phases Shown In Big Data Analytic Processing Ppt Slide
This technology slide has been designed with graphic of map and data text. This diagram helps to depict concept of data analysis and processing. Use this diagram slide for computer technology related presentations.
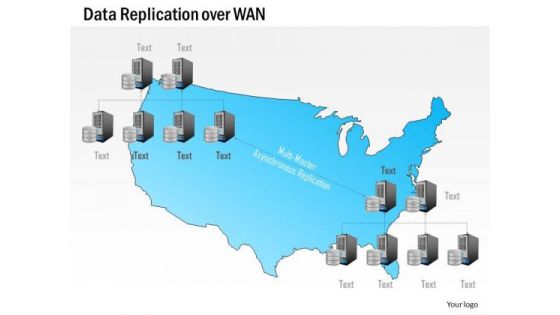
Business Diagram Data Replication Over Wan Wide Area Network Geographic Locations Ppt Slide
This technology diagram has been designed with graphic of map and wide area network. This professional slide helps to depict the concept of data replication over the wide area network. This diagram slide can be used for data networking related topics.
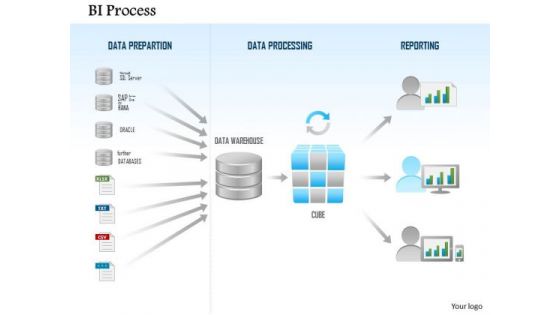
Business Diagram Business Intelligence Process Data Preparation Processing Reporting Ppt Slide
This technology diagram has been designed with graphic of computer server and databases with connectivity. This slide depicts the concept of business intelligence for data preparation. Download this diagram to build professional presentations.
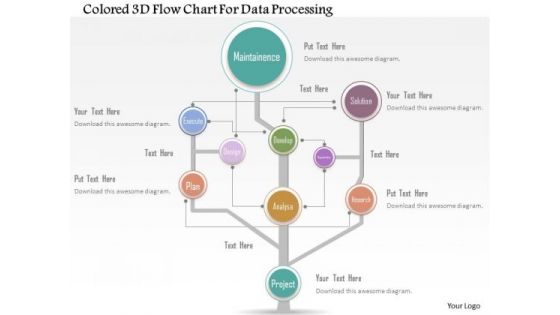
Business Diagram Colored 3d Flow Chart For Data Processing Presentation Template
Colored 3d flow chart has been used to design this power point template. This PPT contains the concept of data processing. Use this PPT for your data communication and analysis related presentations.
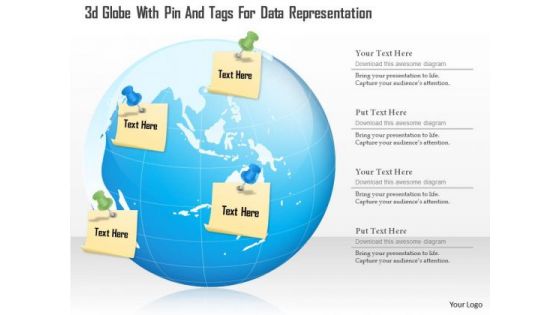
Business Diagram 3d Globe With Pin And Tags For Data Representation Presentation Template
This business diagram has been designed with graphic of 3d globe with pin and tags. This slide helps to depict concept of global communication. Download this diagram slide to make professional presentations.

Stages Triangular Shaped Donut Diagram Data Comparison It Business Plan PowerPoint Templates
We present our stages triangular shaped donut diagram data comparison it business plan PowerPoint templates.Present our Business PowerPoint Templates because Our PowerPoint Templates and Slides will let you meet your Deadlines. Use our Construction PowerPoint Templates because Our PowerPoint Templates and Slides will let you Clearly mark the path for others to follow. Download and present our Triangles PowerPoint Templates because Our PowerPoint Templates and Slides have the Brilliant backdrops. Guaranteed to illuminate the minds of your audience. Present our Pyramids PowerPoint Templates because Our PowerPoint Templates and Slides will provide you a launch platform. Give a lift off to your ideas and send them into orbit. Use our Shapes PowerPoint Templates because Our PowerPoint Templates and Slides will definately Enhance the stature of your presentation. Adorn the beauty of your thoughts with their colourful backgrounds.Use these PowerPoint slides for presentations relating to 3d, chart, shape, part, icon, design, diagram, layout, vector, cone, triangular, isolated, tower, model, conical, triangle, sign, column, architectural, glossy, symbol, scheme, graphic, drawing, illustration, geometric, figure, three, colour, shiny, illustrated, dimensional, clipart, architecture, color, clip, picture, art, 3, background, image. The prominent colors used in the PowerPoint template are Blue , Green, Yellow.

Business Diagram Big Data Analysis Using Magnifying Glass Analysis Ppt Slide
This unique diagram has been designed with graphic of magnifier on blue color text of bag data. This slide depicts concept of big data analysis. This professional diagram can be used for data communication and analysis related topics.
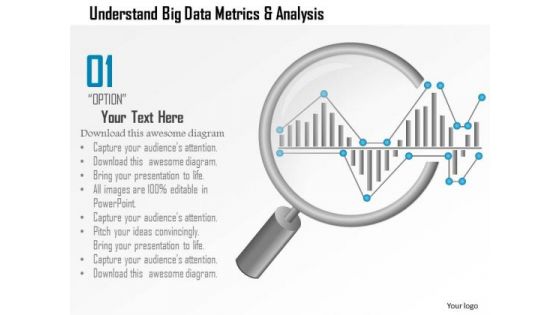
Business Diagram Understand Big Data Metrics And Analysis Showing By Magnifying Glass Ppt Slide
This PPT slide has been designed with big data metrics and magnifying glass. This diagram helps to portray concept of data analysis and data search. Download this diagram to make professional presentations.
Business Diagram Big Data Words Written In Puzzle Pieces Presentation Template
Our above diagram presents big data words written in puzzle pieces. Graphic of white puzzle with big data words has been used to design this diagram. This slide contains the word big data made with puzzles. Use this diagram for your data technology related presentations.

Business Diagram Three Staged Vertical Process For Data Representation Presentation Template
Three staged vertical process diagram has been used to craft this power point template diagram. This PPT contains the concept of data representation. Use this PPT for business and marketing data related presentations.

Business Diagram Five Vertical Arrows For Linear Data Flow Presentation Template
This business diagram displays graphic of five vertical arrows linear data flow. This business slide contains the concept of business data representation. Use this diagram to build professional presentation for your viewers.

Business Diagram Creative Sign With Highway Sign Text Big Data Next Exit Ppt Slide
This diagram has been designed with graphic of magnifier and text boxes. These boxes are used to display creative sign and highway sign for big data analysis. This diagram can be used for data related topics in any presentation.
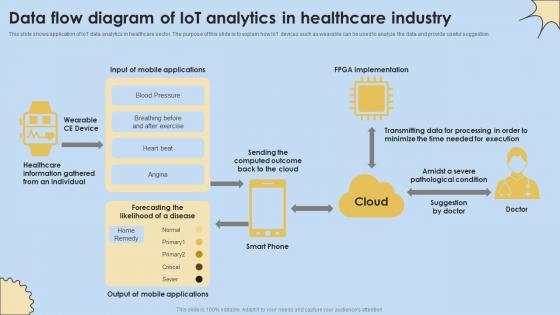
Data Flow Diagram Of IoT Analytics In Healthcare Industry Internet Of Things Analysis Clipart Pdf
This slide shows application of IoT data analytics in healthcare sector. The purpose of this slide is to explain how IoT devices such as wearable can be used to analyze the data and provide useful suggestion. If you are looking for a format to display your unique thoughts, then the professionally designed Data Flow Diagram Of IoT Analytics In Healthcare Industry Internet Of Things Analysis Clipart Pdf is the one for you. You can use it as a Google Slides template or a PowerPoint template. Incorporate impressive visuals, symbols, images, and other charts. Modify or reorganize the text boxes as you desire. Experiment with shade schemes and font pairings. Alter, share or cooperate with other people on your work. Download Data Flow Diagram Of IoT Analytics In Healthcare Industry Internet Of Things Analysis Clipart Pdf and find out how to give a successful presentation. Present a perfect display to your team and make your presentation unforgettable.

Business Diagram Big Data Analysis Using Map Reduce Batch Processing Ppt Slide
This PowerPoint template has been designed with graphic of server and data transfer network. This slide contains the steps of big data, map, reduce and result. Use this editable diagram for data technology related presentations.
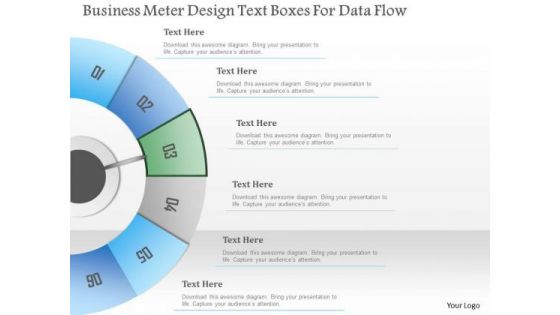
Busines Diagram Business Meter Design Text Boxes For Data Flow Presentation Template
Concept of data flow can be well defined with this exclusive business diagram. This slide contains the diagram of six steps in semi-circle. Use this professional diagram to impress your viewers.

 Home
Home