Data Architecture Diagram
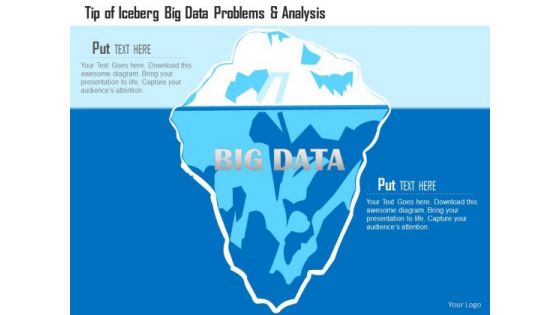
Business Diagram Tip Of Iceberg Big Data Problems And Analysis Ppt Slide
This PowerPoint template has been designed with graphic of iceberg diagram. This diagram slide depicts concept of big data problem and analysis Download this diagram to create professional presentations.
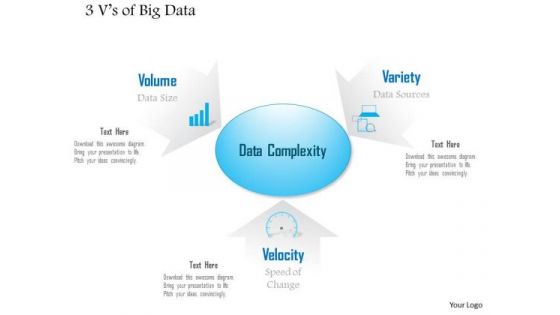
Business Diagram 3 Vs Of Big Data Showing Challenges And Complexity Of Analysis Ppt Slide
Explain the complexity and analysis with this unique PowerPoint template. This technology diagram contains the graphic of three V's to display data complexity. Use this diagram to make professional presentations.

Circular Diagram To Show Phases Of Big Data Analysis Ppt PowerPoint Presentation Infographic Template
This is a circular diagram to show phases of big data analysis ppt powerpoint presentation infographic template. This is a five stage process. The stages in this process are big data, icons, management, strategy, business.
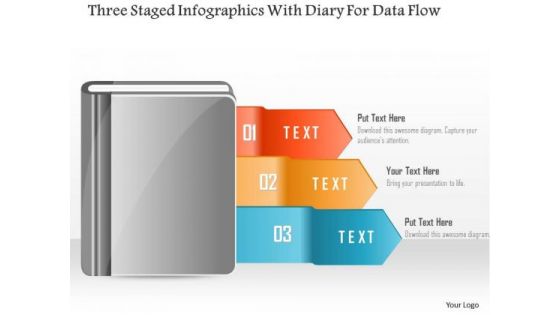
Business Diagram Three Staged Infographics With Diary For Data Flow PowerPoint Template
Three staged info graphic with diary has been used to design this power point template. This PPT contains the concept of data flow. Use this PPT diagram to represent the marketing and business data in any presentation.

Mba Models And Frameworks Eight Stages Of Pie Chart Data Interpretation 8 Stages Consulting Diagram
Be The Doer With Our MBA Models And Frameworks Eight Stages Of Pie Chart Data Interpretation 8 Stages Consulting Diagram Powerpoint Templates. Put Your Thoughts Into Practice.

Mba Models And Frameworks Comparison Table Of Business Data Business Diagram
Be A Donor Of Great Ideas. Display Your Charity On Our MBA Models And Frameworks Comparison Table Of Business Data Business Diagram Powerpoint Templates.
Business Diagram Technology Predictive Data Analytics Networking Social Icons Ppt Slide
This technology diagram slide has been designed with graphic of data icons. These icons may be used to displays the data analytics and social media networking. Use this PPT slide for networking and technology related presentations.

Business Diagram Five Staged Numeric Text Boxes For Data Representation PowerPoint Template
Five staged numeric text boxes diagram has been used to design this power point template. This diagram template contains the concept of data representation. Use this PPT for your business and marketing related presentations.

Business Diagram Big Data Sources Sensors Feeds Databases Files For Analysis Ppt Slide
This slide has been designed with graphic of circular source diagram. This diagram contains the concept of data source sensors and feeds of database files. Download this editable slide to build an exclusive presentation for your viewers.
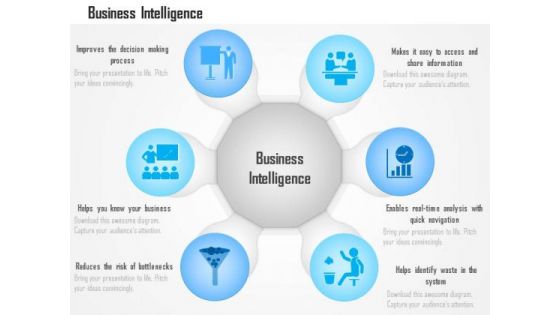
Business Diagram Benefits Advantages Of Business Intelligence Data Analytics Ppt Slide
This technology diagram has been designed with graphic of circular chart with various icons. This slide contains the concept of business intelligence data analytics. Explain advantages of business intelligence in any technical presentations with this quality diagram.

Business Diagram Saas Paas Iaas Virtual Data Cloud Centers Ppt Slide
This technical diagram has been designed with graphic of triangle. This slide contains the concept of SAAS, PAAS and IASS. This slide also helps to explain the virtual data on cloud centers. Download this diagram to make professional presentations.

Business Diagram 3d Graph Of Crossing Chasm And Data Presentation Template
This business diagram has been designed with graphic of 3d graph. This slide contains the concept of chasm and data calculation. Use this slide to display chasm crossing condition. This business diagram adds value to your ideas.
Business Diagram Sources And Use Cases Of Big Data Shown By Cloud Icons Ppt Slide
This technology diagram has been designed with graphic of clouds. This slide depicts the concept of cloud technology and data storage. These clouds also display the big data sources and icons. This diagram slide is suitable for cloud computing related presentations.

Ppt Pink Stage Business Data Flow Free Fishbone Diagram PowerPoint Template Templates
PPT pink stage business data flow free fishbone diagram PowerPoint template Templates-Arrows PowerPoint Diagram is nice for financial PowerPoint Diagram presentations as well as other analysis or business PowerPoint diagram needs. This image has been conceived to enable you to emphatically communicate your ideas in your Business PPT presentations.-PPT pink stage business data flow free fishbone diagram PowerPoint template Templates-arrow, art, assess, blue, business, chart, chevron, clip, clipart, colorful, compliance, corporate, design, development, diagram, flow, glossy, graphic, hierarchy, icon, illustration, implement, info graphic, levels, marketing, modern, plan, process, shape, shiny, square, stages, vector

Price Analysis Diagram For Analysis In Financial Data Ppt Infographics Summary PDF
Showcasing this set of slides titled price analysis diagram for analysis in financial data ppt infographics summary pdf. The topics addressed in these templates are price analysis diagram for analysis in financial data. All the content presented in this PPT design is completely editable. Download it and make adjustments in color, background, font etc. as per your unique business setting.

Business Diagram Big Data Written By Interconnected Puzzle Pieces Ppt Slide
Graphic of interconnected puzzles pieces with big data text are used to design this technology diagram. This diagram helps to depict the concept of data solution and strategy. Display your own analysis in any presentation by using this innovative template and build quality presentation for your viewers.

Business Diagram Big Data Written In A 4 Puzzle Piece Ppt Slide
Graphic of interconnected puzzles pieces with big data text are used to design this technology diagram. This diagram helps to depict the concept of data solution and strategy. Display your own analysis in any presentation by using this innovative template and build quality presentation for your viewers.
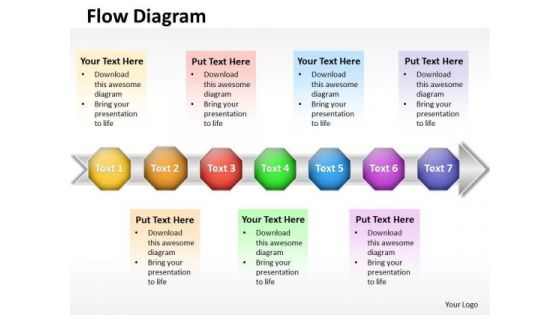
Ppt 7 Sequential Stages New Business PowerPoint Presentation Data Flow Diagram Templates
PPT 7 sequential stages new business PowerPoint presentation data flow diagram Templates-This PowerPoint Diagram shows you the Homogeneous Abstraction of seven approaches on the Arrow. It shows the successive concepts used in a procedure. This diagram will fit for Business Presentations. -PPT 7 sequential stages new business PowerPoint presentation data flow diagram Templates-arrow, art, assess, blue, business, chart, chevron, clip, clipart, colorful, compliance, corporate, design, development, diagram, flow, glossy, graphic, hierarchy, icon, illustration, implement, info graphic, levels, marketing, modern, plan, process, shape, shiny, square, stages, vector

Ppt 7 Stages Self Concept PowerPoint Presentation Download Data Flow Diagram Templates
PPT 7 stages self concept powerpoint presentation download data flow diagram Templates-Use this 3D PowerPoint Diagram to describe seven stages of Linear Process through text boxes on Arrow. PowerPoint text boxes diagram templates are designed to help you place your text in a professional layout.-PPT 7 stages self concept powerpoint presentation download data flow diagram Templates-Achievement, Actualization, Basic, Belonging, Blue, Chart, Confidence, Diagram, Elements, Essential, Fundamental, Glossy, Goals, Gradient, Health, Hierarchical, Hierarchy, Human, Illustration, Isolated, Layer, Level, Love, Morality, Motivation, Needs, Person, Psychological, Psychology, Pyramid

Big Data Life Cycle Impacts Circular Diagram Ppt PowerPoint Presentation Introduction
This is a big data life cycle impacts circular diagram ppt powerpoint presentation introduction. This is a six stage process. The stages in this process are sports predictions, easier commutes, smartphones, personalized advertising, presidential campaigns, advanced healthcare.
Business Diagram Magnifying Glass With Big Data Icons Surrounding The Lens Presentation Template
This diagram has been designed with technology icons around magnifying glass. This Powerpoint template is displaying latest technology icons. Use this amazing slide to build presentation for data management related topics.

Example Of Big Data Framework And Vision Diagram Of Ppt Presentation
This is a example of big data framework and vision diagram of ppt presentation. This is a six stage process. The stages in this process are interactive sql, search, dbmss, batch, streaming, graph.
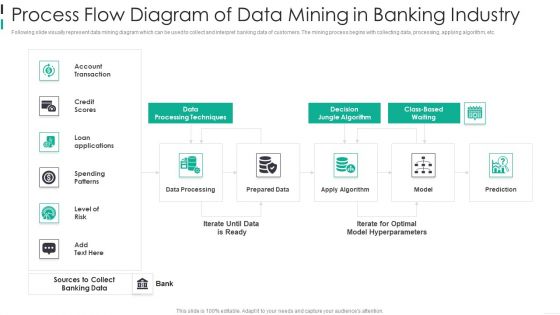
Process Flow Diagram Of Data Mining In Banking Industry Background PDF
Following slide visually represent data mining diagram which can be used to collect and interpret banking data of customers. The mining process begins with collecting data, processing, applying algorithm, etc. Pitch your topic with ease and precision using this Process Flow Diagram Of Data Mining In Banking Industry Background PDF This layout presents information on Account Transaction, Credit Scores, Spending Patterns It is also available for immediate download and adjustment. So, changes can be made in the color, design, graphics or any other component to create a unique layout.

Business Diagram Six Staged Circular Design For Data Representation Presentation Template
This business diagram has been designed with six staged circular design. This slide suitable for data representation. You can also use this slide to present seven steps of any business process. Use this diagram to present your views in a wonderful manner.

Business Diagram Five Staged Circular Ribbon Design For Data Representation Presentation Template
This business diagram displays five staged circular ribbon. This Power Point slide can be used for data representation. Use this PPT slide to show flow of activities in circular manner. Get professional with this exclusive business slide.

Ppt 7 Beeline Power Point Stage Business PowerPoint Theme Data Flow Diagram Templates
PPT 7 beeline power point stage business PowerPoint theme data flow diagram Templates-This PowerPoint Diagram shows Horizontal Demonstration through seven hexagonal boxes on the arrow pointing towards east direction signifying his completion of the process and leading towards success. This image has been conceived to enable you to emphatically communicate your ideas in your Business PPT presentations-PPT 7 beeline power point stage business PowerPoint theme data flow diagram Templates-arrow, art, assess, blue, business, chart, chevron, clip, clipart, colorful, compliance, corporate, design, development, diagram, flow, glossy, graphic, hierarchy, icon, illustration, implement, info graphic, levels, marketing, modern, plan, process, shape, shiny, square, stages, vector
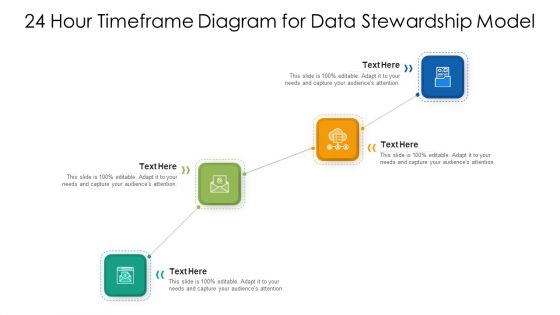
24 Hour Timeframe Diagram For Data Stewardship Model Ppt PowerPoint Presentation File Designs PDF
Persuade your audience using this 24 hour timeframe diagram for data stewardship model ppt powerpoint presentation file designs pdf. This PPT design covers four stages, thus making it a great tool to use. It also caters to a variety of topics including 24 hour timeframe diagram for data stewardship model. Download this PPT design now to present a convincing pitch that not only emphasizes the topic but also showcases your presentation skills.
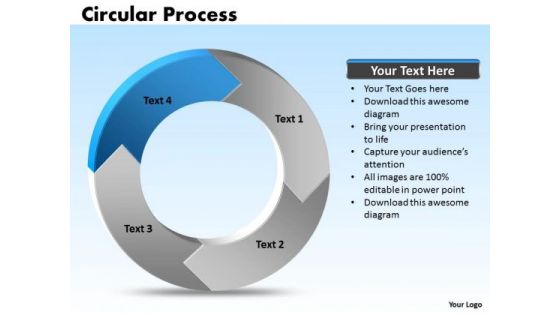
Ppt Edit Data PowerPoint Chart Processing Cycle Diagram 4 State Templates
PPT edit data powerpoint chart processing cycle diagram 4 state Templates-The above template has the theme of circular process Diagram. This image refers the concept of Act Cycle. Adjust the above image in your PPT presentations to visually support your content in your business meetings. This PPT images is so perfectly designed that it make your clients understand the business idea quickly and visually.-PPT edit data powerpoint chart processing cycle diagram 4 state Templates-Arrow, Chart, Circular, Color, Colorful, Connect, Connection, Design, Diagram, Finance, Graphic, Group, Growth, Icon, Illustration, Marketing, Pieces, Process, Recycle, Recycling, Round, Set, Strategy, Symbol, Wheel

Ppt Purple Stage New Business PowerPoint Presentation Data Flow Diagram Templates
PPT purple stage new business PowerPoint presentation data flow diagram Templates-Develop competitive advantage with our above Diagram which contains a picture of seven hexagonal boxes on the arrow pointing towards the east direction. This image has been professionally designed to emphasize the concept of continuous process. Adjust the above image in your PPT presentations to visually support your content in your Business PPT slideshows.-PPT purple stage new business PowerPoint presentation data flow diagram Templates-arrow, art, assess, blue, business, chart, chevron, clip, clipart, colorful, compliance, corporate, design, development, diagram, flow, glossy, graphic, hierarchy, icon, illustration, implement, info graphic, levels, marketing, modern, plan, process, shape, shiny, square, stages, vector

Ppt Green Stage Business Presentation Download Data Flow Diagram PowerPoint Templates
PPT green stage business presentation download data flow diagram PowerPoint Templates-This Detailed Flow Diagram displays the activities you may need to execute to achieve successful implementation and in-service management of your services program. You can show various processes with these linear designed Circular pieces on Arrow.-PPT green stage business presentation download data flow diagram PowerPoint Templates-arrow, art, assess, blue, business, chart, chevron, clip, clipart, colorful, compliance, corporate, design, development, diagram, flow, glossy, graphic, hierarchy, icon, illustration, implement, info graphic, levels, marketing, modern, plan, process, shape, shiny, square, stages, vector

Ppt 7 Continual Stages Business Presentation Download Data Flow Diagram PowerPoint Templates
PPT 7 continual stages business presentation download data flow diagram PowerPoint Templates-This PowerPoint Diagram shows the Sequential Abstraction of steps which are involved in Marketing Process. It includes Seven Steps. Presently it is showing and describing the third stage which is highlighted by red color. An excellent graphic to attract the attention of your audience to improve earnings.-PPT 7 continual stages business presentation download data flow diagram PowerPoint Templates-arrow, art, assess, blue, business, chart, chevron, clip, clipart, colorful, compliance, corporate, design, development, diagram, flow, glossy, graphic, hierarchy, icon, illustration, implement, info graphic, levels, marketing, modern, plan, process, shape, shiny, square, stages, vector

Business Diagram Four Staged Pencil Infographics For Data Representation PowerPoint Template
Four staged pencil info graphics has been used to design this power point template. This diagram template contains the concept of data representations. Use this PPT for your business and marketing presentations.
Business Diagram Big Data Cloud With Analytic Icons Surrounding It Presentation Template
This PowerPoint template has been designed with graphic of blue colored cloud and various icons in surrounding. This diagram can be used for cloud technology related topics. Explain data sharing on cloud technology with this exclusive business slide.
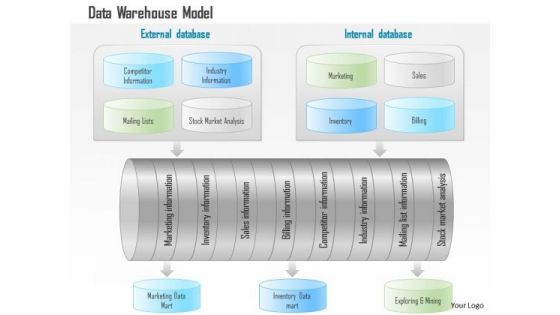
Business Diagram Data Warehouse Model With Analytics And Business Intelligence Ppt Slide
This technology diagram has been designed with graphic of data warehouse model. This model depicts concept of business intelligence and analysis. Download this editable slide build an exclusive presentation.

Business Diagram Extract Transform Load Etl Business Intelligence Bug Data Analysis Pipeline Ppt Sli
This PowerPoint template has been designed with graphic of server. This diagram depicts the concept of ETL business intelligence with extract transform load. This slide also helps to display the data analysis pipeline.

Stages Of Advanced Data Analytics Life Cycle Diagrams Pdf
This slide represents life cycle of big data analytics for organizing and managing tasks. It further includes various steps such as business case evaluation, data identification, data acquisition and filtering, data extraction, and data validation and cleaning Showcasing this set of slides titled Stages Of Advanced Data Analytics Life Cycle Diagrams Pdf. The topics addressed in these templates are Business Case Evaluation, Data Identification, Data Extraction. All the content presented in this PPT design is completely editable. Download it and make adjustments in color, background, font etc. as per your unique business setting.

Business Diagram Four Staged Hexagon For Data And Process Flow Presentation Template
Four staged hexagon diagram has been used to design this power point template. This PPT contains the concept of data and process flow. Use this PPT and build professional presentation on business topics.
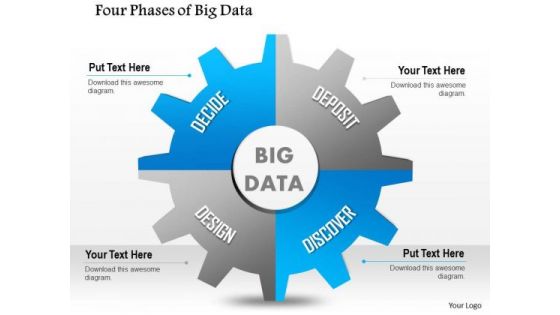
Business Diagram Four Phases Of Big Data Showing In Gear Wheel Presentation Template
This template contains four phases of big data showing in gear wheel. This Power Point slide has been designed with graphic of gear. This big gear depicts concepts of decide, deposit, design and discover. Use this diagram to build presentation for data computing.
3 Groups Diagram For Data Lake Migration To Aws Ppt PowerPoint Presentation Icon Example File PDF
Persuade your audience using this 3 groups diagram for data lake migration to aws ppt powerpoint presentation icon example file pdf. This PPT design covers three stages, thus making it a great tool to use. It also caters to a variety of topics including 3 groups diagram for data lake migration to aws. Download this PPT design now to present a convincing pitch that not only emphasizes the topic but also showcases your presentation skills.
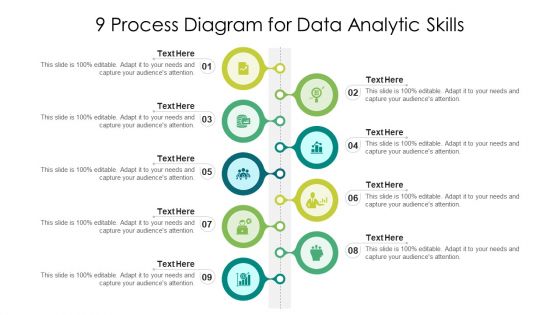
9 Process Diagram For Data Analytic Skills Ppt PowerPoint Presentation Ideas PDF
Persuade your audience using this 9 process diagram for data analytic skills ppt powerpoint presentation ideas pdf. This PPT design covers nine stages, thus making it a great tool to use. It also caters to a variety of topics including 9 process diagram for data analytic skills. Download this PPT design now to present a convincing pitch that not only emphasizes the topic but also showcases your presentation skills.

Strengths And Weaknesses Diagram Visual For List Data Structure Structure PDF
Persuade your audience using this strengths and weaknesses diagram visual for list data structure structure pdf. This PPT design covers two stages, thus making it a great tool to use. It also caters to a variety of topics including weaknesses diagram visual for list data structure. Download this PPT design now to present a convincing pitch that not only emphasizes the topic but also showcases your presentation skills.
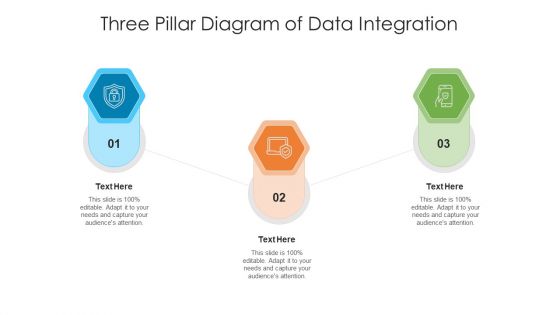
Three Pillar Diagram Of Data Integration Ppt PowerPoint Presentation Summary Brochure PDF
Persuade your audience using this three pillar diagram of data integration ppt powerpoint presentation summary brochure pdf. This PPT design covers three stages, thus making it a great tool to use. It also caters to a variety of topics including three pillar diagram of data integration. Download this PPT design now to present a convincing pitch that not only emphasizes the topic but also showcases your presentation skills.
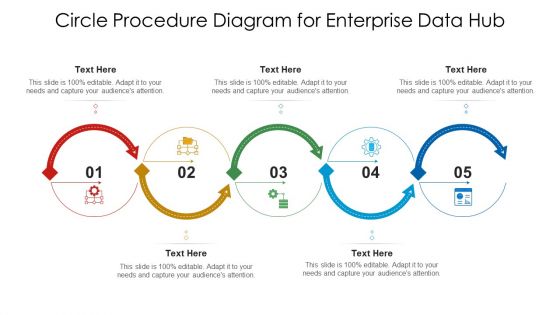
Circle Procedure Diagram For Enterprise Data Hub Ppt Pictures Format Ideas PDF
Persuade your audience using this circle procedure diagram for enterprise data hub ppt pictures format ideas pdf. This PPT design covers five stages, thus making it a great tool to use. It also caters to a variety of topics including circle procedure diagram for enterprise data hub. Download this PPT design now to present a convincing pitch that not only emphasizes the topic but also showcases your presentation skills.

Agenda For Big Data Analytics Ppt PowerPoint Presentation Diagram Lists PDF
Presenting Agenda For Big Data Analytics Ppt PowerPoint Presentation Diagram Lists PDF to provide visual cues and insights. Share and navigate important information on six stages that need your due attention. This template can be used to pitch topics like Data Management, Technologies, Business. In addtion, this PPT design contains high resolution images, graphics, etc, that are easily editable and available for immediate download.
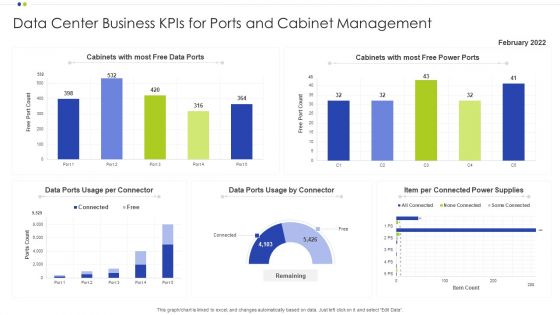
Data Center Business Kpis For Ports And Cabinet Management Ppt Diagram Ppt PDF
Showcasing this set of slides titled Data Center Business Kpis For Ports And Cabinet Management Ppt Diagram Ppt PDF. The topics addressed in these templates are Cabinet Management, Data Center Business, Power Supplies. All the content presented in this PPT design is completely editable. Download it and make adjustments in color, background, font etc. as per your unique business setting.
Business Diagram Big Data Analytics Cloud Networking Storage Servers Computing Icon Set Ppt Slide
This PowerPoint template has been designed with multiple circles and icons inside. This slide depicts concepts of cloud storage and servers. This diagram also includes the topics of the cloud computing. Use this diagram for cloud and data technology related presentations.

Business Diagram Three Staged Step Up Arrow Data Flow Presentation Template
This business diagram has been designed with three staged step up arrow design. This slide suitable for data representation. You can also use this slide to present three steps of any business process. Use this diagram to present your views in a wonderful manner.
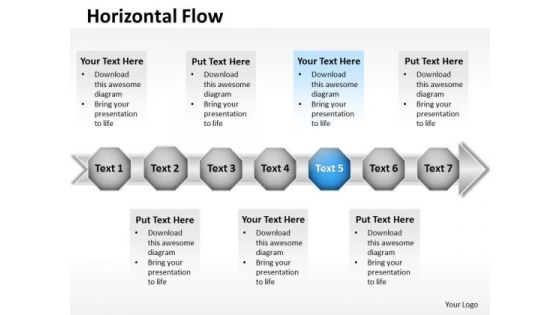
Ppt Blue Stage Business PowerPoint Templates Free Download Data Flow Diagram
PPT blue stage business PowerPoint templates free download data flow diagram-Use this sequentially based PowerPoint Diagram to represent seven different approaches combined to form a Linear Process. It portrays the concept of convert, reclaim, recondition, recover, recycle , redeem, regenerate, remodel, reoccupy, repossess, rescue, restore, retake, salvage etc.-PPT blue stage business PowerPoint templates free download data flow diagram-arrow, art, assess, blue, business, chart, chevron, clip, clipart, colorful, compliance, corporate, design, development, diagram, flow, glossy, graphic, hierarchy, icon, illustration, implement, info graphic, levels, marketing, modern, plan, process, shape, shiny, square, stages, vector

Flow Diagram Of Data Map System Ppt PowerPoint Presentation Gallery Demonstration PDF
This slide shows flowchart highlighting data inventory system. It provides information such as store keeper, product demand, customer identification, customer data, order management, etc. Persuade your audience using this Flow Diagram Of Data Map System Ppt PowerPoint Presentation Gallery Demonstration PDF. This PPT design covers three stages, thus making it a great tool to use. It also caters to a variety of topics including Store Keeper, Customer, Approve, Manage Customer Data. Download this PPT design now to present a convincing pitch that not only emphasizes the topic but also showcases your presentation skills.
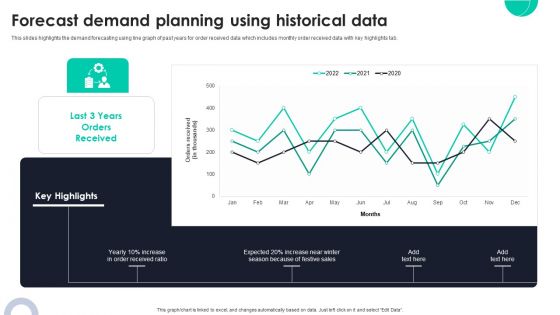
Forecast Demand Planning Using Historical Data Ppt PowerPoint Presentation Diagram Graph Charts PDF
This slides highlights the demand forecasting using line graph of past years for order received data which includes monthly order received data with key highlights tab. Crafting an eye catching presentation has never been more straightforward. Let your presentation shine with this tasteful yet straightforward Forecast Demand Planning Using Historical Data Ppt PowerPoint Presentation Diagram Graph Charts PDF template. It offers a minimalistic and classy look that is great for making a statement. The colors have been employed intelligently to add a bit of playfulness while still remaining professional. Construct the ideal Forecast Demand Planning Using Historical Data Ppt PowerPoint Presentation Diagram Graph Charts PDF that effortlessly grabs the attention of your audience. Begin now and be certain to wow your customers.
Icon Showing Transformation Shift Of Digital Data With Statistics Ppt PowerPoint Presentation Diagram PDF
Persuade your audience using this Icon Showing Transformation Shift Of Digital Data With Statistics Ppt PowerPoint Presentation Diagram PDF. This PPT design covers three stages, thus making it a great tool to use. It also caters to a variety of topics including Icon Showing Transformation Shift, Digital Data With Statistics. Download this PPT design now to present a convincing pitch that not only emphasizes the topic but also showcases your presentation skills.
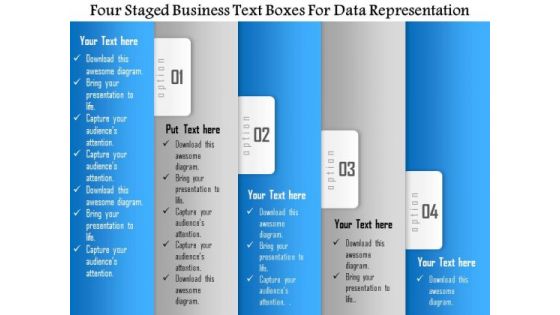
Business Diagram Four Staged Business Text Boxes For Data Representation Presentation Template
Four staged business text boxes are used to design this Power Point template slide. This PPT slide contains the concept of data representation. Use this PPT slide for your business and sales data analysis related topics in any presentation.

Collecting Consumer Qualitative Data For Personalized Marketing Ppt PowerPoint Presentation Diagram Graph Charts PDF
This slide showcases consumer qualitative data that can be collected to formulate personalized marketing campaign. It also shows ways to collect data from different sources Do you have an important presentation coming up Are you looking for something that will make your presentation stand out from the rest Look no further than Collecting Consumer Qualitative Data For Personalized Marketing Ppt PowerPoint Presentation Diagram Graph Charts PDF. With our professional designs, you can trust that your presentation will pop and make delivering it a smooth process. And with Slidegeeks, you can trust that your presentation will be unique and memorable. So why wait Grab Collecting Consumer Qualitative Data For Personalized Marketing Ppt PowerPoint Presentation Diagram Graph Charts PDF today and make your presentation stand out from the rest.
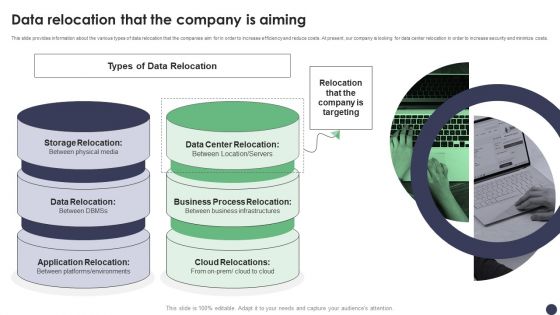
Data Relocation That The Company Is Aiming Ppt PowerPoint Presentation Diagram Lists PDF
This slide provides information about the various types of data relocation that the companies aim for in order to increase efficiency and reduce costs. At present, our company is looking for data center relocation in order to increase security and minimize costs. Do you have an important presentation coming up Are you looking for something that will make your presentation stand out from the rest Look no further than Data Relocation That The Company Is Aiming Ppt PowerPoint Presentation Diagram Lists PDF. With our professional designs, you can trust that your presentation will pop and make delivering it a smooth process. And with Slidegeeks, you can trust that your presentation will be unique and memorable. So why wait Grab Data Relocation That The Company Is Aiming Ppt PowerPoint Presentation Diagram Lists PDF today and make your presentation stand out from the rest.

Big Data Management In Education Sector Ppt PowerPoint Presentation Diagram Templates PDF
Presenting Big Data Management In Education Sector Ppt PowerPoint Presentation Diagram Templates PDF to provide visual cues and insights. Share and navigate important information on four stages that need your due attention. This template can be used to pitch topics like Cluster Analysis, Data Warehouse, Cloud Environment. In addtion, this PPT design contains high resolution images, graphics, etc, that are easily editable and available for immediate download.
Three Cloud Servers For Data Storage Vector Icon Ppt PowerPoint Presentation Diagram Templates PDF
Persuade your audience using this three cloud servers for data storage vector icon ppt powerpoint presentation diagram templates pdf. This PPT design covers three stages, thus making it a great tool to use. It also caters to a variety of topics including three cloud servers for data storage vector icon. Download this PPT design now to present a convincing pitch that not only emphasizes the topic but also showcases your presentation skills.
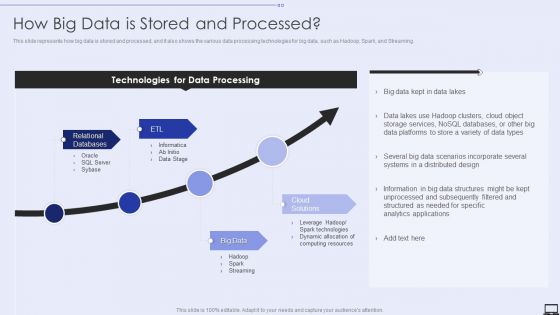
How Big Data Is Stored And Processe Ppt PowerPoint Presentation Diagram Graph Charts PDF
Presenting How Big Data Is Stored And Processe Ppt PowerPoint Presentation Diagram Graph Charts PDF to provide visual cues and insights. Share and navigate important information on four stages that need your due attention. This template can be used to pitch topics like Relational Databases, Big Data, Cloud Solutions. In addtion, this PPT design contains high resolution images, graphics, etc, that are easily editable and available for immediate download.
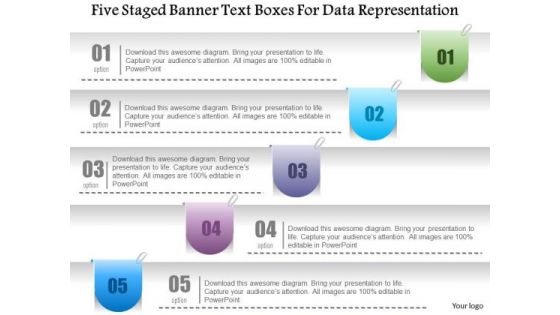
Business Diagram Five Staged Banner Text Boxes For Data Representation PowerPoint Template
Five staged banner style text boxes are used to design this power point template. This PPT contains the concept of data representation. Use this PPT slide for your data and business related presentations.

Business Diagram Four Staged Paper Blocks For Data Representation PowerPoint Template
Four staged paper blocks graphic has been used to craft this power point template slide. This PPT slide contains the concept of data flow and representation. Use this PPT to build an innovative presentation on data related topics..

Data Center Relocation Benefits To The Company Ppt PowerPoint Presentation Diagram Graph Charts PDF
The following slide shows the benefits of data center relocation to the company such as increase in overall data center efficiency, reduction in data center expenses and increase in overall data security. Slidegeeks is here to make your presentations a breeze with Data Center Relocation Benefits To The Company Ppt PowerPoint Presentation Diagram Graph Charts PDF With our easy to use and customizable templates, you can focus on delivering your ideas rather than worrying about formatting. With a variety of designs to choose from, you are sure to find one that suits your needs. And with animations and unique photos, illustrations, and fonts, you can make your presentation pop. So whether you are giving a sales pitch or presenting to the board, make sure to check out Slidegeeks first.

 Home
Home