Change Management Kpi
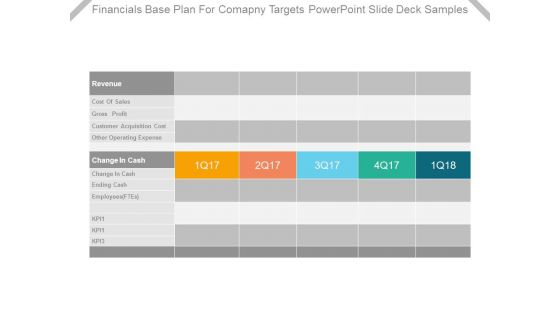
Financials Base Plan For Company Targets Powerpoint Slide Deck Samples
This is a financials base plan for company targets powerpoint slide deck samples. This is a five stage process. The stages in this process are revenue, cost of sales, gross profit, customer acquisition cost, other operating expense, change in cash, change in cash, ending cash, employees ftes, kpi.
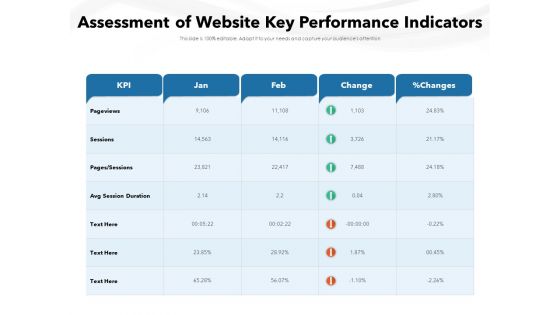
Assessment Of Website Key Performance Indicators Ppt PowerPoint Presentation Gallery Visual Aids PDF
Showcasing this set of slides titled assessment of website key performance indicators ppt powerpoint presentation gallery visual aids pdf. The topics addressed in these templates are assessment of website key performance indicators. All the content presented in this PPT design is completely editable. Download it and make adjustments in color, background, font etc. as per your unique business setting.
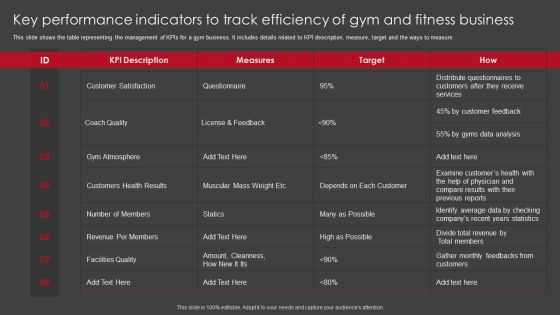
Key Performance Indicators To Track Efficiency Of Gym And Fitness Business Themes PDF
This slide shows the table representing the management of KPIs for a gym business. It includes details related to KPI description, measure, target and the ways to measure. Pitch your topic with ease and precision using this Key Performance Indicators To Track Efficiency Of Gym And Fitness Business Themes PDF. This layout presents information on Key Performance Indicators, Track Efficiency, Gym And Fitness Business. It is also available for immediate download and adjustment. So, changes can be made in the color, design, graphics or any other component to create a unique layout.

Top Sales Team Accomplishment Evaluation Tools Structure PDF
This slide showcases best team performance management tools. It provides information about KPI tracking, team communication, review and feedback, improvement plans, reporting and analytics, integration, user cost per month, etc.Pitch your topic with ease and precision using this top sales team accomplishment evaluation tools structure pdf This layout presents information on top sales team accomplishment evaluation tools It is also available for immediate download and adjustment. So, changes can be made in the color, design, graphics or any other component to create a unique layout.
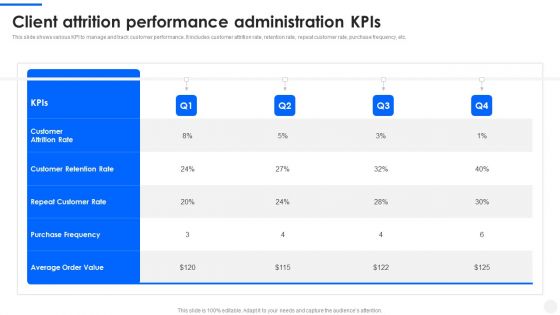
Client Attrition Performance Administration Kpis Topics PDF
This slide shows various KPI to manage and track customer performance. It includes customer attrition rate, retention rate, repeat customer rate, purchase frequency, etc. Pitch your topic with ease and precision using this Client Attrition Performance Administration Kpis Topics PDF. This layout presents information on Customer Retention Rate, Repeat Customer Rate, Purchase Frequency. It is also available for immediate download and adjustment. So, changes can be made in the color, design, graphics or any other component to create a unique layout.
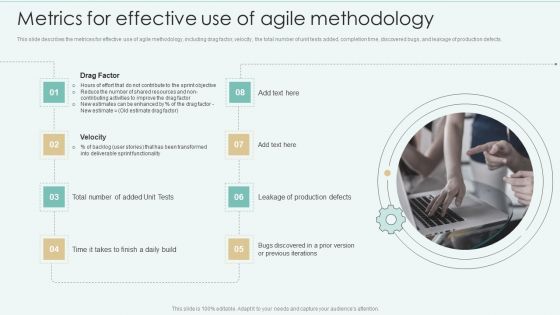
Strategies Of Agile Development To Enhance Processes Metrics For Effective Use Of Agile Methodology Summary PDF
This slide describes the metrices for effective use of agile methodology, including drag factor, velocity, the total number of unit tests added, completion time, discovered bugs, and leakage of production defects. Find highly impressive Strategies Of Agile Development To Enhance Processes Metrics For Effective Use Of Agile Methodology Summary PDF on Slidegeeks to deliver a meaningful presentation. You can save an ample amount of time using these presentation templates. No need to worry to prepare everything from scratch because Slidegeeks experts have already done a huge research and work for you. You need to download Strategies Of Agile Development To Enhance Processes Metrics For Effective Use Of Agile Methodology Summary PDF for your upcoming presentation. All the presentation templates are 100 percent editable and you can change the color and personalize the content accordingly. Download now.

Marketers Guide To Data Analysis Optimization Analyzing Organic Click Through Rates For Better Conversions Structure PDF
This slide covers an overview of click-through rate KPI to identify the percentage of visitors who click on your page after their search triggers an impression. It also includes optimizing strategies, using descriptive URLs, localizing content, and adding structured data. Find highly impressive Marketers Guide To Data Analysis Optimization Analyzing Organic Click Through Rates For Better Conversions Structure PDF on Slidegeeks to deliver a meaningful presentation. You can save an ample amount of time using these presentation templates. No need to worry to prepare everything from scratch because Slidegeeks experts have already done a huge research and work for you. You need to download Marketers Guide To Data Analysis Optimization Analyzing Organic Click Through Rates For Better Conversions Structure PDF for your upcoming presentation. All the presentation templates are 100 percent editable and you can change the color and personalize the content accordingly. Download now.
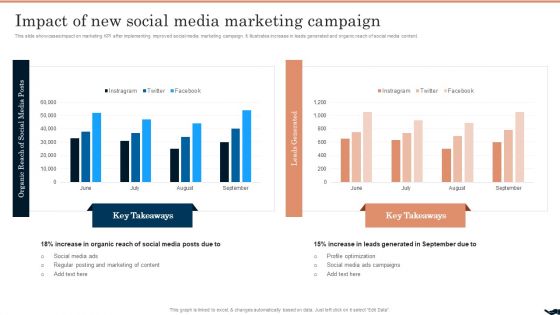
Generating Leads Through Impact Of New Social Media Marketing Campaign Clipart PDF
This slide showcases impact on marketing KPI after implementing improved social media marketing campaign. It illustrates increase in leads generated and organic reach of social media content. Find highly impressive Generating Leads Through Impact Of New Social Media Marketing Campaign Clipart PDF on Slidegeeks to deliver a meaningful presentation. You can save an ample amount of time using these presentation templates. No need to worry to prepare everything from scratch because Slidegeeks experts have already done a huge research and work for you. You need to download Generating Leads Through Impact Of New Social Media Marketing Campaign Clipart PDF for your upcoming presentation. All the presentation templates are 100 percent editable and you can change the color and personalize the content accordingly. Download now.
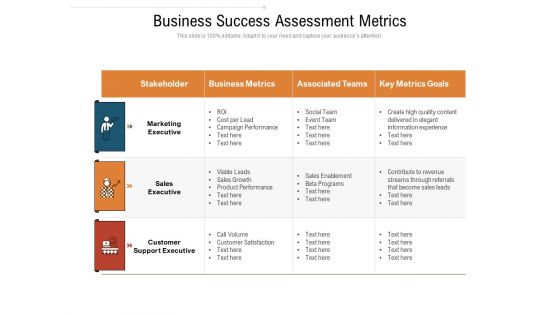
Business Success Assessment Metrics Ppt PowerPoint Presentation Gallery Graphics Pictures PDF
Showcasing this set of slides titled business success assessment metrics ppt powerpoint presentation gallery graphics pictures pdf. The topics addressed in these templates are marketing executive, sales executive, customer support executive. All the content presented in this PPT design is completely editable. Download it and make adjustments in color, background, font etc. as per your unique business setting.
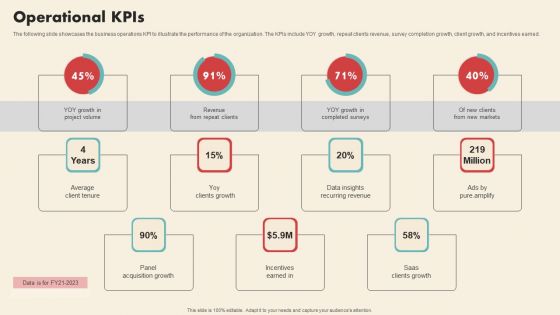
Data Driven Marketing Solutions Firm Company Profile Operational Kpis Graphics PDF
The following slide showcases the business operations KPI to illustrate the performance of the organization. The KPIs include YOY growth, repeat clients revenue, survey completion growth, client growth, and incentives earned. Are you searching for a Data Driven Marketing Solutions Firm Company Profile Operational Kpis Graphics PDF that is uncluttered, straightforward, and original Its easy to edit, and you can change the colors to suit your personal or business branding. For a presentation that expresses how much effort you have put in, this template is ideal. With all of its features, including tables, diagrams, statistics, and lists, its perfect for a business plan presentation. Make your ideas more appealing with these professional slides. Download Data Driven Marketing Solutions Firm Company Profile Operational Kpis Graphics PDF from Slidegeeks today.

TikTok Marketing Hashtag Challenge TikTok Advertising Strategies To Provide Effective Introduction Pdf
This slide represents the KPI dashboard to track and monitor the performance of hashtag challenge initiated by the brand on TikTok. It includes details related to KPIs such as engagement, followers growth, average engagement etc. Find highly impressive TikTok Marketing Hashtag Challenge TikTok Advertising Strategies To Provide Effective Introduction Pdf on Slidegeeks to deliver a meaningful presentation. You can save an ample amount of time using these presentation templates. No need to worry to prepare everything from scratch because Slidegeeks experts have already done a huge research and work for you. You need to download TikTok Marketing Hashtag Challenge TikTok Advertising Strategies To Provide Effective Introduction Pdf for your upcoming presentation. All the presentation templates are 100 percent editable and you can change the color and personalize the content accordingly. Download now
Dashboard For Tracking Sales Team Sales Techniques For Achieving Guidelines Pdf
This slide covers the KPI dashboard for tracking sales rep performance. It includes metrics such as sales, target, percent of target, sales, and target for each salesperson. Find highly impressive Dashboard For Tracking Sales Team Sales Techniques For Achieving Guidelines Pdfon Slidegeeks to deliver a meaningful presentation. You can save an ample amount of time using these presentation templates. No need to worry to prepare everything from scratch because Slidegeeks experts have already done a huge research and work for you. You need to download Dashboard For Tracking Sales Team Sales Techniques For Achieving Guidelines Pdf for your upcoming presentation. All the presentation templates are 100 percent editable and you can change the color and personalize the content accordingly. Download now
Dashboard Tracking Ambassador Implementing Social Media Tactics For Boosting WOM Demonstration Pdf
This slide covers the KPI dashboard for companies to evaluate the performance of ambassador marketing campaigns. It includes metrics such as the number of brand ambassadors, the total number of shares, clicks, CPS, revenue, commissions, etc.Find highly impressive Dashboard Tracking Ambassador Implementing Social Media Tactics For Boosting WOM Demonstration Pdf on Slidegeeks to deliver a meaningful presentation. You can save an ample amount of time using these presentation templates. No need to worry to prepare everything from scratch because Slidegeeks experts have already done a huge research and work for you. You need to download Dashboard Tracking Ambassador Implementing Social Media Tactics For Boosting WOM Demonstration Pdf for your upcoming presentation. All the presentation templates are 100 percent editable and you can change the color and personalize the content accordingly. Download now
Weekly Performance Assessment Of Employee With Metrics And Comments Ppt PowerPoint Presentation Icon Elements PDF
Presenting this set of slides with name weekly performance assessment of employee with metrics and comments ppt powerpoint presentation icon elements pdf. The topics discussed in these slides are metrics, planned target, achieved target, comments. This is a completely editable PowerPoint presentation and is available for immediate download. Download now and impress your audience.
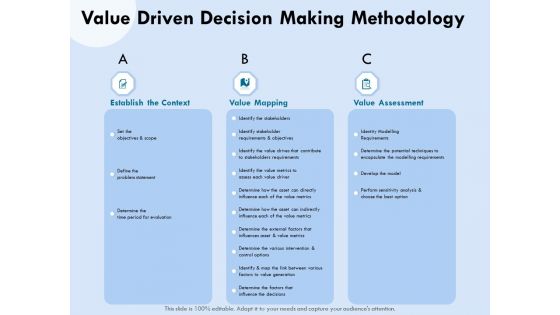
Functional Analysis Of Business Operations Value Driven Decision Making Methodology Inspiration PDF
Presenting this set of slides with name functional analysis of business operations value driven decision making methodology inspiration pdf. The topics discussed in these slides are value mapping, value assessment, analysis, value metrics, stakeholders. This is a completely editable PowerPoint presentation and is available for immediate download. Download now and impress your audience.

Ways To Design Impactful Trading Solution Sales Operations Strategy Scorecard Ppt PowerPoint Presentation Show Slide Portrait PDF
Presenting this set of slides with name ways to design impactful trading solution sales operations strategy scorecard ppt powerpoint presentation show slide portrait pdf. The topics discussed in these slides are programs, initiatives, and actions, key performance indicators and metrics, target timeframe to achieve goals, sales compensation plan redesign, sales skills assessment. This is a completely editable PowerPoint presentation and is available for immediate download. Download now and impress your audience.

Facts Assessment Advanced Analytics Final Output Results Ppt PowerPoint Presentation File Samples PDF
Presenting this set of slides with name facts assessment advanced analytics final output results ppt powerpoint presentation file samples pdf. The topics discussed in these slides are learning question, outcome, outcome metric, data source analysis approach, results. This is a completely editable PowerPoint presentation and is available for immediate download. Download now and impress your audience.
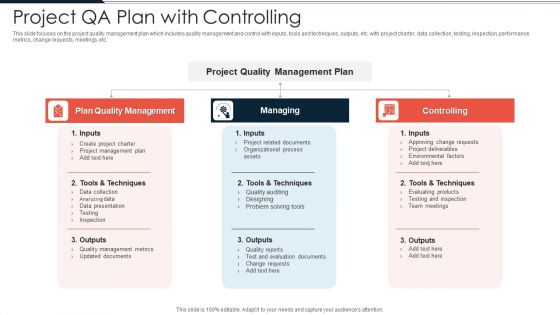
Project QA Plan With Controlling Ppt PowerPoint Presentation File Templates PDF
This slide focuses on the project quality management plan which includes quality management and control with inputs, tools and techniques, outputs, etc. with project charter, data collection, testing, inspection, performance metrics, change requests, meetings, etc. Persuade your audience using this project qa plan with controlling ppt powerpoint presentation file templates pdf. This PPT design covers three stages, thus making it a great tool to use. It also caters to a variety of topics including plan quality management, managing, controlling, project quality management plan. Download this PPT design now to present a convincing pitch that not only emphasizes the topic but also showcases your presentation skills.
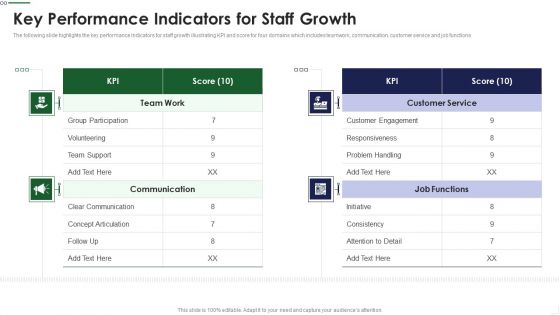
Key Performance Indicators For Staff Growth Topics PDF
The following slide highlights the key performance Indicators for staff growth illustrating KPI and score for four domains which includes teamwork, communication, customer service and job functions Pitch your topic with ease and precision using this Key Performance Indicators For Staff Growth Topics PDF This layout presents information on Customer Engagement, Responsiveness, Problem Handling It is also available for immediate download and adjustment. So, changes can be made in the color, design, graphics or any other component to create a unique layout.
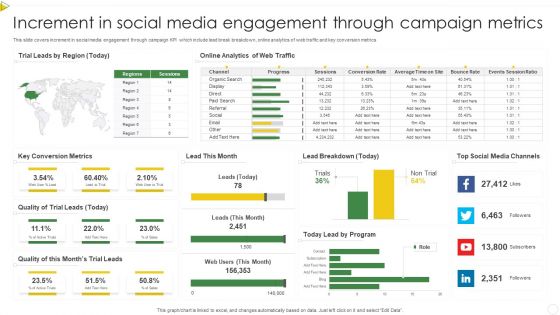
Increment In Social Media Engagement Through Campaign Metrics Professional PDF
This slide covers increment in social media engagement through campaign KPI which include lead break breakdown, online analytics of web traffic and key conversion metrics. Pitch your topic with ease and precision using this Increment In Social Media Engagement Through Campaign Metrics Professional PDF. This layout presents information on Quality, Key Conversion Metrics, Social Media. It is also available for immediate download and adjustment. So, changes can be made in the color, design, graphics or any other component to create a unique layout.
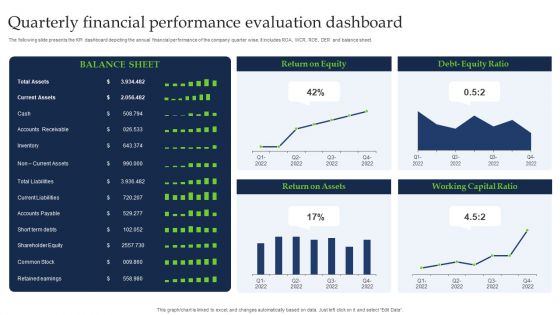
Quarterly Financial Performance Evaluation Dashboard Guidelines PDF
The following slide presents the KPI dashboard depicting the annual financial performance of the company quarter wise. It includes ROA, WCR, ROE, DER and balance sheet. Pitch your topic with ease and precision using this Quarterly Financial Performance Evaluation Dashboard Guidelines PDF. This layout presents information on Current Assets, Shareholder Equity, Common Stock. It is also available for immediate download and adjustment. So, changes can be made in the color, design, graphics or any other component to create a unique layout.
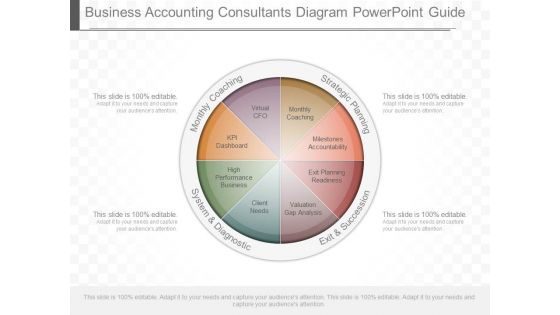
Business Accounting Consultants Diagram Powerpoint Guide
This is a business accounting consultants diagram powerpoint guide. This is a eight stage process. The stages in this process are monthly coaching, strategic planning, system and diagnostic, exit and succession, monthly coaching, milestones accountability, exit planning readiness, valuation gap analysis, client needs, high performance business, kpi dashboard, virtual cfo.

Process To Develop Value Centric Enterprise Optimization In Organization Download Pdf
The slide showcases five stage process that will assist managers in developing value management in organizations. It contains points such as defining business objectives and value drivers creating a metrics system and working in robust management , fostering team collaboration and communication , implementing change management strategies , monitoring and evaluating impact initiated Showcasing this set of slides titled Process To Develop Value Centric Enterprise Optimization In Organization Download Pdf. The topics addressed in these templates are Analyzing, Interpreting Relevant Data, Track Performance. All the content presented in this PPT design is completely editable. Download it and make adjustments in color, background, font etc. as per your unique business setting.

Smartphone Game Development And Advertising Technique Kpis For Measuring Marketing Efforts And Application Guidelines PDF
The following slide helps organization in understanding the essential KPIs for measuring marketing activities for Web3 P2E based NFT game. These KPIs can be general mobile app KPI, App engagement metrics, revenue focused mobile KPI and all store KPIs Present like a pro with Smartphone Game Development And Advertising Technique Kpis For Measuring Marketing Efforts And Application Guidelines PDF Create beautiful presentations together with your team, using our easy to use presentation slides. Share your ideas in real time and make changes on the fly by downloading our templates. So whether you are in the office, on the go, or in a remote location, you can stay in sync with your team and present your ideas with confidence. With Slidegeeks presentation got a whole lot easier. Grab these presentations today.

Performance Metrics Dashboard Highlighting Retail Objectives Sample PDF
The purpose of this slide is to showcase an effective KPI dashboard which can assist store manager to evaluate retail business objectives. The KPIs are sales per square foot, average transaction value, sales per employee, and inventory shrinkage. Pitch your topic with ease and precision using this Performance Metrics Dashboard Highlighting Retail Objectives Sample PDF. This layout presents information on Average Transaction Value, Sales Per Employee. It is also available for immediate download and adjustment. So, changes can be made in the color, design, graphics or any other component to create a unique layout.

Dashboard To Analyze Flexible Working Strategies Impact On Employees Performance Rules PDF
The following slide delineates a key performance indicator KPI dashboard through which managers can evaluate the success of a flexible working policy on workforce performance. The major KPIs are absenteeism rate, overall labor effectiveness etc.If your project calls for a presentation, then Slidegeeks is your go-to partner because we have professionally designed, easy to edit templates that are perfect for any presentation. After downloading, you can easily edit Dashboard To Analyze Flexible Working Strategies Impact On Employees Performance Rules PDF and make the changes accordingly. You can rearrange slides or fill them with different images. Check out all the handy templates
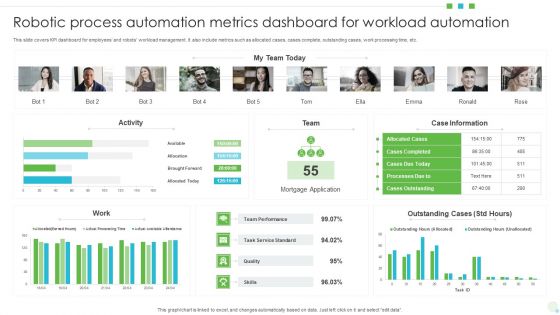
Robotic Process Automation Metrics Dashboard For Workload Automation Mockup PDF
This slide covers KPI dashboard for employees and robots workload management. It also include metrics such as allocated cases, cases complete, outstanding cases, work processing time, etc. Pitch your topic with ease and precision using this Robotic Process Automation Metrics Dashboard For Workload Automation Mockup PDF. This layout presents information on Mortgage Application, Team Performance, Case Information. It is also available for immediate download and adjustment. So, changes can be made in the color, design, graphics or any other component to create a unique layout.
Robotic Process Automation Metrics Dashboard For Tracking Business Return On Investment Information PDF
This slide illustrates KPI Dashboard for measuring time and money saved after RPA deployment. It also include metrics for analysis such as productivity in robot hours, hours saved per process, money saved per process, etc. Pitch your topic with ease and precision using this Robotic Process Automation Metrics Dashboard For Tracking Business Return On Investment Information PDF. This layout presents information on Management, Goal, Productivity. It is also available for immediate download and adjustment. So, changes can be made in the color, design, graphics or any other component to create a unique layout.
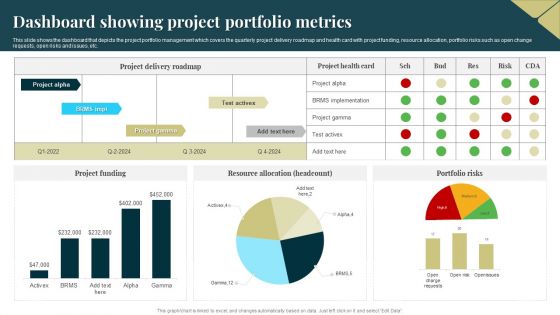
Dashboard Showing Project Portfolio Metrics Microsoft PDF
This slide shows the dashboard that depicts the project portfolio management which covers the quarterly project delivery roadmap and health card with project funding, resource allocation, portfolio risks such as open change requests, open risks and issues, etc. Pitch your topic with ease and precision using this Dashboard Showing Project Portfolio Metrics Microsoft PDF. This layout presents information on Resource Allocation, Portfolio Risks, Project Funding. It is also available for immediate download and adjustment. So, changes can be made in the color, design, graphics or any other component to create a unique layout.
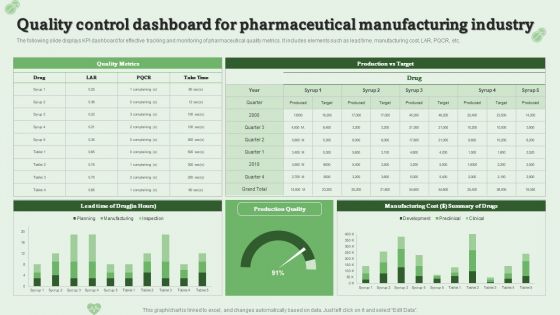
Quality Control Dashboard For Pharmaceutical Manufacturing Industry Ppt PowerPoint Presentation Model Layouts PDF
The following slide displays KPI dashboard for effective tracking and monitoring of pharmaceutical quality metrics. It includes elements such as lead time, manufacturing cost, LAR, PQCR, etc.Pitch your topic with ease and precision using this Quality Control Dashboard For Pharmaceutical Manufacturing Industry Ppt PowerPoint Presentation Model Layouts PDF. This layout presents information on Manufacturing Cost, Summary Drugs, Quality Metrics. It is also available for immediate download and adjustment. So, changes can be made in the color, design, graphics or any other component to create a unique layout.
Human Resource Analytics Metrics For Business Startups Icons Pdf
This slide illustrates KPI for human resource department that help organization to analyze current workforce performance efficiency. It include key performance indicators such as turnover ratio, talent rating, training cost etc.Pitch your topic with ease and precision using this Human Resource Analytics Metrics For Business Startups Icons Pdf This layout presents information on Hiring Cost, Turnover Ratio, Talent Rating It is also available for immediate download and adjustment. So, changes can be made in the color, design, graphics or any other component to create a unique layout.
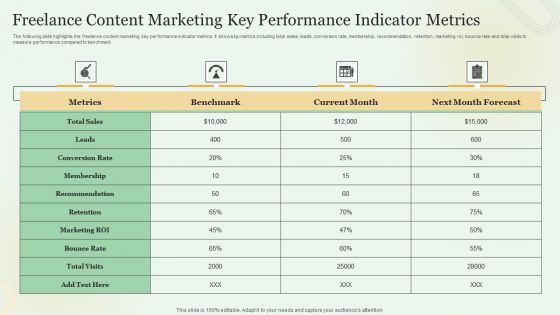
Freelance Content Marketing Key Performance Indicator Metrics Slides PDF
The following slide highlights the freelance content marketing key performance indicator metrics. It shows kpi metrics including total sales, leads, conversion rate, membership, recommendation, retention, marketing roi, bounce rate and total visits to measure performance compared to benchmark. Pitch your topic with ease and precision using this Freelance Content Marketing Key Performance Indicator Metrics Slides PDF. This layout presents information on Total Sales, Conversion Rate, Bounce Rate. It is also available for immediate download and adjustment. So, changes can be made in the color, design, graphics or any other component to create a unique layout.

Table Of Contents Quality Assurance Model For Agile IT Formats PDF
Presenting table of contents quality assurance model for agile it formats pdf to provide visual cues and insights. Share and navigate important information on eleven stages that need your due attention. This template can be used to pitch topics like effectively managing, resource pool, kpi dashboard, monitor software development, project status, agile model implementation, challenges and solutions. In addtion, this PPT design contains high resolution images, graphics, etc, that are easily editable and available for immediate download.
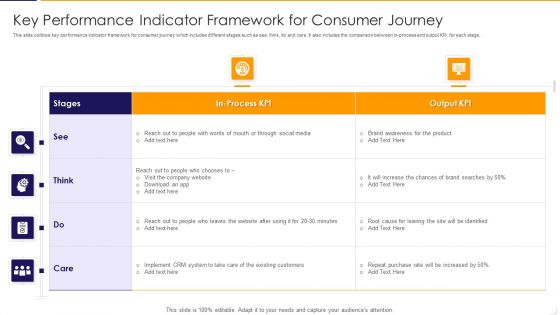
Key Performance Indicator Framework For Consumer Journey Ppt PowerPoint Presentation Gallery Good PDF
This slide outlines key performance indicator framework for consumer journey which includes different stages such as see, think, do and care. It also includes the comparison between in process and output KPI for each stage. Pitch your topic with ease and precision using this key performance indicator framework for consumer journey ppt powerpoint presentation gallery good pdf This layout presents information on social media, system, implement. It is also available for immediate download and adjustment. So, changes can be made in the color, design, graphics or any other component to create a unique layout.
ATS Administration To Improve Barcode Scanner Benefits For Effective Asset Tracking Clipart PDF
This slide covers key benefits of implementing barcode scanner for effective asset tracking. It involves advantages such as greater efficiency, workflow transparency and effective KPI accuracy. Present like a pro with ATS Administration To Improve Barcode Scanner Benefits For Effective Asset Tracking Clipart PDF Create beautiful presentations together with your team, using our easy-to-use presentation slides. Share your ideas in real-time and make changes on the fly by downloading our templates. So whether youre in the office, on the go, or in a remote location, you can stay in sync with your team and present your ideas with confidence. With Slidegeeks presentation got a whole lot easier. Grab these presentations today.
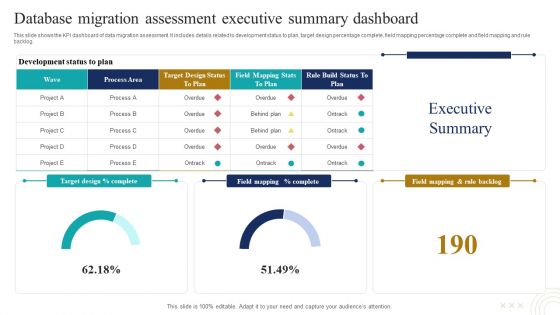
Database Migration Assessment Executive Summary Dashboard Mockup PDF
This slide shows the KPI dashboard of data migration assessment. It includes details related to development status to plan, target design percentage complete, field mapping percentage complete and field mapping and rule backlog. Pitch your topic with ease and precision using this Database Migration Assessment Executive Summary Dashboard Mockup PDF. This layout presents information on Wave, Process Area, Rule Build Status Plan. It is also available for immediate download and adjustment. So, changes can be made in the color, design, graphics or any other component to create a unique layout
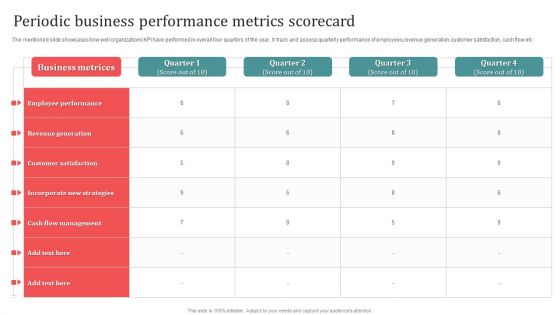
Periodic Business Performance Metrics Scorecard Ideas PDF
The mentioned slide showcases how well organizations KPI have performed in overall four quarters of the year. It track and assess quarterly performance of employees,revenue generation,customer satisfaction, cash flow etc. Pitch your topic with ease and precision using this Periodic Business Performance Metrics Scorecard Ideas PDF. This layout presents information on Employee Performance, Revenue Generation, Customer Satisfaction. It is also available for immediate download and adjustment. So, changes can be made in the color, design, graphics or any other component to create a unique layout.
Tracking Working Of Employees In Software Companies Summary Pdf
Following slide shows tracking employees hours worked in software companies which assist in to check productivity of employee on daily basis. It includes various KPI such as email received, actual response , average working hours, etc. Pitch your topic with ease and precision using this Tracking Working Of Employees In Software Companies Summary Pdf This layout presents information on Tracking Traffic, Tracking Working, Software Companies It is also available for immediate download and adjustment. So, changes can be made in the color, design, graphics or any other component to create a unique layout.
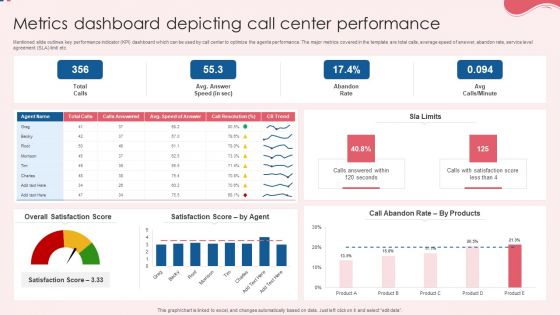
Metrics Dashboard Depicting Call Center Performance Pictures PDF
Mentioned slide outlines key performance indicator KPI dashboard which can be used by call center to optimize the agents performance. The major metrics covered in the template are total calls, average speed of answer, abandon rate, service level agreement SLA limit etc. Pitch your topic with ease and precision using this Metrics Dashboard Depicting Call Center Performance Pictures PDF. This layout presents information on Overall Satisfaction Score, Satisfaction Score, Performance. It is also available for immediate download and adjustment. So, changes can be made in the color, design, graphics or any other component to create a unique layout.
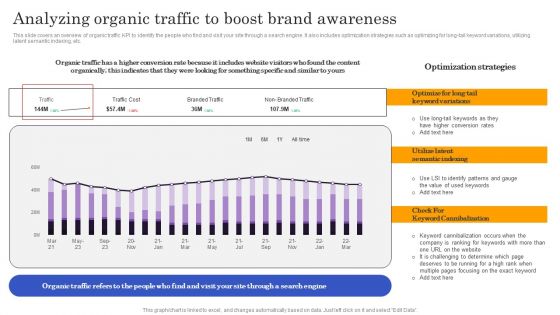
Marketers Guide To Data Analysis Optimization Analyzing Organic Traffic To Boost Brand Awareness Download PDF
This slide covers an overview of organic traffic KPI to identify the people who find and visit your site through a search engine. It also includes optimization strategies such as optimizing for long-tail keyword variations, utilizing latent semantic indexing, etc. If your project calls for a presentation, then Slidegeeks is your go to partner because we have professionally designed, easy to edit templates that are perfect for any presentation. After downloading, you can easily edit Marketers Guide To Data Analysis Optimization Analyzing Organic Traffic To Boost Brand Awareness Download PDF and make the changes accordingly. You can rearrange slides or fill them with different images. Check out all the handy templates
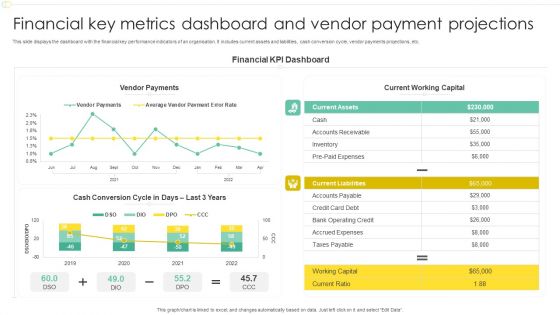
Financial Key Metrics Dashboard And Vendor Payment Projections Professional PDF
This slide displays the dashboard with the financial key performance indicators of an organisation. It includes current assets and liabilities, cash conversion cycle, vendor payments projections, etc. Pitch your topic with ease and precision using this Financial Key Metrics Dashboard And Vendor Payment Projections Professional PDF. This layout presents information on Financial KPI Dashboard, Current Working Capital, Vendor Payments. It is also available for immediate download and adjustment. So, changes can be made in the color, design, graphics or any other component to create a unique layout.
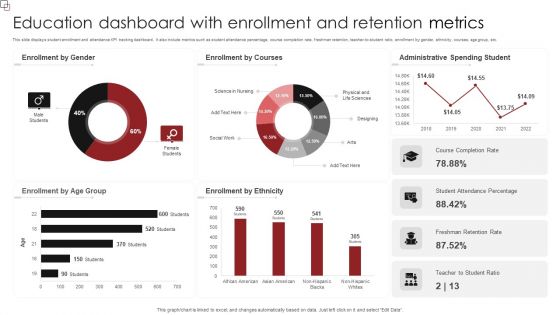
Education Dashboard With Enrollment And Retention Metrics Sample PDF
This slide displays student enrollment and attendance KPI tracking dashboard. It also include metrics such as student attendance percentage, course completion rate, freshman retention, teacher-to-student ratio, enrollment by gender, ethnicity, courses, age group, etc. Pitch your topic with ease and precision using this Education Dashboard With Enrollment And Retention Metrics Sample PDF. This layout presents information on Enrollment Gender, Enrollment Courses, Administrative Spending Student. It is also available for immediate download and adjustment. So, changes can be made in the color, design, graphics or any other component to create a unique layout.

Dashboard To Assess IT Security Awareness Training Program Efficiency Brochure PDF
This slide covers KPI dashboard to assess training program efficiency. It involves details such as overall responses on monthly basis, employee satisfaction rate, net promoter score and major training courses. Pitch your topic with ease and precision using this Dashboard To Assess IT Security Awareness Training Program Efficiency Brochure PDF. This layout presents information on Major Training Course, Major Satisfactory, Training Course. It is also available for immediate download and adjustment. So, changes can be made in the color, design, graphics or any other component to create a unique layout.

Workforce Performance Metrics Scorecard To Measure Training Effectiveness Information PDF
Mentioned slide outlines HR KPI scorecard showcasing most important kpis. Organization can measure the success rate of HR strategy by tracking metrics such as training effectiveness, absence rate and cost, benefits satisfaction, productivity rate, net promotor score, etc.Pitch your topic with ease and precision using this Workforce Performance Metrics Scorecard To Measure Training Effectiveness Information PDF. This layout presents information on Absence Rate, Internal Promotion, Engagement Index. It is also available for immediate download and adjustment. So, changes can be made in the color, design, graphics or any other component to create a unique layout.
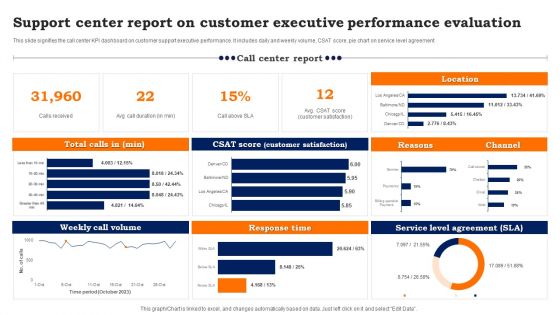
Support Center Report On Customer Executive Performance Evaluation Background PDF
This slide signifies the call center KPI dashboard on customer support executive performance. It includes daily and weekly volume, CSAT score, pie chart on service level agreement. Pitch your topic with ease and precision using this Support Center Report On Customer Executive Performance Evaluation Background PDF. This layout presents information on Weekly Call Volume, Response Time, Service Level Agreement. It is also available for immediate download and adjustment. So, changes can be made in the color, design, graphics or any other component to create a unique layout.

Business Sales Procedures Improvement Dashboard Designs PDF
Following slide shows the dashboard for reengineering business sales processes which assist in accelerated processing times, lower costs, better customer service, and stronger employee retention. The KPI are proposals ,opportunities, etc. Pitch your topic with ease and precision using this Business Sales Procedures Improvement Dashboard Designs PDF. This layout presents information on Deals Opportunities Ratios, Opportunity, Deals Conversion Ratio. It is also available for immediate download and adjustment. So, changes can be made in the color, design, graphics or any other component to create a unique layout.
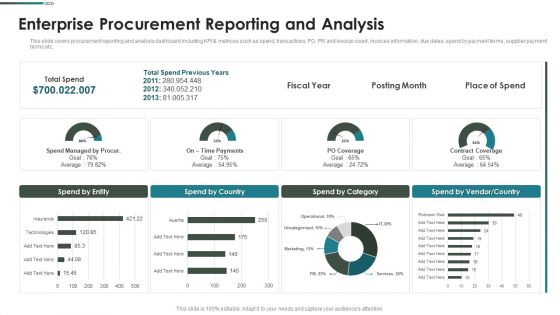
Purchase Assessment Process Enterprise Procurement Reporting And Analysis Infographics PDF
This slide covers procurement reporting and analysis dashboard including KPI metrices such as spend, transactions, PO, PR and invoice count, invoices information, due dates, spend by payment terms, supplier payment terms etc. Deliver an awe inspiring pitch with this creative Purchase Assessment Process Enterprise Procurement Reporting And Analysis Infographics PDF bundle. Topics like Spend Entity, Spend Country, Spend Category can be discussed with this completely editable template. It is available for immediate download depending on the needs and requirements of the user.
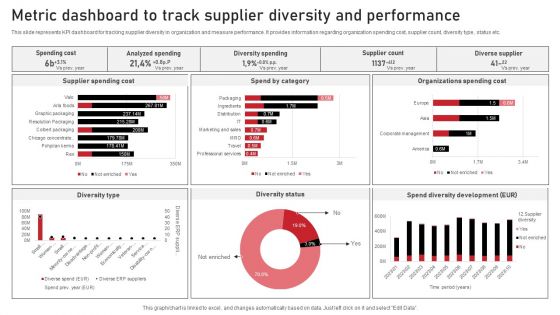
Metric Dashboard To Track Supplier Diversity And Performance Designs PDF
This slide represents KPI dashboard for tracking supplier diversity in organization and measure performance. It provides information regarding organization spending cost, supplier count, diversity type, status etc. Pitch your topic with ease and precision using this Metric Dashboard To Track Supplier Diversity And Performance Designs PDF. This layout presents information on Diversity Type, Diversity Status, Diverse Supplier. It is also available for immediate download and adjustment. So, changes can be made in the color, design, graphics or any other component to create a unique layout.

Customer Service Metrics Dashboard With Net Retention Rate Sample PDF
This slide showcases KPI dashboard for customer service that can help to compare the customer churn rate, revenue churn rate, net retention rate and MRR growth rate as compared to previous month. Its key elements are net promoter score, loyal customer rate, percentage of premium users and customer lifetime value. Pitch your topic with ease and precision using this Customer Service Metrics Dashboard With Net Retention Rate Sample PDF. This layout presents information on Loyal Customer Rate, Premium Users, Customer Lifetime Value. It is also available for immediate download and adjustment. So, changes can be made in the color, design, graphics or any other component to create a unique layout.

Marketing Objectives And Metrics With Key Strategies Formats PDF
The purpose of this slide is to showcase different objectives and KPIs of the marketing team. The KPI could be customer lifetime value digital marketing ROI landing page conversion rate and lead to customer ratio. Pitch your topic with ease and precision using this Marketing Objectives And Metrics With Key Strategies Formats PDF. This layout presents information on Key Strategies, Conversion Rate, Customer Lifetime Value. It is also available for immediate download and adjustment. So, changes can be made in the color, design, graphics or any other component to create a unique layout.
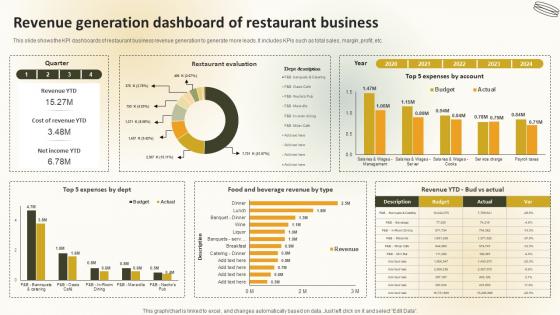
Revenue Generation Dashboard Of Restaurant Business Create An Effective Restaurant
This slide shows the KPI dashboards of restaurant business revenue generation to generate more leads. It includes KPIs such as total sales, margin,profit, etc. Present like a pro with Revenue Generation Dashboard Of Restaurant Business Create An Effective Restaurant. Create beautiful presentations together with your team, using our easy-to-use presentation slides. Share your ideas in real-time and make changes on the fly by downloading our templates. So whether you are in the office, on the go, or in a remote location, you can stay in sync with your team and present your ideas with confidence. With Slidegeeks presentation got a whole lot easier. Grab these presentations today.
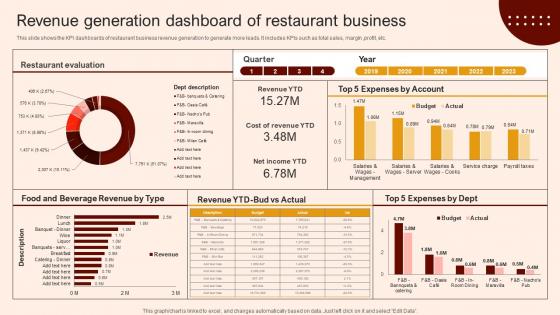
Create A Restaurant Marketing Revenue Generation Dashboard Of Restaurant
This slide shows the KPI dashboards of restaurant business revenue generation to generate more leads. It includes KPIs such as total sales, margin ,profit, etc. Present like a pro with Create A Restaurant Marketing Revenue Generation Dashboard Of Restaurant. Create beautiful presentations together with your team, using our easy-to-use presentation slides. Share your ideas in real-time and make changes on the fly by downloading our templates. So whether you are in the office, on the go, or in a remote location, you can stay in sync with your team and present your ideas with confidence. With Slidegeeks presentation got a whole lot easier. Grab these presentations today.
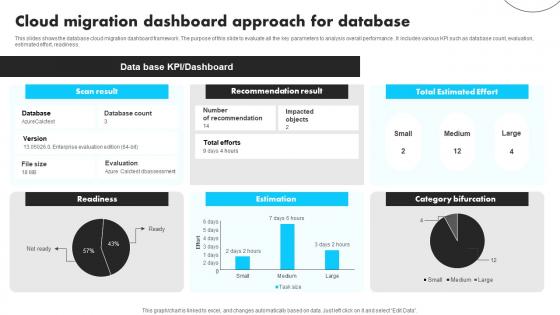
Cloud Migration Dashboard Approach For Database Guidelines Pdf
This slides shows the database cloud migration dashboard framework. The purpose of this slide to evaluate all the key parameters to analysis overall performance . It includes various KPI such as database count, evaluation, estimated effort, readiness. Pitch your topic with ease and precision using this Cloud Migration Dashboard Approach For Database Guidelines Pdf This layout presents information on Recommendation Result, Total Estimated Effort, Estimation It is also available for immediate download and adjustment. So, changes can be made in the color, design, graphics or any other component to create a unique layout.
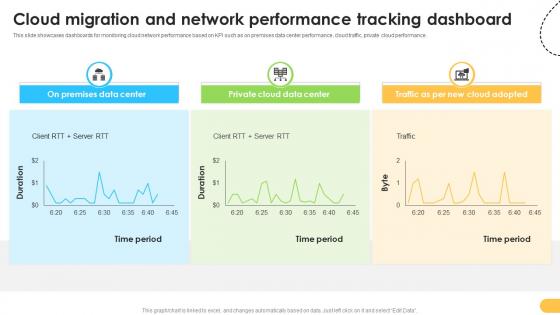
Cloud Migration And Network Performance Data Migration From On Premises
This slide showcases dashboards for monitoring cloud network performance based on KPI such as on premises data center performance, cloud traffic, private cloud performance. Present like a pro with Cloud Migration And Network Performance Data Migration From On Premises. Create beautiful presentations together with your team, using our easy-to-use presentation slides. Share your ideas in real-time and make changes on the fly by downloading our templates. So whether you are in the office, on the go, or in a remote location, you can stay in sync with your team and present your ideas with confidence. With Slidegeeks presentation got a whole lot easier. Grab these presentations today.
Effective Data Migration Cloud Migration And Network Performance Tracking
This slide showcases dashboards for monitoring cloud network performance based on KPI such as on premises data center performance, cloud traffic, private cloud performance. Present like a pro with Effective Data Migration Cloud Migration And Network Performance Tracking. Create beautiful presentations together with your team, using our easy-to-use presentation slides. Share your ideas in real-time and make changes on the fly by downloading our templates. So whether you are in the office, on the go, or in a remote location, you can stay in sync with your team and present your ideas with confidence. With Slidegeeks presentation got a whole lot easier. Grab these presentations today.
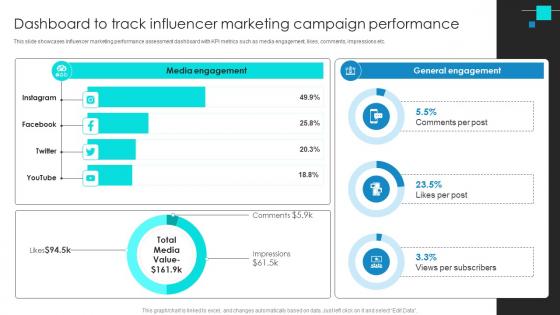
Project Benchmarking Process Dashboard To Track Influencer Marketing Campaign CRP DK SS V
This slide showcases influencer marketing performance assessment dashboard with KPI metrics such as media engagement, likes, comments, impressions etc. If your project calls for a presentation, then Slidegeeks is your go-to partner because we have professionally designed, easy-to-edit templates that are perfect for any presentation. After downloading, you can easily edit Project Benchmarking Process Dashboard To Track Influencer Marketing Campaign CRP DK SS V and make the changes accordingly. You can rearrange slides or fill them with different images. Check out all the handy templates

Enterprise Recruitment Dashboard With Cost Per Hire Graphics PDF
The following slide showcases KPI dashboard to get real- time insights about efficiency of corporate staffing process in the organization. It includes elements such as hired, days to fill, sources contribution, etc. Pitch your topic with ease and precision using this Enterprise Recruitment Dashboard With Cost Per Hire Graphics PDF. This layout presents information on Enterprise, Contribution, Cost. It is also available for immediate download and adjustment. So, changes can be made in the color, design, graphics or any other component to create a unique layout.

Competency Skill Mapping Dashboard Of Employees Formats Pdf
This slide shows the employee competency skill mapping dashboard .The purpose of this slides to analyze the employee skill gaps which hamper the organization targets .It includes various KPI such as specialization, employee count, head count, etc. Pitch your topic with ease and precision using this Competency Skill Mapping Dashboard Of Employees Formats Pdf This layout presents information on Employee Specialization, Building Specializations, Specialization It is also available for immediate download and adjustment. So, changes can be made in the color, design, graphics or any other component to create a unique layout.

Strategies To Implement Big Data Analytics In Manufacturing Industry Portrait Pdf
This slide showcases key methods to establish big data technology in manufacturing business. It includes various tactics such as establishing transparent business KPI and measuring ROI, analyzing manufacturing problems and ensuring effective big data engineering process.Pitch your topic with ease and precision using this Strategies To Implement Big Data Analytics In Manufacturing Industry Portrait Pdf This layout presents information on Determine Areas, Performance Design Metrics, Performance Measured It is also available for immediate download and adjustment. So, changes can be made in the color, design, graphics or any other component to create a unique layout.

Internal Audit Metrics Flowchart Ppt Infographic Template Example Introduction PDF
This slide depicts the flowchart for the internal audit KPI metrics. It includes the information related to steps involved in the audit process and planning. Presenting Internal Audit Metrics Flowchart Ppt Infographic Template Example Introduction PDF to dispense important information. This template comprises one stages. It also presents valuable insights into the topics including Audit Members, Risk Assessment, Audit Scheduling. This is a completely customizable PowerPoint theme that can be put to use immediately. So, download it and address the topic impactfully.

 Home
Home