Change Management Kpi

Digital Category Marketing Strategy Dashboard With Leads Conversation Ppt PowerPoint Presentation Slides Information PDF
This graph chart is linked to excel, and changes automatically based on data. Just left click on it and select edit data. Pitch your topic with ease and precision using this digital category marketing strategy dashboard with leads conversation ppt powerpoint presentation slides information pdf. This layout presents information on key conversion metrics, social media channels, lead by program. It is also available for immediate download and adjustment. So, changes can be made in the color, design, graphics or any other component to create a unique layout.
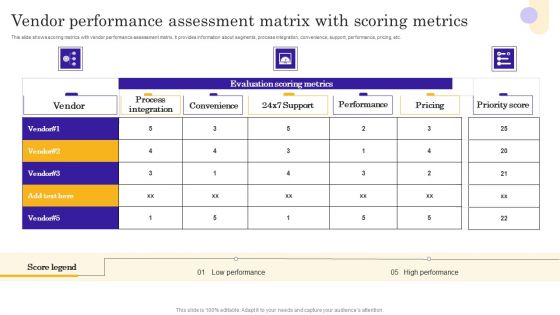
Vendor Performance Assessment Matrix With Scoring Metrics Style PDF
This slide shows scoring metrics with vendor performance assessment matrix. It provides information about segments, process integration, convenience, support, performance, pricing, etc. Pitch your topic with ease and precision using this Vendor Performance Assessment Matrix With Scoring Metrics Style PDF. This layout presents information on Process Integration, Convenience, Performance. It is also available for immediate download and adjustment. So, changes can be made in the color, design, graphics or any other component to create a unique layout.
New Commodity Development Assessment Metrics Icons PDF
The following slide highlights the key metrics to evaluate product performance. It includes elements such as product wise revenue, time to the market etc.Pitch your topic with ease and precision using this New Commodity Development Assessment Metrics Icons PDF. This layout presents information on Annual Product, Wise Revenue, Shown Continuous. It is also available for immediate download and adjustment. So, changes can be made in the color, design, graphics or any other component to create a unique layout.

Startup Business Financial Dashboard With Key Metrics Sample PDF
This slide represents the financial dashboard for startup company with key performance indicators. It includes details related to current working capital, cash conversion cycle in days and vendor payment error rate. Pitch your topic with ease and precision using this Startup Business Financial Dashboard With Key Metrics Sample PDF. This layout presents information on Cash Conversion Cycle, Current Working Capital, Current Liabilities Debt. It is also available for immediate download and adjustment. So, changes can be made in the color, design, graphics or any other component to create a unique layout.

Key Performance Indicators Of IBN Outsourcing Company PPT Presentation SS
The slide shows the key Performance Indicator KPIs which will help the company to track the success rate of implemented strategies. Some of the KPIs are Customer Attrition Rate, Product, Service Adoption Rate, Average Customer Queue Time , Customer Satisfaction Rate etc. Are you in need of a template that can accommodate all of your creative concepts This one is crafted professionally and can be altered to fit any style. Use it with Google Slides or PowerPoint. Include striking photographs, symbols, depictions, and other visuals. Fill, move around, or remove text boxes as desired. Test out color palettes and font mixtures. Edit and save your work, or work with colleagues. Download Key Performance Indicators Of IBN Outsourcing Company PPT Presentation SS and observe how to make your presentation outstanding. Give an impeccable presentation to your group and make your presentation unforgettable.

Production And Dashboard To Track Performance Of Manufacturing Operations Techniques Post Automation Tips Pdf
This slide depicts a strategic dashboard used by organizations to track performance of manufacturing operations after automating production processes. The key performance indicators are productivity before vs after automation, productivity increase rate post automation etc. Pitch your topic with ease and precision using this Production And Dashboard To Track Performance Of Manufacturing Operations Techniques Post Automation Tips Pdf This layout presents information on Productivity Before, After Automation, Process Completion It is also available for immediate download and adjustment. So, changes can be made in the color, design, graphics or any other component to create a unique layout.

Procurement Pricing Benchmarks Analysis Report With Key Metrics Designs PDF
This slide shows the report representing the procurement price benchmarks for various organizations. It represents analysis of market average, best-in-class and all others on the basis of procurement key metrics. Pitch your topic with ease and precision using this Procurement Pricing Benchmarks Analysis Report With Key Metrics Designs PDF. This layout presents information on Spend Under Management, Contract Complaint. It is also available for immediate download and adjustment. So, changes can be made in the color, design, graphics or any other component to create a unique layout.

Dashboard Showing Performance Brand Building Techniques To Gain Competitive Edge Topics Pdf
The following slide outlines the key performance indicator dashboard used by the organization to evaluate the effectiveness of multiple marketing campaigns. It provides information about total spending, impressions, acquisitions, cost per acquisition, clicks, etc. If your project calls for a presentation, then Slidegeeks is your go to partner because we have professionally designed, easy to edit templates that are perfect for any presentation. After downloading, you can easily edit Dashboard Showing Performance Brand Building Techniques To Gain Competitive Edge Topics Pdf and make the changes accordingly. You can rearrange slides or fill them with different images. Check out all the handy templates
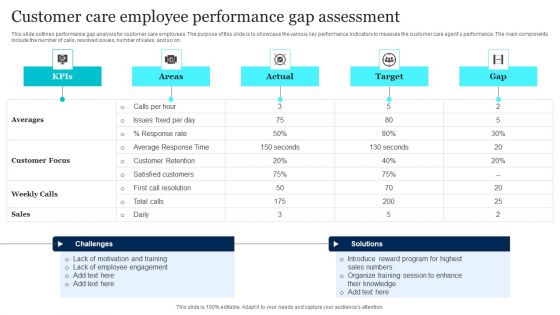
Customer Care Employee Performance Gap Assessment Download PDF
This slide outlines performance gap analysis for customer care employees. The purpose of this slide is to showcase the various key performance indicators to measure the customer care agents performance. The main components include the number of calls, resolved issues, number of sales, and so on. Pitch your topic with ease and precision using this Customer Care Employee Performance Gap Assessment Download PDF. This layout presents information on Employee Engagement, Organize Training, Sales Numbers. It is also available for immediate download and adjustment. So, changes can be made in the color, design, graphics or any other component to create a unique layout.

Website Medical Checkup Key Metrics Themes PDF
The following slide showcases key metrics for checking website health score to boost performance. It includes key metrics like functionality, security, design, structure, content and engagement. Pitch your topic with ease and precision using this Website Medical Checkup Key Metrics Themes PDF. This layout presents information on Evaluate Performance, Environment, Metrics. It is also available for immediate download and adjustment. So, changes can be made in the color, design, graphics or any other component to create a unique layout.
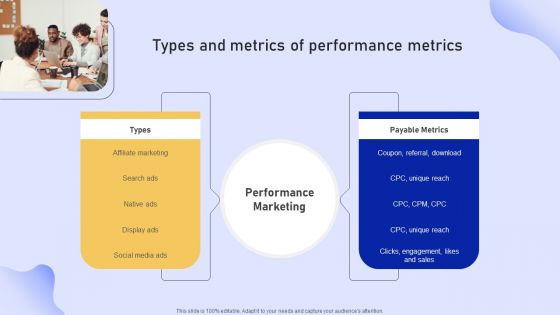
Online Marketing Strategy For Lead Generation Types And Metrics Of Performance Metrics Rules PDF

Multichannel Plan Framework With Web Spectrum Ppt Professional Background Images PDF
Pitch your topic with ease and precision using this multichannel plan framework with web spectrum ppt professional background images pdf. This layout presents information on strategy, marketing, operations, metrics, goal. It is also available for immediate download and adjustment. So, changes can be made in the color, design, graphics or any other component to create a unique layout.

IT Team Performance Gap Assessment Slides PDF
This slide represents the performance gap analysis of IT team. The purpose of this slide is to demonstrate the various performance tracking metrics of IT team and gap between current and desired state. It also include the challenges that IT team experiencing and their solutions too. Pitch your topic with ease and precision using this IT Team Performance Gap Assessment Slides PDF. This layout presents information on Develop, Incident Management, Plan. It is also available for immediate download and adjustment. So, changes can be made in the color, design, graphics or any other component to create a unique layout.
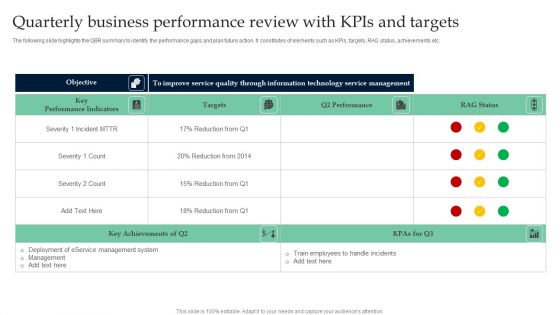
Quarterly Business Performance Review With Kpis And Targets Summary PDF
The following slide highlights the QBR summary to identify the performance gaps and plan future action. It constitutes of elements such as KPIs, targets, RAG status, achievements etc. Pitch your topic with ease and precision using this Quarterly Business Performance Review With Kpis And Targets Summary PDF. This layout presents information on Key Performance Indicators, Targets, Technology Service Management. It is also available for immediate download and adjustment. So, changes can be made in the color, design, graphics or any other component to create a unique layout.
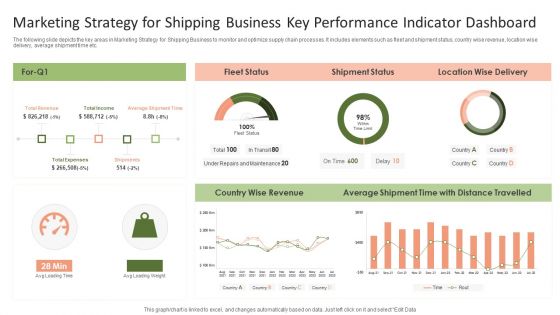
Marketing Strategy For Shipping Business Key Performance Indicator Dashboard Graphics PDF
The following slide depicts the key areas in Marketing Strategy for Shipping Business to monitor and optimize supply chain processes. It includes elements such as fleet and shipment status, country wise revenue, location wise delivery, average shipment time etc.Pitch your topic with ease and precision using this Marketing Strategy For Shipping Business Key Performance Indicator Dashboard Graphics PDF. This layout presents information on Shipment Status, Average Shipment, Wise Revenue. It is also available for immediate download and adjustment. So, changes can be made in the color, design, graphics or any other component to create a unique layout.
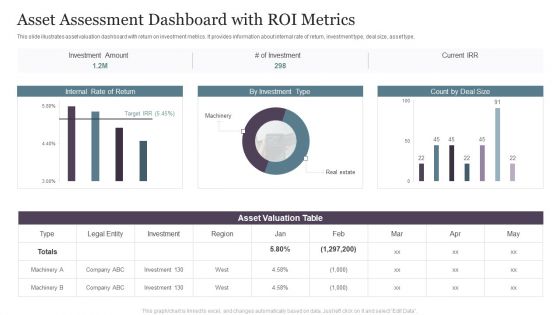
Asset Assessment Dashboard With ROI Metrics Topics PDF
This slide illustrates asset valuation dashboard with return on investment metrics. It provides information about internal rate of return, investment type, deal size, asset type, Pitch your topic with ease and precision using this Asset Assessment Dashboard With ROI Metrics Topics PDF. This layout presents information on Investment Amount, Asset Valuation, Internal Return. It is also available for immediate download and adjustment. So, changes can be made in the color, design, graphics or any other component to create a unique layout.

Cash Flow Metrics To Measure Firm Operations Effectiveness Ppt Outline Infographic Template PDF
This slide showcases yearly cash conversion cycle to determine companys working capital management. It includes DSO, DIO, DPO and CCC that measure the average number of days organization takes to collect payment and pay bills. Pitch your topic with ease and precision using this Cash Flow Metrics To Measure Firm Operations Effectiveness Ppt Outline Infographic Template PDF. This layout presents information on Cash Conversion Cycle, 2019 To 2022, Cash Flow. It is also available for immediate download and adjustment. So, changes can be made in the color, design, graphics or any other component to create a unique layout.
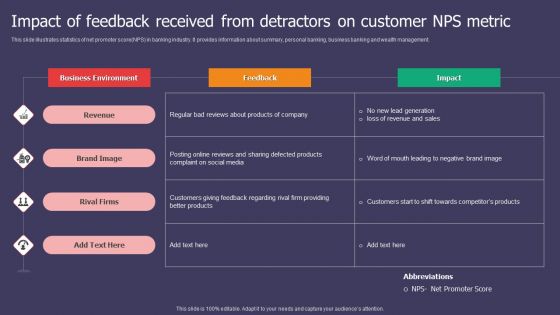
Impact Of Feedback Received From Detractors On Customer NPS Metric Ppt Inspiration Visuals PDF
This slide illustrates statistics of net promoter score NPS in banking industry. It provides information about summary, personal banking, business banking and wealth management. Pitch your topic with ease and precision using this Impact Of Feedback Received From Detractors On Customer NPS Metric Ppt Inspiration Visuals PDF. This layout presents information on Business Environment, Feedback, Revenue. It is also available for immediate download and adjustment. So, changes can be made in the color, design, graphics or any other component to create a unique layout.
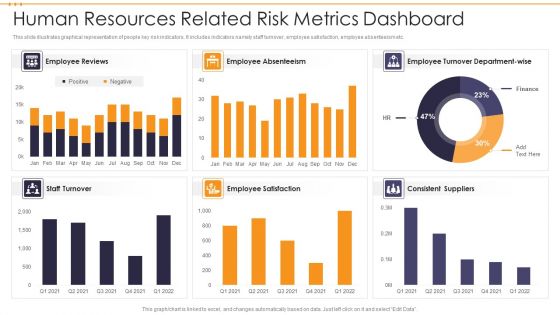
Human Resources Related Risk Metrics Dashboard Information PDF
This slide illustrates graphical representation of people key risk indicators. It includes indicators namely staff turnover, employee satisfaction, employee absenteeism etc. Pitch your topic with ease and precision using this Human Resources Related Risk Metrics Dashboard Information PDF. This layout presents information on Human Resources Related Risk Metrics Dashboard. It is also available for immediate download and adjustment. So, changes can be made in the color, design, graphics or any other component to create a unique layout.
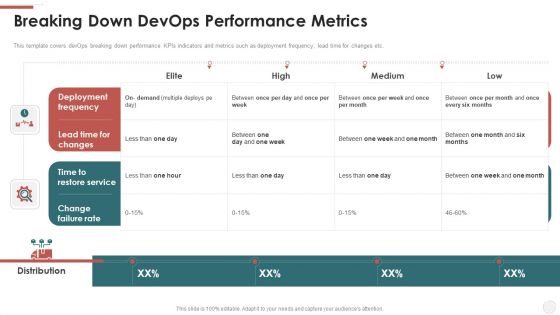
Breaking Down Devops Performance Metrics Ppt Styles Template PDF
This template covers devOps breaking down performance KPIs indicators and metrics such as deployment frequency, lead time for changes etc. Deliver and pitch your topic in the best possible manner with this breaking down devops performance metrics ppt styles template pdf. Use them to share invaluable insights on service, deployment and impress your audience. This template can be altered and modified as per your expectations. So, grab it now.
Pareto Analysis Shipping Tracking Metrics Dashboard Guidelines PDF
This slide showcases dashboard for analyzing on-time delivery trends. It also includes KPIs such as Pareto analysis and on-time deliveries by shipping organizations. Pitch your topic with ease and precision using this Pareto Analysis Shipping Tracking Metrics Dashboard Guidelines PDF. This layout presents information on Pareto Analysis, Deliveries Trends, Shipping Organization. It is also available for immediate download and adjustment. So, changes can be made in the color, design, graphics or any other component to create a unique layout.

Annual Financial Key Performance Indicators After RPA Guidelines PDF
This slide covers annual financial indicators of organization after the implementation of automation. It includes gross margin, return on sales, equity ratio, dynamic gearing, changes in unit sales, operating profit, inventory turnover, return on equity before tax, etc. Create an editable Annual Financial Key Performance Indicators After RPA Guidelines PDF that communicates your idea and engages your audience. Whether you are presenting a business or an educational presentation, pre-designed presentation templates help save time. Annual Financial Key Performance Indicators After RPA Guidelines PDF is highly customizable and very easy to edit, covering many different styles from creative to business presentations. Slidegeeks has creative team members who have crafted amazing templates. So, go and get them without any delay.

Annual Financial Key Performance Indicators Before RPA Download PDF
This slide covers current annual financial indicators of organization before the implementation of automation. It includes gross margin, return on sales, equity ratio, dynamic gearing, changes in unit sales, operating profit, cash flow, inventory turnover, return on equity before tax, etc. Slidegeeks is one of the best resources for PowerPoint templates. You can download easily and regulate Annual Financial Key Performance Indicators Before RPA Download PDF for your personal presentations from our wonderful collection. A few clicks is all it takes to discover and get the most relevant and appropriate templates. Use our Templates to add a unique zing and appeal to your presentation and meetings. All the slides are easy to edit and you can use them even for advertisement purposes.

Online Marketing Dashboard Showing Key Conversion Metrics Ppt PowerPoint Presentation Outline Example Topics PDF
Pitch your topic with ease and precision using this online marketing dashboard showing key conversion metrics ppt powerpoint presentation outline example topics pdf. This layout presents information on lead breakdown, leads, web user, top social media channels, key conversion metrics, trial leads by region. It is also available for immediate download and adjustment. So, changes can be made in the color, design, graphics or any other component to create a unique layout.
Tracking Pipeline Steps Using Sales Metrics Ppt PowerPoint Presentation File Outline PDF
Pitch your topic with ease and precision using this tracking pipeline steps using sales metrics ppt powerpoint presentation file outline pdf. This layout presents information on qualified leads every month, monthly sales cycle, number of leads at each stage of pipeline, win rate based on deal size. It is also available for immediate download and adjustment. So, changes can be made in the color, design, graphics or any other component to create a unique layout.

Staff Retention Balanced Scorecard Staff Retention Balanced Scorecard With Key Metrics Demonstration PDF
This graph or chart is linked to excel, and changes automatically based on data. Just left click on it and select Edit Data. Deliver and pitch your topic in the best possible manner with this Staff Retention Balanced Scorecard Staff Retention Balanced Scorecard With Key Metrics Demonstration PDF. Use them to share invaluable insights on Key Metrics Of Employee Retention, Presenteeism, Employee Retention Score and impress your audience. This template can be altered and modified as per your expectations. So, grab it now.
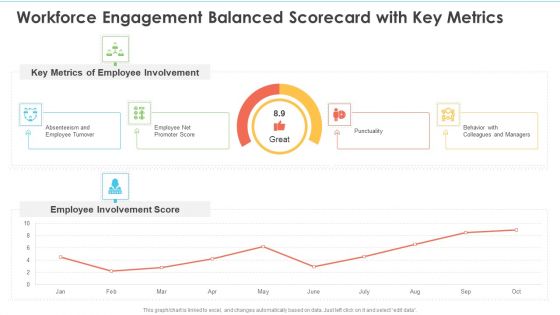
Workforce Engagement Balanced Scorecard With Key Metrics Ppt Inspiration Deck PDF
This graph or chart is linked to excel, and changes automatically based on data. Just left click on it and select edit data. Deliver an awe inspiring pitch with this creative Workforce Engagement Balanced Scorecard With Key Metrics Ppt Inspiration Deck PDF bundle. Topics like Key Metrics, Employee Involvement, Employee Involvement Score can be discussed with this completely editable template. It is available for immediate download depending on the needs and requirements of the user.

Customer NPS Metric With Revenue Growth Impact Ppt Show Portrait PDF
This slide illustrates net promoter score with revenue growth impact. It provides information about market average NPS, respondents, promoter, detractor, passive, etc. Pitch your topic with ease and precision using this Customer NPS Metric With Revenue Growth Impact Ppt Show Portrait PDF. This layout presents information on Promoter, Detractor, Passive. It is also available for immediate download and adjustment. So, changes can be made in the color, design, graphics or any other component to create a unique layout.

Success Metrics To Measure Influencer Marketing Campaign Performance Effective GTM Techniques Summary PDF
The following slide showcases different key performance indicators KPIs through which digital marketers can evaluate influencer marketing campaign performance. The key performance indicators outlined in slide are audience reach, impressions, followers growth, click-through rate CTR, revenue, and conversion rate. Present like a pro with Success Metrics To Measure Influencer Marketing Campaign Performance Effective GTM Techniques Summary PDF Create beautiful presentations together with your team, using our easy-to-use presentation slides. Share your ideas in real-time and make changes on the fly by downloading our templates. So whether you are in the office, on the go, or in a remote location, you can stay in sync with your team and present your ideas with confidence. With Slidegeeks presentation got a whole lot easier. Grab these presentations today.

6 Level IT Security Plan Maturity Model Slides PDF
This slide represent 6 level cyber security strategy maturity model illustrating levels such as initial, developing, defined, managed, optimization and unified. Pitch your topic with ease and precision using this 6 Level IT Security Plan Maturity Model Slides PDF. This layout presents information on Awareness, Organization Security, Metrics To Measure. It is also available for immediate download and adjustment. So, changes can be made in the color, design, graphics or any other component to create a unique layout.
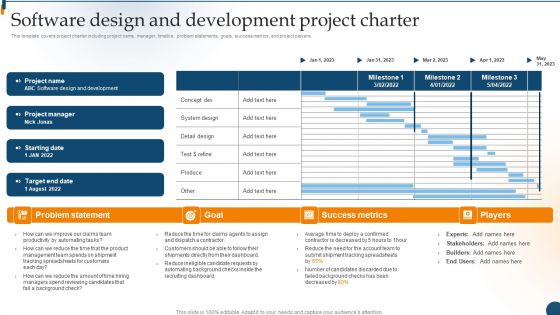
Design Software Playbook Engineers Software Design And Development Project Charter Slides PDF
This template covers project charter including project name, manager, timeline, problem statements, goals, success metrics, and project players. If your project calls for a presentation, then Slidegeeks is your go-to partner because we have professionally designed, easy-to-edit templates that are perfect for any presentation. After downloading, you can easily edit Design Software Playbook Engineers Software Design And Development Project Charter Slides PDF and make the changes accordingly. You can rearrange slides or fill them with different images. Check out all the handy templates.
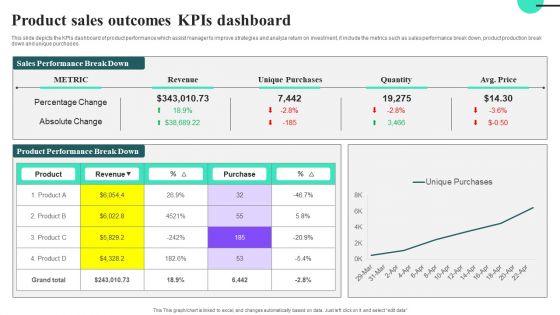
Product Sales Outcomes Kpis Dashboard Ideas PDF
This slide depicts the KPIs dashboard of product performance which assist manager to improve strategies and analyze return on investment, it include the metrics such as sales performance break down, product production break down and unique purchases.Showcasing this set of slides titled Product Sales Outcomes Kpis Dashboard Ideas PDF. The topics addressed in these templates are Percentage Change, Absolute Change. All the content presented in this PPT design is completely editable. Download it and make adjustments in color, background, font etc. as per your unique business setting.
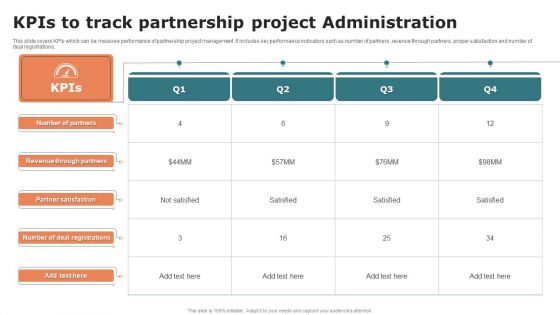
Kpis To Track Partnership Project Administration Graphics PDF
This slide covers KPIs which can be measure performance of partnership project management. It includes key performance indicators such as number of partners, revenue through partners, proper satisfaction and number of deal registrations. Pitch your topic with ease and precision using this Kpis To Track Partnership Project Administration Graphics PDF. This layout presents information on Partner Satisfaction, Revenue Through Partners, Number Of Partners. It is also available for immediate download and adjustment. So, changes can be made in the color, design, graphics or any other component to create a unique layout.
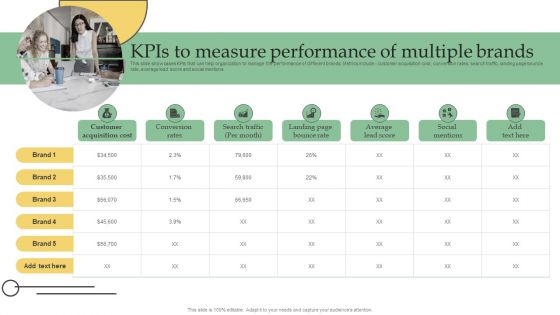
Kpis To Measure Performance Of Multiple Brands Ppt PowerPoint Presentation File Outline PDF
This slide showcases KPIs that can help organization to manage the performance of different brands. Metrics include customer acquisition cost, conversion rates, search traffic, landing page bounce rate, average lead score and social mentions. This Kpis To Measure Performance Of Multiple Brands Ppt PowerPoint Presentation File Outline PDF from Slidegeeks makes it easy to present information on your topic with precision. It provides customization options, so you can make changes to the colors, design, graphics, or any other component to create a unique layout. It is also available for immediate download, so you can begin using it right away. Slidegeeks has done good research to ensure that you have everything you need to make your presentation stand out. Make a name out there for a brilliant performance.
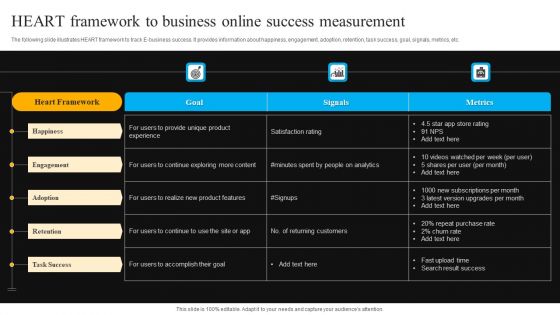
Heart Framework To Business Online Success Measurement Download PDF
The following slide illustrates HEART framework to track E-business success. It provides information about happiness, engagement, adoption, retention, task success, goal, signals, metrics, etc. Pitch your topic with ease and precision using this Heart Framework To Business Online Success Measurement Download PDF. This layout presents information on Heart Framework, Goal, Metrics. It is also available for immediate download and adjustment. So, changes can be made in the color, design, graphics or any other component to create a unique layout.
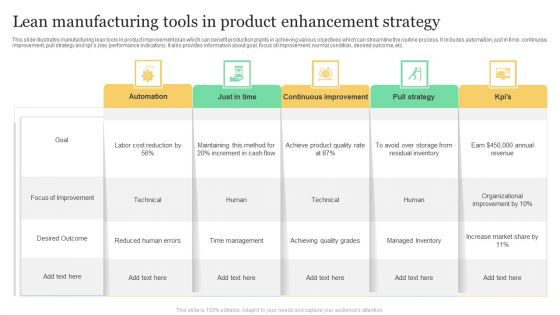
Lean Manufacturing Tools In Product Enhancement Strategy Graphics PDF
This slide illustrates manufacturing lean tools in product improvement plan which can benefit production plants in achieving various objectives which can streamline the routine process. It includes automation, just in time, continuous improvement, pull strategy and kpis key performance indicators. It also provides information about goal, focus of improvement, normal condition, desired outcome, etc. Pitch your topic with ease and precision using this Lean Manufacturing Tools In Product Enhancement Strategy Graphics PDF. This layout presents information on Automation, Desired Outcome, Time Management. It is also available for immediate download and adjustment. So, changes can be made in the color, design, graphics or any other component to create a unique layout.

Key Aspects Of Gap Analysis Ppt PowerPoint Presentation Guide
This is a key aspects of gap analysis ppt powerpoint presentation guide. This is a five stage process. The stages in this process are assurance, empathy, tangible, reliability, responsiveness.
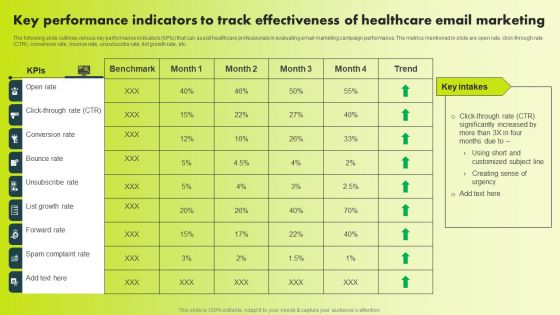
Key Performance Indicators To Track Effectiveness Of Healthcare Email Marketing Introduction PDF
The following slide outlines various key performance indicators KPIs that can assist healthcare professionals in evaluating email marketing campaign performance. The metrics mentioned in slide are open rate, click-through rate CTR, conversion rate, bounce rate, unsubscribe rate, list growth rate, etc. Present like a pro with Key Performance Indicators To Track Effectiveness Of Healthcare Email Marketing Introduction PDF Create beautiful presentations together with your team, using our easy-to-use presentation slides. Share your ideas in real-time and make changes on the fly by downloading our templates. So whether you are in the office, on the go, or in a remote location, you can stay in sync with your team and present your ideas with confidence. With Slidegeeks presentation got a whole lot easier. Grab these presentations today.
Kaizen Process Report With Improvement Metrics Ppt PowerPoint Presentation File Icons PDF
This slide focuses on the kaizen event report which covers process owner, key performance indicators, summary, problem description, improvement metrics, goals, daily milestones, team members and other considerations, etc. Pitch your topic with ease and precision using this Kaizen Process Report With Improvement Metrics Ppt PowerPoint Presentation File Icons PDF. This layout presents information on Key Performance Indoctrinator, Improvement Goal, Improvement Metric. It is also available for immediate download and adjustment. So, changes can be made in the color, design, graphics or any other component to create a unique layout.

Determining Risks In Sales Administration Procedure Key Metrics To Assess Effectiveness Of Sales Pictures PDF
The following slide highlights some key performance indicators to measure the effectiveness of sales risk evaluation on revenue performance. It includes elements such as opportunities, win rate, average time to win, sales velocity along with key insights etc. This Determining Risks In Sales Administration Procedure Key Metrics To Assess Effectiveness Of Sales Pictures PDF from Slidegeeks makes it easy to present information on your topic with precision. It provides customization options, so you can make changes to the colors, design, graphics, or any other component to create a unique layout. It is also available for immediate download, so you can begin using it right away. Slidegeeks has done good research to ensure that you have everything you need to make your presentation stand out. Make a name out there for a brilliant performance.
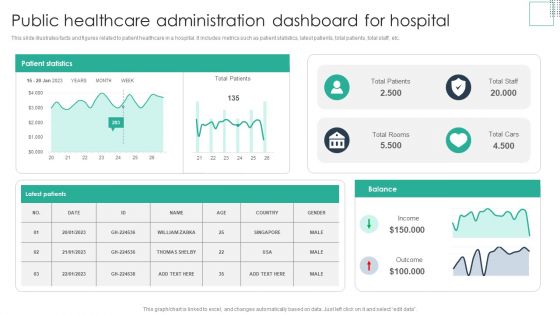
Public Healthcare Administration Dashboard For Hospital Guidelines PDF
This slide illustrates facts and figures related to patient healthcare in a hospital. It includes metrics such as patient statistics, latest patients, total patients, total staff, etc.Pitch your topic with ease and precision using this Public Healthcare Administration Dashboard For Hospital Guidelines PDF. This layout presents information on Total Patients, Total Rooms, Patient Statistics. It is also available for immediate download and adjustment. So, changes can be made in the color, design, graphics or any other component to create a unique layout.
Safety And Health Kpis For Tracking Performance Graph Mockup PDF
This slide represents graph showing key performance indicators tracked by companies for assessment of safety and health performance of their workplace. It includes key metrics such as workforce awareness, safety meetings held, recordable injuries, lost work days, compliance, severity rates etc. Pitch your topic with ease and precision using this Safety And Health Kpis For Tracking Performance Graph Mockup PDF. This layout presents information on Safety And Health, Kpis For Tracking, Performance Graph. It is also available for immediate download and adjustment. So, changes can be made in the color, design, graphics or any other component to create a unique layout.

Information Technology Project Budget Evaluation Plan Pictures PDF
This slide signifies the project key performance indicator dashboard to evaluate financial budget evaluation. It covers information regarding to allocated and used budget. Pitch your topic with ease and precision using this Information Technology Project Budget Evaluation Plan Pictures PDF. This layout presents information on Develop Risk Assessment Report, Environment, Security. It is also available for immediate download and adjustment. So, changes can be made in the color, design, graphics or any other component to create a unique layout.
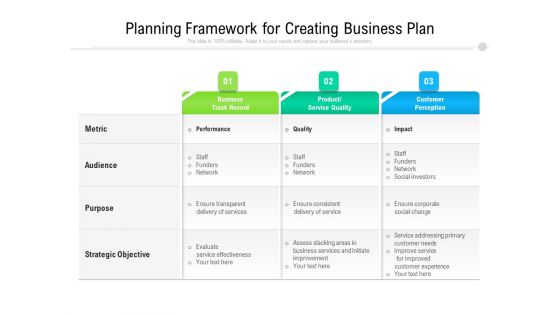
Planning Framework For Creating Business Plan Ppt PowerPoint Presentation Slides Infographics PDF
Pitch your topic with ease and precision using this planning framework for creating business plan ppt powerpoint presentation slides infographics pdf. This layout presents information on business track record, product, service quality, customer perception, metric, strategic objective, purpose, audience. It is also available for immediate download and adjustment. So, changes can be made in the color, design, graphics or any other component to create a unique layout.

Measuring Training And Development Program Key Performance Indicators Template PDF
The purpose of this slide is to showcase certain KPIs to measure the effectiveness of a training and development program. The specific measuring criteria include training skill assessment, recognizing change, employee engagement and training feedback. Persuade your audience using this Measuring Training And Development Program Key Performance Indicators Template PDF. This PPT design covers five stages, thus making it a great tool to use. It also caters to a variety of topics including Training Skill Assessment, Recognizing Change, Employee Engagement. Download this PPT design now to present a convincing pitch that not only emphasizes the topic but also showcases your presentation skills.

Strategic Policy Deployment With Annual Goals And Actions Ppt PowerPoint Presentation File Slide Download PDF
This slide illustrates the timeline for executing annual strategic goals and actions to be measured with key performance indicators. Pitch your topic with ease and precision using this strategic policy deployment with annual goals and actions ppt powerpoint presentation file slide download pdf. This layout presents information on goals, development, product design. It is also available for immediate download and adjustment. So, changes can be made in the color, design, graphics or any other component to create a unique layout.
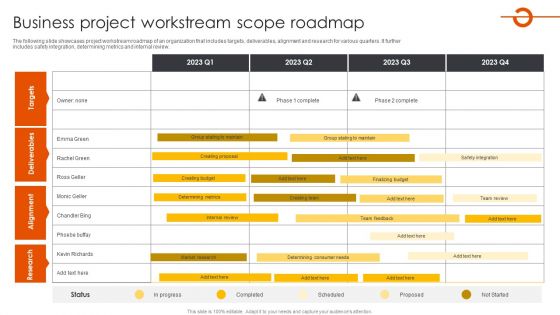
Business Project Workstream Scope Roadmap Demonstration PDF
The following slide showcases project workstream roadmap of an organization that includes targets, deliverables, alignment and research for various quarters. It further includes safety integration, determining metrics and internal review. Pitch your topic with ease and precision using this Business Project Workstream Scope Roadmap Demonstration PDF. This layout presents information on Research, Alignment, Deliverables, Targets. It is also available for immediate download and adjustment. So, changes can be made in the color, design, graphics or any other component to create a unique layout.

IT New Product Launch Journey Structure PDF
This slide demonstrates the new product introduction metrics of IT. It includes parameters such as NPI process metrics, metric calculation, etc. Pitch your topic with ease and precision using this IT New Product Launch Journey Structure PDF. This layout presents information on NPI Process Metrics, Project Delivery Timeliness, Data Source. It is also available for immediate download and adjustment. So, changes can be made in the color, design, graphics or any other component to create a unique layout.
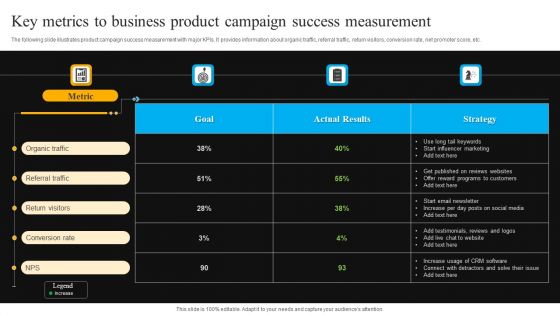
Key Metrics To Business Product Campaign Success Measurement Clipart PDF
The following slide illustrates product campaign success measurement with major KPIs. It provides information about organic traffic, referral traffic, return visitors, conversion rate, net promoter score, etc. Pitch your topic with ease and precision using this Key Metrics To Business Product Campaign Success Measurement Clipart PDF. This layout presents information on Organic Traffic, Referral Traffic, Return Visitors. It is also available for immediate download and adjustment. So, changes can be made in the color, design, graphics or any other component to create a unique layout.
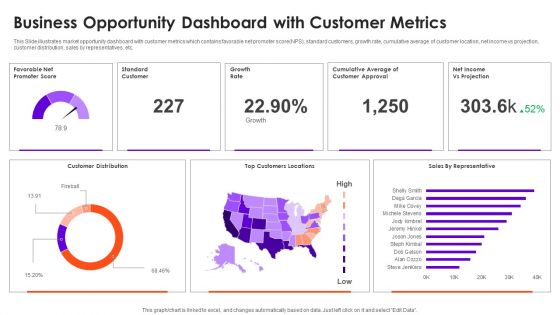
Business Opportunity Dashboard With Customer Metrics Information PDF
This Slide illustrates market opportunity dashboard with customer metrics which contains favorable net promoter score NPS, standard customers, growth rate, cumulative average of customer location, net income vs projection, customer distribution, sales by representatives, etc. Pitch your topic with ease and precision using this Business Opportunity Dashboard With Customer Metrics Information PDF. This layout presents information on Customer Distribution, Growth Rate, Top Customers Locations. It is also available for immediate download and adjustment. So, changes can be made in the color, design, graphics or any other component to create a unique layout.
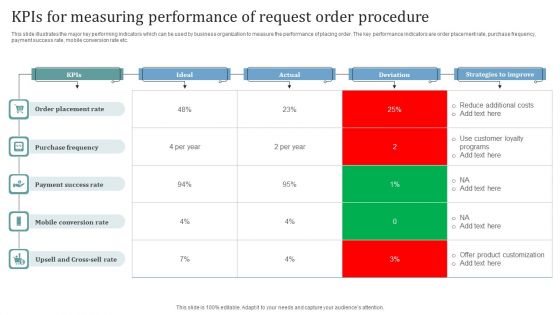
Kpis For Measuring Performance Of Request Order Procedure Slides PDF
This slide illustrates the major key performing indicators which can be used by business organization to measure the performance of placing order. The key performance indicators are order placement rate, purchase frequency, payment success rate, mobile conversion rate etc. Pitch your topic with ease and precision using this Kpis For Measuring Performance Of Request Order Procedure Slides PDF. This layout presents information on Kpis, Ideal, Actual. It is also available for immediate download and adjustment. So, changes can be made in the color, design, graphics or any other component to create a unique layout.

Sales Organization Dashboard For Product Marketing Themes PDF
This slide represents the sales dashboard for product marketing illustrating metrics such as number of sales, total revenue, profit, cost, sales revenue, cost breakdown, accumulated revenue, etc. Pitch your topic with ease and precision using this sales organization dashboard for product marketing themes pdf. This layout presents information on total cost, total profit, total revenue. It is also available for immediate download and adjustment. So, changes can be made in the color, design, graphics or any other component to create a unique layout.

Performance Metrics With Key Business Objectives Guidelines PDF
The purpose of this slide is to showcase various objectives and KPIs which can be used to evaluate the business performance. The key objectives are awareness, engagement, lead generation, demand generation, customer support and advocacy. Pitch your topic with ease and precision using this Performance Metrics With Key Business Objectives Guidelines PDF. This layout presents information on Social Community Growth, Cost Per Acquisition, Customer Support. It is also available for immediate download and adjustment. So, changes can be made in the color, design, graphics or any other component to create a unique layout.

Comparative Analysis Of Web Application Performance Assessment Tools Diagrams PDF
This slide displays performance inspection tools used by businesses for web application to optimize user experience. It includes elements such as tools, prices, features, competences, platforms and comments. Pitch your topic with ease and precision using this Comparative Analysis Of Web Application Performance Assessment Tools Diagrams PDF. This layout presents information on Devices, Optimize, Metrics. It is also available for immediate download and adjustment. So, changes can be made in the color, design, graphics or any other component to create a unique layout.
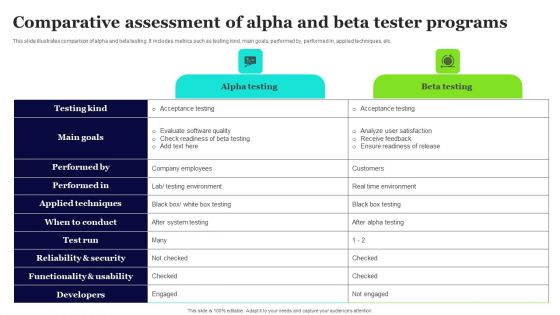
Comparative Assessment Of Alpha And Beta Tester Programs Information PDF
This slide illustrates comparison of alpha and beta testing. It includes metrics such as testing kind, main goals, performed by, performed in, applied techniques, etc. Pitch your topic with ease and precision using this Comparative Assessment Of Alpha And Beta Tester Programs Information PDF. This layout presents information on Testing Kind, Main Goals, Performed. It is also available for immediate download and adjustment. So, changes can be made in the color, design, graphics or any other component to create a unique layout.
Lead Tracking Dashboard With Metric Comparison Brochure PDF
This slide showcases dashboard of lead pipeline that can help to identify total number of leads generated and expenses incurred to acquire the audience. It also showcases other key performance metrics like lead breakdown by status and number of leads per month. Pitch your topic with ease and precision using this Lead Tracking Dashboard With Metric Comparison Brochure PDF. This layout presents information on Metric Comparison, Lead Pipeline, Lead Breakdown Status. It is also available for immediate download and adjustment. So, changes can be made in the color, design, graphics or any other component to create a unique layout.
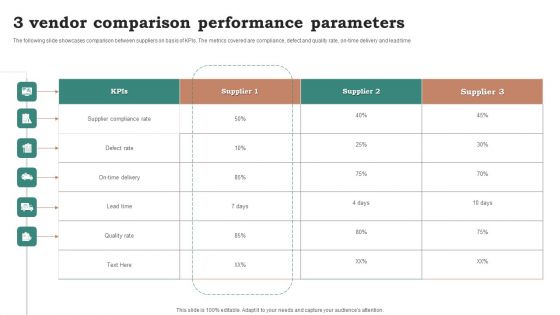
3 Vendor Comparison Performance Parameters Ppt Portfolio Topics PDF
The following slide showcases comparison between suppliers on basis of KPIs. The metrics covered are compliance, defect and quality rate, on-time delivery and lead time. Pitch your topic with ease and precision using this 3 Vendor Comparison Performance Parameters Ppt Portfolio Topics PDF. This layout presents information on Supplier Compliance Rate, Defect Rate, Lead Time. It is also available for immediate download and adjustment. So, changes can be made in the color, design, graphics or any other component to create a unique layout.
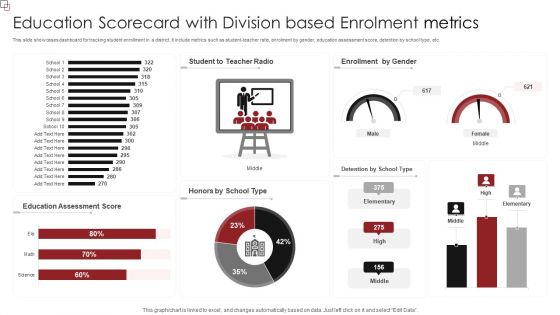
Education Scorecard With Division Based Enrolment Metrics Professional PDF
This slide showcases dashboard for tracking student enrollment in a district. It include metrics such as student-teacher ratio, enrolment by gender, education assessment score, detention by school type, etc. Pitch your topic with ease and precision using this Education Scorecard With Division Based Enrolment Metrics Professional PDF. This layout presents information on Education Assessment Score, Enrollment Gender. It is also available for immediate download and adjustment. So, changes can be made in the color, design, graphics or any other component to create a unique layout.
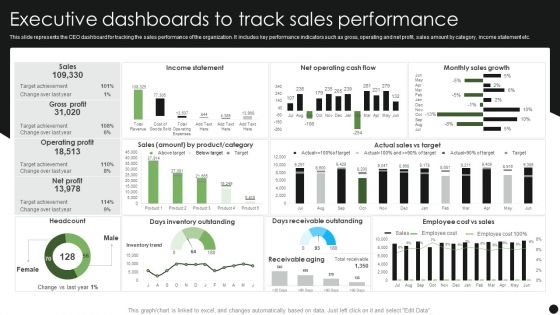
Executive Dashboards To Track Sales Performance Guidelines PDF
This slide represents the CEO dashboard for tracking the sales performance of the organization. It includes key performance indicators such as gross, operating and net profit, sales amount by category, income statement etc. Pitch your topic with ease and precision using this Executive Dashboards To Track Sales Performance Guidelines PDF. This layout presents information on Income Statement, Monthly Sales Growth, Days Receivable Outstanding. It is also available for immediate download and adjustment. So, changes can be made in the color, design, graphics or any other component to create a unique layout.
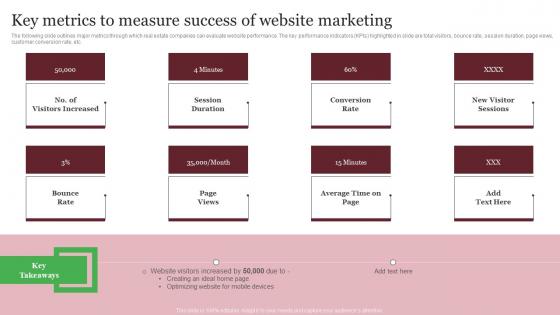
Key Metrics To Measure Success Of Website Marketing Out Of The Box Real Mockup Pdf
The following slide outlines major metrics through which real estate companies can evaluate website performance. The key performance indicators KPIs highlighted in slide are total visitors, bounce rate, session duration, page views, customer conversion rate, etc. This Key Metrics To Measure Success Of Website Marketing Out Of The Box Real Mockup Pdf from Slidegeeks makes it easy to present information on your topic with precision. It provides customization options, so you can make changes to the colors, design, graphics, or any other component to create a unique layout. It is also available for immediate download, so you can begin using it right away. Slidegeeks has done good research to ensure that you have everything you need to make your presentation stand out. Make a name out there for a brilliant performance.

 Home
Home