Change Management Kpi

Change Administration Strategies Key Kpis For Digital Transformation Designs PDF
Purpose of the following slide is to show the KPI which can be used to measure the digital transformation, these kpis can be customer experience, user metrics and application metrics. This is a Change Administration Strategies Key Kpis For Digital Transformation Designs PDF template with various stages. Focus and dispense information on five stages using this creative set, that comes with editable features. It contains large content boxes to add your information on topics like Customer Experience Metrics, Application Metrics, User Metrics. You can also showcase facts, figures, and other relevant content using this PPT layout. Grab it now.
Change Requests Tracking Metrics For Company Microsoft PDF
This slide displays dashboard to monitor change requests count assigned and completed for the organization. It includes key components such as models, owners, over time progress, etc Showcasing this set of slides titled Change Requests Tracking Metrics For Company Microsoft PDF The topics addressed in these templates are Departments, Model Owners, Requests. All the content presented in this PPT design is completely editable. Download it and make adjustments in color, background, font etc. as per your unique business setting.
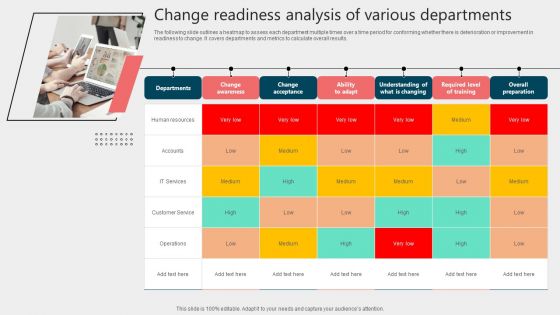
Change Readiness Analysis Of Various Departments Portrait PDF
The following slide outlines a heatmap to assess each department multiple times over a time period for conforming whether there is deterioration or improvement in readiness to change. It covers departments and metrics to calculate overall results. Persuade your audience using this Change Readiness Analysis Of Various Departments Portrait PDF. This PPT design covers one stage, thus making it a great tool to use. It also caters to a variety of topics including Change Awareness, Change Acceptance, Overall Preparation. Download this PPT design now to present a convincing pitch that not only emphasizes the topic but also showcases your presentation skills.
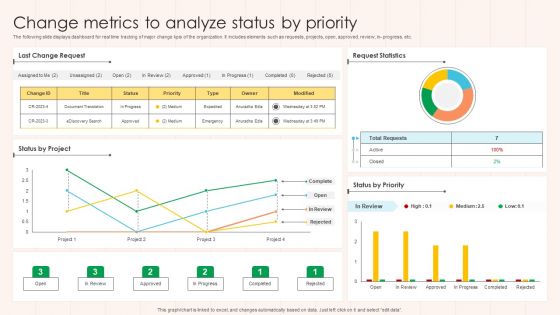
Change Metrics To Analyze Status By Priority Formats PDF
The following slide displays dashboard for real time tracking of major change kpis of the organization. It includes elements such as requests, projects, open, approved, review, in- progress, etc. Pitch your topic with ease and precision using this Change Metrics To Analyze Status By Priority Formats PDF This layout presents information on Project, Request Statistics, Priority. It is also available for immediate download and adjustment. So, changes can be made in the color, design, graphics or any other component to create a unique layout.

Change Metrics Showcasing Time Consumption Analysis By Status Clipart PDF
This slide showcases dashboard to analyze and monitor overall time consumption by various change cases in the organization. It includes elements such as escalated, solution proposed, waiting for customer approval, etc. Showcasing this set of slides titled Change Metrics Showcasing Time Consumption Analysis By Status Clipart PDF The topics addressed in these templates are Consuming, Status Analysis, Record Count. All the content presented in this PPT design is completely editable. Download it and make adjustments in color, background, font etc. as per your unique business setting.
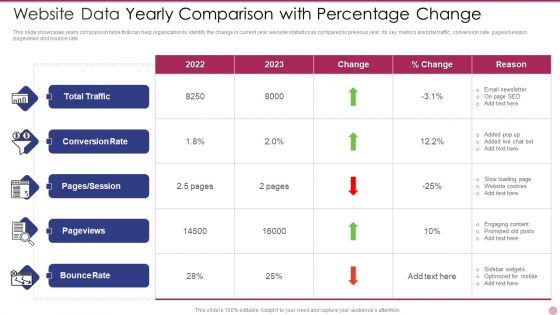
Website Data Yearly Comparison With Percentage Change Formats PDF
This slide showcases yearly comparison table that can help organization to identify the change in current year website statistics as compared to previous year. Its key metrics are total traffic, conversion rate, pages or session, pageviews and bounce rate. Pitch your topic with ease and precision using this Website Data Yearly Comparison With Percentage Change Formats PDF. This layout presents information on Website Data Yearly Comparison With Percentage Change. It is also available for immediate download and adjustment. So, changes can be made in the color, design, graphics or any other component to create a unique layout.

Inventory Management Kpi Marketing Strategy Research Stress Management Ppt PowerPoint Presentation Infographic Template Infographics
This is a inventory management kpi marketing strategy research stress management ppt powerpoint presentation infographic template infographics. This is a four stage process. The stages in this process are inventory management, human development class, risk assessment survey.

Sales Department Management To Enhance Performance Monthly Activities Management KPI Dashboard Brochure PDF
This slide represents the dashboard for sales managers to easily check in the progress towards the achievement of sales objectives and targets. It includes KPIs for sales team monthly and daily activities such as outreach, emails sent per day, calls, conversion, revenue per day etc.Pitch your topic with ease and precision using this Sales Department Management To Enhance Performance Monthly Activities Management KPI Dashboard Brochure PDF. This layout presents information on Social Impression, Conversions Past, Outreach Past. It is also available for immediate download and adjustment. So, changes can be made in the color, design, graphics or any other component to create a unique layout.
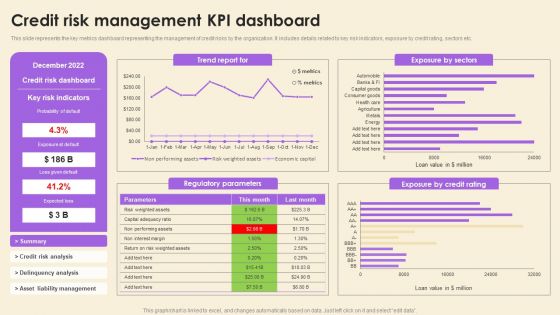
Operational Risk Assessment And Management Plan Credit Risk Management KPI Dashboard Guidelines PDF
This slide represents the key metrics dashboard representing the management of credit risks by the organization. It includes details related to key risk indicators, exposure by credit rating, sectors etc. Present like a pro with Operational Risk Assessment And Management Plan Credit Risk Management KPI Dashboard Guidelines PDF Create beautiful presentations together with your team, using our easy-to-use presentation slides. Share your ideas in real-time and make changes on the fly by downloading our templates. So whether you are in the office, on the go, or in a remote location, you can stay in sync with your team and present your ideas with confidence. With Slidegeeks presentation got a whole lot easier. Grab these presentations today.

Strategic Risk Management Plan Credit Risk Management KPI Dashboard Information PDF
This slide represents the key metrics dashboard representing the management of credit risks by the organization. It includes details related to key risk indicators, exposure by credit rating, sectors etc.Coming up with a presentation necessitates that the majority of the effort goes into the content and the message you intend to convey. The visuals of a PowerPoint presentation can only be effective if it supplements and supports the story that is being told. Keeping this in mind our experts created Strategic Risk Management Plan Credit Risk Management KPI Dashboard Information PDF to reduce the time that goes into designing the presentation. This way, you can concentrate on the message while our designers take care of providing you with the right template for the situation.

ITIL Incident Regulation Kpi Dashboard Background PDF
This slide covers ITIL problem management KPI dashboard to track status of problems. It involves KPI such as total number of incidents, problems, requests, average time to solve incidents.Pitch your topic with ease and precision using this ITIL Incident Regulation Kpi Dashboard Background PDF. This layout presents information on Active Problems, Average Incidents, Opened Problems. It is also available for immediate download and adjustment. So, changes can be made in the color, design, graphics or any other component to create a unique layout.
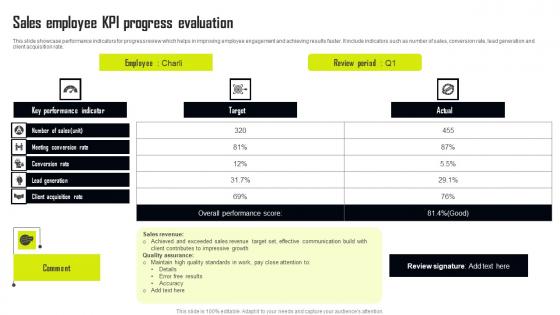
Sales Employee Kpi Progress Evaluation Ideas Pdf
This slide showcase performance indicators for progress review which helps in improving employee engagement and achieving results faster. It include indicators such as number of sales, conversion rate, lead generation and client acquisition rate. Pitch your topic with ease and precision using this Sales Employee Kpi Progress Evaluation Ideas Pdf This layout presents information on Meeting Conversion Rate, Conversion Rate, Lead Generation It is also available for immediate download and adjustment. So, changes can be made in the color, design, graphics or any other component to create a unique layout.
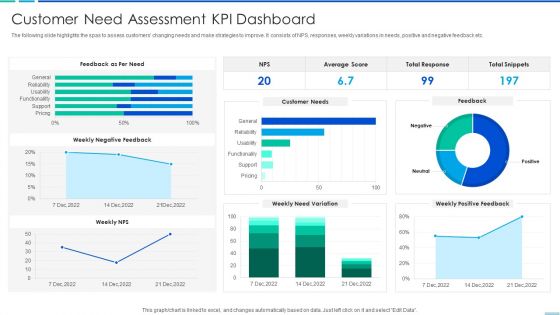
Customer Need Assessment Kpi Dashboard Infographics PDF
The following slide highlights the spas to assess customers changing needs and make strategies to improve. It consists of NPS, responses, weekly variations in needs, positive and negative feedback etc. Showcasing this set of slides titled customer need assessment kpi dashboard infographics pdf. The topics addressed in these templates are customer need assessment kpi dashboard. All the content presented in this PPT design is completely editable. Download it and make adjustments in color, background, font etc. as per your unique business setting.

Employee Recruitment Analysis KPI Dashboard Slides PDF
The following slide presents a hiring assessment dashboard to manage HR metrics. It includes KPIs such as average time taken, cost required in hiring process along with the major sources of recruitment etc. Pitch your topic with ease and precision using this Employee Recruitment Analysis KPI Dashboard Slides PDF. This layout presents information on Agile Hiring, Non Agile Hiring, Hiring Cost Assessment. It is also available for immediate download and adjustment. So, changes can be made in the color, design, graphics or any other component to create a unique layout.
Project Error Tracking KPI Dashboard Themes PDF
This slide illustrates the dashboard for the project issue tracking and management. It includes the column chart for issues assignee, incomplete issues by priority and project, monthly percentage increase in issues created and closed, etc. Pitch your topic with ease and precision using this Project Error Tracking KPI Dashboard Themes PDF. This layout presents information on Issues Assignee, Issue Status, Incomplete Issues. It is also available for immediate download and adjustment. So, changes can be made in the color, design, graphics or any other component to create a unique layout.
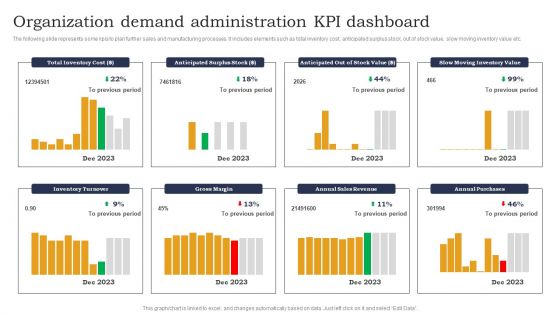
Organization Demand Administration KPI Dashboard Designs PDF
The following slide represents some kpis to plan further sales and manufacturing processes. It includes elements such as total inventory cost, anticipated surplus stock, out of stock value, slow moving inventory value etc. Pitch your topic with ease and precision using this Organization Demand Administration KPI Dashboard Designs PDF. This layout presents information on Anticipated Surplus Stock, Out Of Stock, Slow Moving Inventory. It is also available for immediate download and adjustment. So, changes can be made in the color, design, graphics or any other component to create a unique layout.
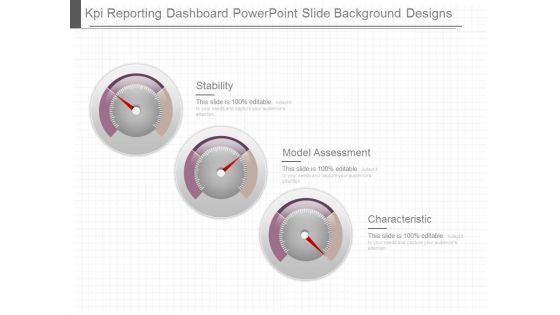
Kpi Reporting Dashboard Powerpoint Slide Background Designs
This is a kpi reporting dashboard powerpoint slide background designs. This is a three stage process. The stages in this process are stability, model assessment, characteristic.
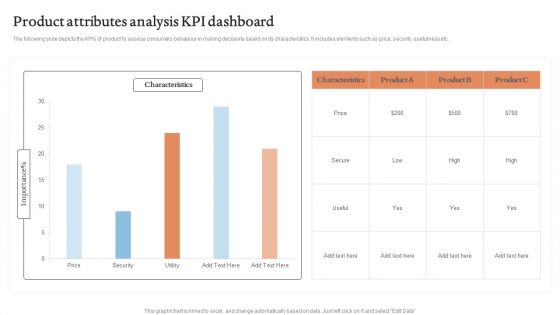
Product Attributes Analysis KPI Dashboard Graphics PDF
The following slide depicts the KPIs of product to assess consumers behaviour in making decisions based on its characteristics. It includes elements such as price, security, usefulness etc.Showcasing this set of slides titled Product Attributes Analysis KPI Dashboard Graphics PDF. The topics addressed in these templates are Characteristics, Product Attributes, Analysis KPI Dashboard. All the content presented in this PPT design is completely editable. Download it and make adjustments in color, background, font etc. as per your unique business setting.
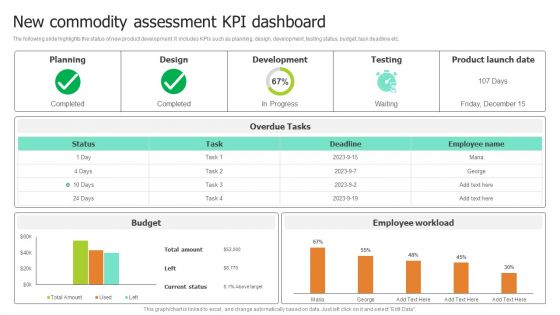
New Commodity Assessment Kpi Dashboard Pictures PDF
The following slide highlights the status of new product development. It includes KPIs such as planning, design, development, testing status, budget, task deadline etc.Showcasing this set of slides titled New Commodity Assessment Kpi Dashboard Pictures PDF. The topics addressed in these templates are Development, Product Launch Date, Overdue Tasks. All the content presented in this PPT design is completely editable. Download it and make adjustments in color, background, font etc. as per your unique business setting.

Guide For Managers To Effectively Handle Products Product Management KPI Marketing Metrics Information PDF
Presenting this set of slides with name guide for managers to effectively handle products product management kpi marketing metrics information pdf. The topics discussed in these slides are revenue generated, leads, target, purchases, traffic sources, visitors, new customers, cost per interaction, leads channel. This is a completely editable PowerPoint presentation and is available for immediate download. Download now and impress your audience.
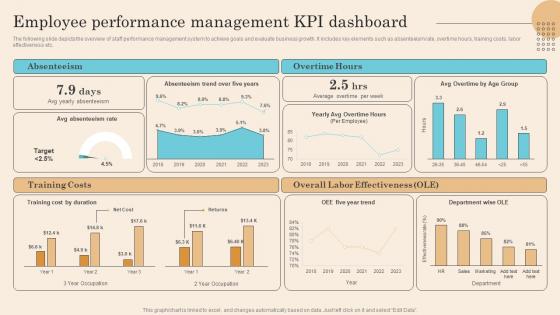
Employee Performance Management Kpi Dashboard Executing Successful Staff Performance Elements Pdf
The following slide depicts the overview of staff performance management system to achieve goals and evaluate business growth. It includes key elements such as absenteeism rate, overtime hours, training costs, labor effectiveness etc. Find highly impressive Employee Performance Management Kpi Dashboard Executing Successful Staff Performance Elements Pdf on Slidegeeks to deliver a meaningful presentation. You can save an ample amount of time using these presentation templates. No need to worry to prepare everything from scratch because Slidegeeks experts have already done a huge research and work for you. You need to download Employee Performance Management Kpi Dashboard Executing Successful Staff Performance Elements Pdf for your upcoming presentation. All the presentation templates are 100 percent editable and you can change the color and personalize the content accordingly. Download now.

Firm Management KPI Dashboard With Marketing Program Report Ppt Styles Introduction PDF
This graph or chart is linked to excel, and changes automatically based on data. Just left click on it and select Edit Data. Showcasing this set of slides titled Firm Management KPI Dashboard With Marketing Program Report Ppt Styles Introduction PDF. The topics addressed in these templates are Google Rankings, Google Change, Warnings, Visitors. All the content presented in this PPT design is completely editable. Download it and make adjustments in color, background, font etc. as per your unique business setting.
KPI Dashboard For Tracking Hospitality And Tourism Management Plan Performance Infographics PDF
This slide shows the KPI dashboard for monitoring the performance of strategy implemented. It covers KPIs such as bookings, location, housekeeping, etc. Pitch your topic with ease and precision using this KPI Dashboard For Tracking Hospitality And Tourism Management Plan Performance Infographics PDF. This layout presents information on Booking Type, Housekeeping, Check In Guest. It is also available for immediate download and adjustment. So, changes can be made in the color, design, graphics or any other component to create a unique layout.
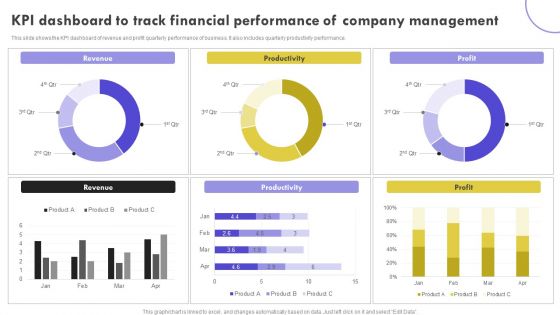
KPI Dashboard To Track Financial Performance Of Company Management Clipart PDF
This slide shows the KPI dashboard of revenue and profit quarterly performance of business. It also includes quarterly productivity performance. Pitch your topic with ease and precision using this KPI Dashboard To Track Financial Performance Of Company Management Clipart PDF. This layout presents information on Revenue, Productivity, Profit. It is also available for immediate download and adjustment. So, changes can be made in the color, design, graphics or any other component to create a unique layout.
KPI Framework For Quality Assurance Management Ppt PowerPoint Presentation File Icons PDF
This slide illustrates multiple key performance indicator framework for quality assurance management such as customer complaints, scrap rate, defects and yield. Quality assurance department plays a critical role in maintaining the superior quality of products. Pitch your topic with ease and precision using this kpi framework for quality assurance management ppt powerpoint presentation file icons pdf This layout presents information on kpi framework for quality assurance management . It is also available for immediate download and adjustment. So, changes can be made in the color, design, graphics or any other component to create a unique layout.
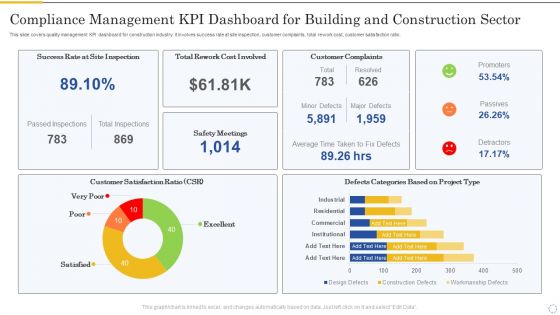
Compliance Management Kpi Dashboard For Building And Construction Sector Inspiration PDF
This slide covers quality management KPI dashboard for construction industry. It involves success rate at site inspection, customer complaints, total rework cost, customer satisfaction ratio. Pitch your topic with ease and precision using this Compliance Management Kpi Dashboard For Building And Construction Sector Inspiration PDF. This layout presents information on Customer Complaints, Customer Satisfaction, Safety Meetings. It is also available for immediate download and adjustment. So, changes can be made in the color, design, graphics or any other component to create a unique layout.
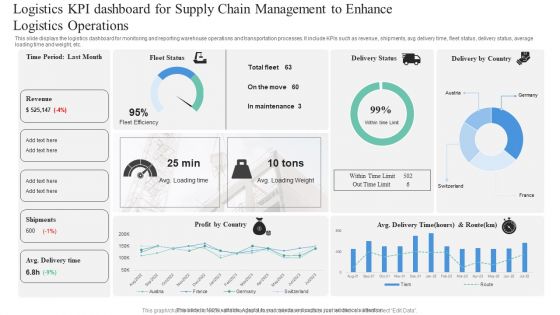
Logistics KPI Dashboard For Supply Chain Management To Enhance Logistics Operations Professional PDF
This slide displays the logistics dashboard for monitoring and reporting warehouse operations and transportation processes. It include KPIs such as revenue, shipments, avg delivery time, fleet status, delivery status, average loading time and weight, etc. Pitch your topic with ease and precision using this Logistics KPI Dashboard For Supply Chain Management To Enhance Logistics Operations Professional PDF. This layout presents information on Logistics KPI, Dashboard For Supply Chain, Management To Enhance, Logistics Operations. It is also available for immediate download and adjustment. So, changes can be made in the color, design, graphics or any other component to create a unique layout.

ESO System Incident Management KPI Dashboard Ppt PowerPoint Presentation File Graphic Images PDF
This slide covers enterprise security operation incident management kpi dashboard. It involves details such as average resolution time, new incidents, incident status and new incidents by category. Pitch your topic with ease and precision using this ESO System Incident Management KPI Dashboard Ppt PowerPoint Presentation File Graphic Images PDF. This layout presents information on Average Resolution Time, Incident Status, New Incidents. It is also available for immediate download and adjustment. So, changes can be made in the color, design, graphics or any other component to create a unique layout.

KPI Dashboard To Track Supply Chain Management Solutions Performance Background PDF
Mentioned slide outlines key performance indicator KPI dashboard which can be used by an organization to measure the performance of supply chain solutions. The major metrics covered in the template are units per transaction, stock turnover, out of stock percentage, etc. Pitch your topic with ease and precision using this KPI Dashboard To Track Supply Chain Management Solutions Performance Background PDF. This layout presents information on Per Transaction, Compared Last, Stock Turnover. It is also available for immediate download and adjustment. So, changes can be made in the color, design, graphics or any other component to create a unique layout.
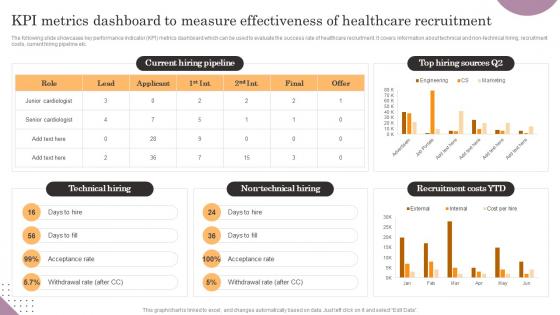
KPI Metrics Dashboard To Measure Effectiveness Of General Management Information Pdf
The following slide showcases key performance indicator KPI metrics dashboard which can be used to evaluate the success rate of healthcare recruitment. It covers information about technical and non-technical hiring, recruitment costs, current hiring pipeline etc. Presenting this PowerPoint presentation, titled KPI Metrics Dashboard To Measure Effectiveness Of General Management Information Pdf, with topics curated by our researchers after extensive research. This editable presentation is available for immediate download and provides attractive features when used. Download now and captivate your audience. Presenting this KPI Metrics Dashboard To Measure Effectiveness Of General Management Information Pdf. Our researchers have carefully researched and created these slides with all aspects taken into consideration. This is a completely customizable KPI Metrics Dashboard To Measure Effectiveness Of General Management Information Pdf that is available for immediate downloading. Download now and make an impact on your audience. Highlight the attractive features available with our PPTs.

KPI Framework For Human Resource Management Ppt PowerPoint Presentation Gallery Portrait PDF
This slide outlines different key performance indicator framework for human resource management such as average cost per hire, absenteeism rate, employee satisfaction index and employee turnover rate. It also provides information about the comparison between target and actual performance of each kips. Pitch your topic with ease and precision using this kpi framework for human resource management ppt powerpoint presentation gallery portrait pdf This layout presents information on average, cost, target It is also available for immediate download and adjustment. So, changes can be made in the color, design, graphics or any other component to create a unique layout.
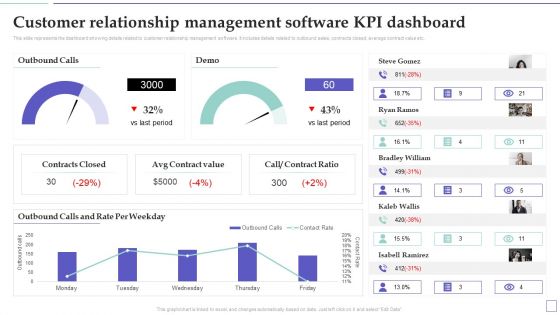
System Deployment Project Customer Relationship Management Software Kpi Dashboard Rules PDF
This slide represents the dashboard showing details related to customer relationship management software. It includes details related to outbound sales, contracts closed, average contract value etc. Present like a pro with System Deployment Project Customer Relationship Management Software Kpi Dashboard Rules PDF Create beautiful presentations together with your team, using our easy-to-use presentation slides. Share your ideas in real-time and make changes on the fly by downloading our templates. So whether youre in the office, on the go, or in a remote location, you can stay in sync with your team and present your ideas with confidence. With Slidegeeks presentation got a whole lot easier. Grab these presentations today.

Strategic Plan For Enterprise Customer Relationship Management Software KPI Dashboard Infographics PDF
This slide represents the dashboard showing details related to customer relationship management software. It includes details related to outbound sales, contracts closed, average contract value etc. Present like a pro with Strategic Plan For Enterprise Customer Relationship Management Software KPI Dashboard Infographics PDF Create beautiful presentations together with your team, using our easy-to-use presentation slides. Share your ideas in real-time and make changes on the fly by downloading our templates. So whether youre in the office, on the go, or in a remote location, you can stay in sync with your team and present your ideas with confidence. With Slidegeeks presentation got a whole lot easier. Grab these presentations today.

Dashboard For Logistics KPI Management System Of Logistics Company Infographics PDF
The following slide highlights the dashboard for transportation management system of logistics company illustrating shipment status of 30 days, shipment by carrier, on time shipment, average shipment cost, carrier efficiency and shipment count. Pitch your topic with ease and precision using this Dashboard For Logistics KPI Management System Of Logistics Company Infographics PDF. This layout presents information on Shipment Status, Shipment By Carrier, On Time Shipment. It is also available for immediate download and adjustment. So, changes can be made in the color, design, graphics or any other component to create a unique layout.
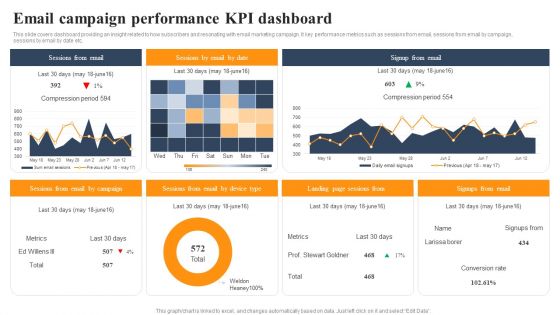
Implementing An Effective Ecommerce Management Framework Email Campaign Performance KPI Dashboard Introduction PDF
This slide covers dashboard providing an insight related to how subscribers and resonating with email marketing campaign. It key performance metrics such as sessions from email, sessions from email by campaign, sessions by email by date etc. If your project calls for a presentation, then Slidegeeks is your go-to partner because we have professionally designed, easy-to-edit templates that are perfect for any presentation. After downloading, you can easily edit Implementing An Effective Ecommerce Management Framework Email Campaign Performance KPI Dashboard Introduction PDF and make the changes accordingly. You can rearrange slides or fill them with different images. Check out all the handy templates

Talent Management Optimization With Workforce Staffing Kpi Dashboard To Measure Talent Performance Sample PDF
This slide represents dashboard to measure talent performance in organization. It includes talent applicant status, team training methods, talented candidate status, risk for loss of potential talent pool etc. If your project calls for a presentation, then Slidegeeks is your go to partner because we have professionally designed, easy to edit templates that are perfect for any presentation. After downloading, you can easily edit Talent Management Optimization With Workforce Staffing Kpi Dashboard To Measure Talent Performance Sample PDF and make the changes accordingly. You can rearrange slides or fill them with different images. Check out all the handy templates.
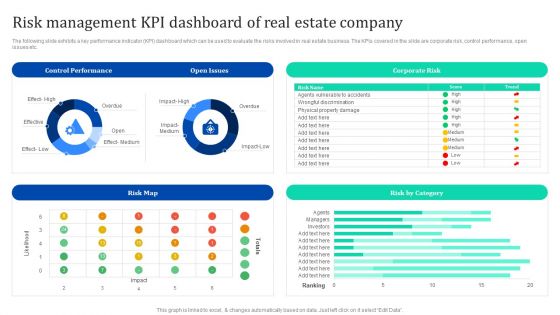
Risk Management Kpi Dashboard Of Real Estate Company Enhancing Process Improvement By Regularly Inspiration PDF
The following slide exhibits a key performance indicator KPI dashboard which can be used to evaluate the risks involved in real estate business. The KPIs covered in the slide are corporate risk, control performance, open issues etc. This Risk Management Kpi Dashboard Of Real Estate Company Enhancing Process Improvement By Regularly Inspiration PDF from Slidegeeks makes it easy to present information on your topic with precision. It provides customization options, so you can make changes to the colors, design, graphics, or any other component to create a unique layout. It is also available for immediate download, so you can begin using it right away. Slidegeeks has done good research to ensure that you have everything you need to make your presentation stand out. Make a name out there for a brilliant performance.
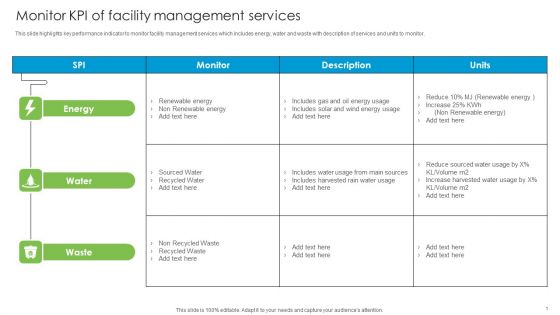
Monitor Kpi Of Facility Management Services Developing Tactical Fm Services Rules PDF
This slide highlights key performance indicator to monitor facility management services which includes energy, water and waste with description of services and units to monitor.This Monitor Kpi Of Facility Management Services Developing Tactical Fm Services Rules PDF from Slidegeeks makes it easy to present information on your topic with precision. It provides customization options, so you can make changes to the colors, design, graphics, or any other component to create a unique layout. It is also available for immediate download, so you can begin using it right away. Slidegeeks has done good research to ensure that you have everything you need to make your presentation stand out. Make a name out there for a brilliant performance.

Customer Checkout Behavior Kpi Dashboard Deploying Ecommerce Order Management Software Demonstration PDF
This slide represents the dashboard to help management in analyzing the point at which customers leave the checkout process. It includes details related to KPIs such as shipping drop-off, payment drop-off etc.Present like a pro with Customer Checkout Behavior Kpi Dashboard Deploying Ecommerce Order Management Software Demonstration PDF Create beautiful presentations together with your team, using our easy-to-use presentation slides. Share your ideas in real-time and make changes on the fly by downloading our templates. So whether you are in the office, on the go, or in a remote location, you can stay in sync with your team and present your ideas with confidence. With Slidegeeks presentation got a whole lot easier. Grab these presentations today.
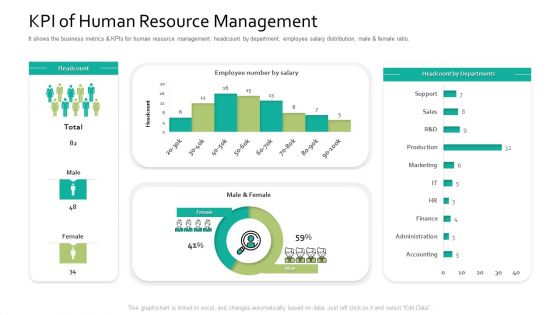
Kpi Of Human Resource Management Human Resource Information System For Organizational Effectiveness Mockup PDF
Deliver an awe inspiring pitch with this creative kpi of human resource management human resource information system for organizational effectiveness mockup pdf bundle. Topics like kpi of human resource management can be discussed with this completely editable template. It is available for immediate download depending on the needs and requirements of the user.
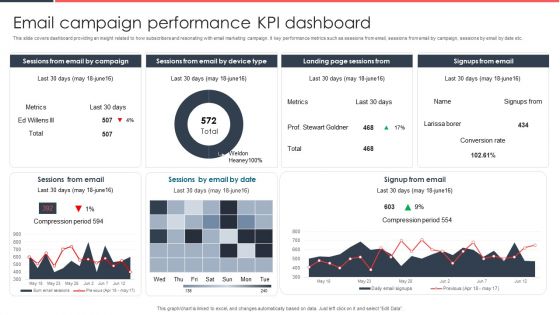
Implementing Management System To Enhance Ecommerce Processes Email Campaign Performance KPI Dashboard Download PDF
This slide covers dashboard providing an insight related to how subscribers and resonating with email marketing campaign. It key performance metrics such as sessions from email, sessions from email by campaign, sessions by email by date etc. This Implementing Management System To Enhance Ecommerce Processes Email Campaign Performance KPI Dashboard Download PDF from Slidegeeks makes it easy to present information on your topic with precision. It provides customization options, so you can make changes to the colors, design, graphics, or any other component to create a unique layout. It is also available for immediate download, so you can begin using it right away. Slidegeeks has done good research to ensure that you have everything you need to make your presentation stand out. Make a name out there for a brilliant performance.

Medical Risk Management Framework With Kpi Ppt PowerPoint Presentation File Infographics PDF
Presenting medical risk management framework with kpi ppt powerpoint presentation file infographics pdf to dispense important information. This template comprises two stages. It also presents valuable insights into the topics including risk assessment, planning , incident management, patient management. This is a completely customizable PowerPoint theme that can be put to use immediately. So, download it and address the topic impactfully.
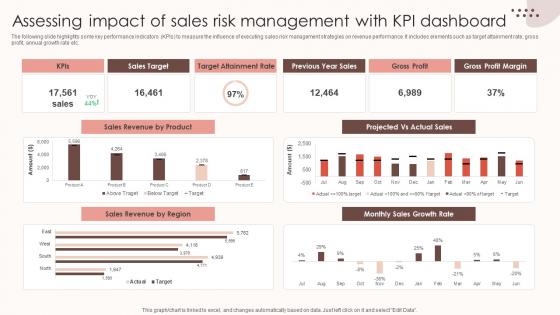
Assessing Sales Risks Assessing Impact Of Sales Risk Management With Kpi Dashboard Topics PDF
The following slide highlights some key performance indicators KPIs to measure the influence of executing sales risk management strategies on revenue performance. It includes elements such as target attainment rate, gross profit, annual growth rate etc. Create an editable Assessing Sales Risks Assessing Impact Of Sales Risk Management With Kpi Dashboard Topics PDF that communicates your idea and engages your audience. Whether you are presenting a business or an educational presentation, pre-designed presentation templates help save time. Assessing Sales Risks Assessing Impact Of Sales Risk Management With Kpi Dashboard Topics PDF is highly customizable and very easy to edit, covering many different styles from creative to business presentations. Slidegeeks has creative team members who have crafted amazing templates. So, go and get them without any delay.
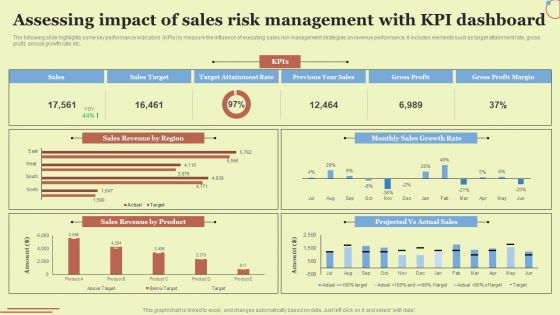
Assessing Impact Of Sales Risk Management With KPI Dashboard Ideas PDF
The following slide highlights some key performance indicators KPIs to measure the influence of executing sales risk management strategies on revenue performance. It includes elements such as target attainment rate, gross profit, annual growth rate etc. Presenting this PowerPoint presentation, titled Assessing Impact Of Sales Risk Management With KPI Dashboard Ideas PDF, with topics curated by our researchers after extensive research. This editable presentation is available for immediate download and provides attractive features when used. Download now and captivate your audience. Presenting this Assessing Impact Of Sales Risk Management With KPI Dashboard Ideas PDF. Our researchers have carefully researched and created these slides with all aspects taken into consideration. This is a completely customizable Assessing Impact Of Sales Risk Management With KPI Dashboard Ideas PDF that is available for immediate downloading. Download now and make an impact on your audience. Highlight the attractive features available with our PPTs.
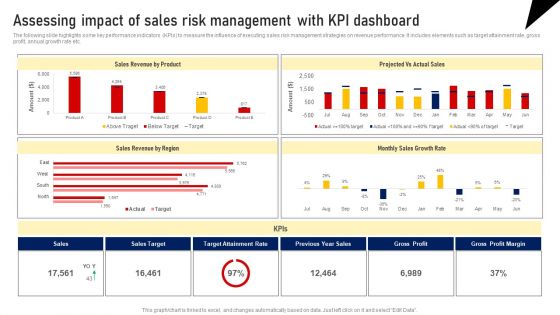
Assessing Impact Of Sales Risk Management With Kpi Dashboard Formats PDF
The following slide highlights some key performance indicators KPIs to measure the influence of executing sales risk management strategies on revenue performance. It includes elements such as target attainment rate, gross profit, annual growth rate etc. Presenting this PowerPoint presentation, titled Assessing Impact Of Sales Risk Management With Kpi Dashboard Formats PDF, with topics curated by our researchers after extensive research. This editable presentation is available for immediate download and provides attractive features when used. Download now and captivate your audience. Presenting this Assessing Impact Of Sales Risk Management With Kpi Dashboard Formats PDF. Our researchers have carefully researched and created these slides with all aspects taken into consideration. This is a completely customizable Assessing Impact Of Sales Risk Management With Kpi Dashboard Formats PDF that is available for immediate downloading. Download now and make an impact on your audience. Highlight the attractive features available with our PPTs.
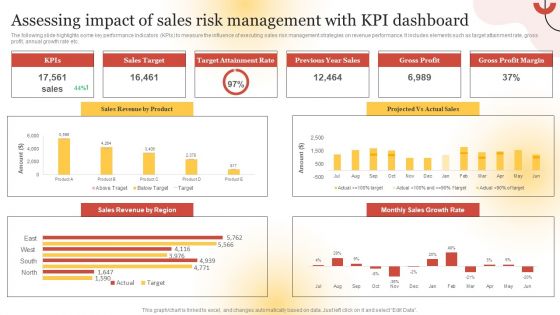
Assessing Impact Of Sales Risk Management With KPI Dashboard Guidelines PDF
The following slide highlights some key performance indicators KPIs to measure the influence of executing sales risk management strategies on revenue performance. It includes elements such as target attainment rate, gross profit, annual growth rate etc. Presenting this PowerPoint presentation, titled Assessing Impact Of Sales Risk Management With KPI Dashboard Guidelines PDF, with topics curated by our researchers after extensive research. This editable presentation is available for immediate download and provides attractive features when used. Download now and captivate your audience. Presenting this Assessing Impact Of Sales Risk Management With KPI Dashboard Guidelines PDF. Our researchers have carefully researched and created these slides with all aspects taken into consideration. This is a completely customizable Assessing Impact Of Sales Risk Management With KPI Dashboard Guidelines PDF that is available for immediate downloading. Download now and make an impact on your audience. Highlight the attractive features available with our PPTs.

Competitor Assessment In Product Development Product Management KPI Sales Metrics Rules PDF
Deliver an awe-inspiring pitch with this creative competitor assessment in product development product management kpi sales metrics rules pdf. bundle. Topics like sales performance, salesforce sales can be discussed with this completely editable template. It is available for immediate download depending on the needs and requirements of the user.
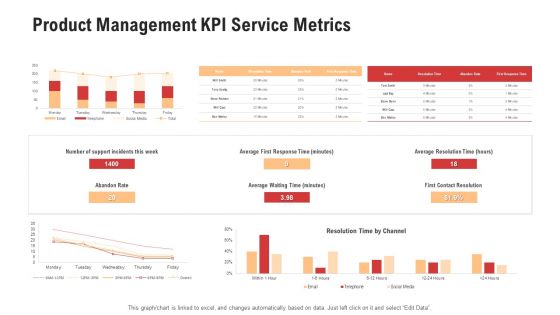
Competitor Assessment In Product Development Product Management KPI Service Metrics Topics PDF
Deliver an awe-inspiring pitch with this creative competitor assessment in product development product management kpi service metrics topics pdf. bundle. Topics like number of support incidents this week, average first response time, average waiting time, average resolution time can be discussed with this completely editable template. It is available for immediate download depending on the needs and requirements of the user.

Competitor Assessment In Product Development Product Management KPI Dashboard Background PDF
Deliver an awe-inspiring pitch with this creative competitor assessment in product development product management kpi dashboard background pdf. bundle. Topics like industry growth trend, product preference, market, key market drivers can be discussed with this completely editable template. It is available for immediate download depending on the needs and requirements of the user.
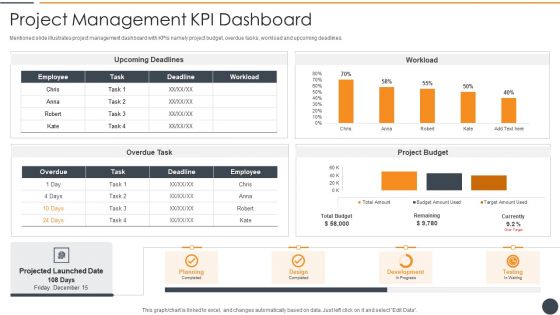
Effective Initiation Of Information Technology Project Project Management Kpi Dashboard Summary PDF
Mentioned slide illustrates project management dashboard with KPIs namely project budget, overdue tasks, workload and upcoming deadlines. Deliver an awe inspiring pitch with this creative effective initiation of information technology project project management kpi dashboard summary pdf bundle. Topics like upcoming deadlines, workload, project budget, overdue task can be discussed with this completely editable template. It is available for immediate download depending on the needs and requirements of the user.

Company Risk Assessment Plan Credit Risk Management KPI Dashboard Rules PDF
This slide covers the dashboard representing key performance indicators related to management of credit risks. It includes details related to regulatory parameters, exposure by credit rating etc. Do you have an important presentation coming up. Are you looking for something that will make your presentation stand out from the rest. Look no further than Company Risk Assessment Plan Credit Risk Management KPI Dashboard Rules PDF. With our professional designs, you can trust that your presentation will pop and make delivering it a smooth process. And with Slidegeeks, you can trust that your presentation will be unique and memorable. So why wait. GrabCompany Risk Assessment Plan Credit Risk Management KPI Dashboard Rules PDF today and make your presentation stand out from the rest.

Workforce Appraisal Status Monitoring Kpi Dashboard Employee Performance Management Rules PDF
The following slide covers the management by objective MBO methodology to assess employee performance. It includes key elements such as details, advantages, disadvantages, best fit for etc. along with process workflow.Get a simple yet stunning designed Workforce Appraisal Status Monitoring Kpi Dashboard Employee Performance Management Rules PDF. It is the best one to establish the tone in your meetings. It is an excellent way to make your presentations highly effective. So, download this PPT today from Slidegeeks and see the positive impacts. Our easy-to-edit Workforce Appraisal Status Monitoring Kpi Dashboard Employee Performance Management Rules PDF can be your go-to option for all upcoming conferences and meetings. So, what are you waiting for Grab this template today.
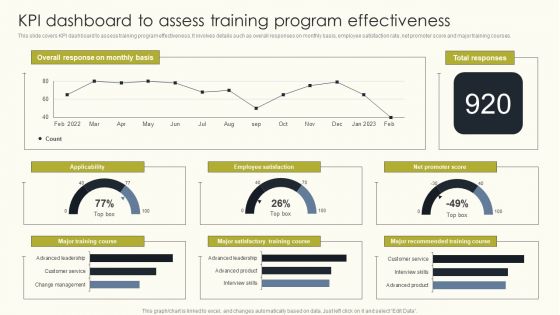
Employee Performance Management To Enhance Organizational Growth KPI Dashboard To Assess Training Diagrams PDF
The best PPT templates are a great way to save time, energy, and resources. Slidegeeks have 100 percent editable powerpoint slides making them incredibly versatile. With these quality presentation templates, you can create a captivating and memorable presentation by combining visually appealing slides and effectively communicating your message. Download Employee Performance Management To Enhance Organizational Growth KPI Dashboard To Assess Training Diagrams PDF from Slidegeeks and deliver a wonderful presentation.
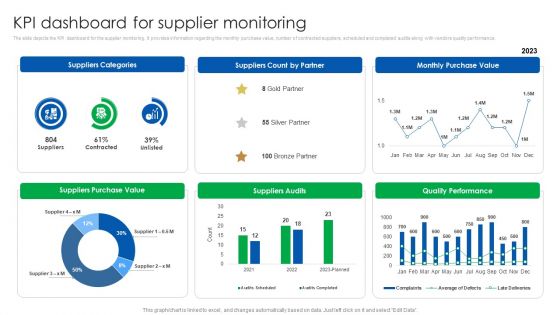
Vendor Relationship Management Strategic Plan KPI Dashboard For Supplier Monitoring Infographics PDF
The slide depicts the KPI dashboard for the supplier monitoring. It provides information regarding the monthly purchase value, number of contracted suppliers, scheduled and completed audits along with vendors quality performance. Coming up with a presentation necessitates that the majority of the effort goes into the content and the message you intend to convey. The visuals of a PowerPoint presentation can only be effective if it supplements and supports the story that is being told. Keeping this in mind our experts created Vendor Relationship Management Strategic Plan KPI Dashboard For Supplier Monitoring Infographics PDF to reduce the time that goes into designing the presentation. This way, you can concentrate on the message while our designers take care of providing you with the right template for the situation.

Assessing Impact Of Sales Risk Management With KPI Dashboard Ppt Professional Graphics Pictures PDF
The following slide highlights some key performance indicators KPIs to measure the influence of executing sales risk management strategies on revenue performance. It includes elements such as target attainment rate, gross profit, annual growth rate etc. Are you in need of a template that can accommodate all of your creative concepts This one is crafted professionally and can be altered to fit any style. Use it with Google Slides or PowerPoint. Include striking photographs, symbols, depictions, and other visuals. Fill, move around, or remove text boxes as desired. Test out color palettes and font mixtures. Edit and save your work, or work with colleagues. Download Assessing Impact Of Sales Risk Management With KPI Dashboard Ppt Professional Graphics Pictures PDF and observe how to make your presentation outstanding. Give an impeccable presentation to your group and make your presentation unforgettable.
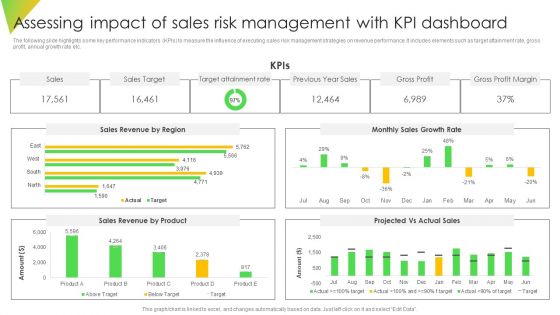
Assessing Impact Of Sales Risk Management With Kpi Dashboard Diagrams PDF
The following slide highlights some key performance indicators KPIs to measure the influence of executing sales risk management strategies on revenue performance. It includes elements such as target attainment rate, gross profit, annual growth rate etc. Boost your pitch with our creative Assessing Impact Of Sales Risk Management With Kpi Dashboard Diagrams PDF. Deliver an awe inspiring pitch that will mesmerize everyone. Using these presentation templates you will surely catch everyones attention. You can browse the ppts collection on our website. We have researchers who are experts at creating the right content for the templates. So you do not have to invest time in any additional work. Just grab the template now and use them.
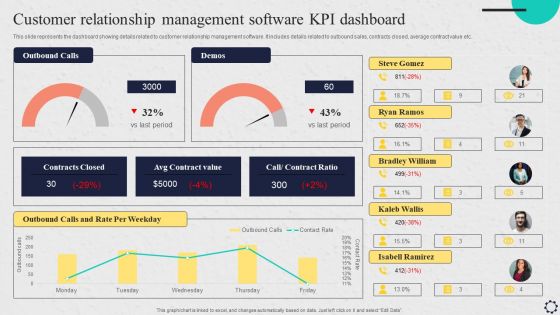
Software Implementation Strategy Customer Relationship Management Software Kpi Dashboard Clipart PDF
This slide represents the dashboard showing details related to customer relationship management software. It includes details related to outbound sales, contracts closed, average contract value etc. Are you in need of a template that can accommodate all of your creative concepts This one is crafted professionally and can be altered to fit any style. Use it with Google Slides or PowerPoint. Include striking photographs, symbols, depictions, and other visuals. Fill, move around, or remove text boxes as desired. Test out color palettes and font mixtures. Edit and save your work, or work with colleagues. Download Software Implementation Strategy Customer Relationship Management Software Kpi Dashboard Clipart PDF and observe how to make your presentation outstanding. Give an impeccable presentation to your group and make your presentation unforgettable.
Development And Operations KPI Dashboard IT Devops Performance KPI Dashboard Icons PDF
This template covers DevOps assessment key performance indicators such as activity by application, storefront users, revenue by hours etc. Deliver an awe inspiring pitch with this creative development and operations kpi dashboard it devops performance kpi dashboard icons pdf bundle. Topics like revenue, service can be discussed with this completely editable template. It is available for immediate download depending on the needs and requirements of the user.
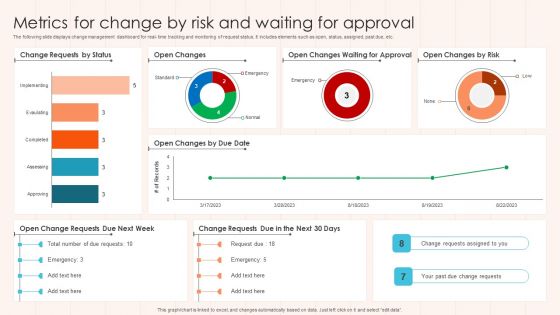
Metrics For Change By Risk And Waiting For Approval Diagrams PDF
The following slide displays change management dashboard for real- time tracking and monitoring of request status. It includes elements such as open, status, assigned, past due, etc. Pitch your topic with ease and precision using this Metrics For Change By Risk And Waiting For Approval Diagrams PDF This layout presents information on Approval, Risk, Status. It is also available for immediate download and adjustment. So, changes can be made in the color, design, graphics or any other component to create a unique layout.
Metrics For Change Tracking By Status And Alert Level Microsoft PDF
This slide displays dashboard for better understanding of change configuration management in the organization. It includes tickets by tech group, request type, activity, etc. Showcasing this set of slides titled Metrics For Change Tracking By Status And Alert Level Microsoft PDF The topics addressed in these templates are Tickets Activity, Status, Alert Level. All the content presented in this PPT design is completely editable. Download it and make adjustments in color, background, font etc. as per your unique business setting.

 Home
Home