Change Management Kpi
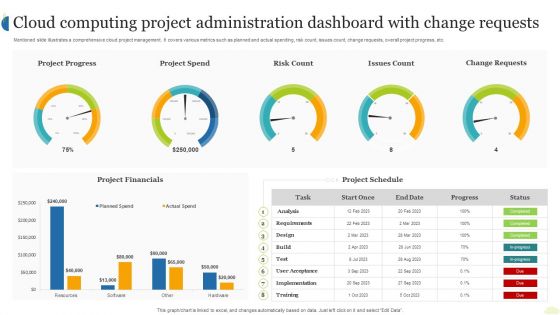
Cloud Computing Project Administration Dashboard With Change Requests Ppt Layouts Background Images PDF
Mentioned slide illustrates a comprehensive cloud project management. It covers various metrics such as planned and actual spending, risk count, issues count, change requests, overall project progress, etc. Showcasing this set of slides titled Cloud Computing Project Administration Dashboard With Change Requests Ppt Layouts Background Images PDF. The topics addressed in these templates are Project Financials, Project Spend, Project Progress. All the content presented in this PPT design is completely editable. Download it and make adjustments in color, background, font etc. as per your unique business setting.
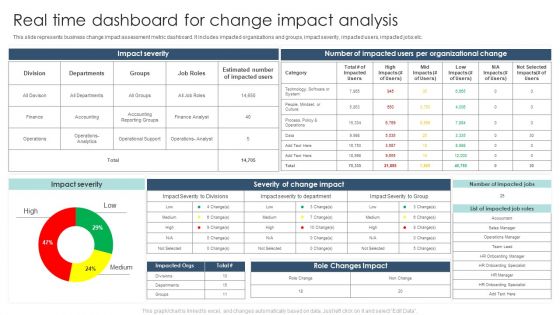
Real Time Dashboard For Change Impact Analysis Ppt Pictures Layouts PDF
This slide represents business change impact assessment metric dashboard. It includes impacted organizations and groups, impact severity, impacted users, impacted jobs etc. Pitch your topic with ease and precision using this Real Time Dashboard For Change Impact Analysis Ppt Pictures Layouts PDF. This layout presents information on Impact Severity, Role Changes Impact, High, Low, Medium. It is also available for immediate download and adjustment. So, changes can be made in the color, design, graphics or any other component to create a unique layout.

Sales Target Metrics With Current Value And Forecasted Change Elements PDF
This slide presents sales KPIs with current value and forecasted change helpful in tracking target achievement and performance of sales team and overall organization. It includes metrics such as average value of won deal, average time to win deal, calls completed, emails sent, meetings completed and total revenue from won deals. Persuade your audience using this Sales Target Metrics With Current Value And Forecasted Change Elements PDF. This PPT design covers three stages, thus making it a great tool to use. It also caters to a variety of topics including Metrics, Value, Change. Download this PPT design now to present a convincing pitch that not only emphasizes the topic but also showcases your presentation skills.
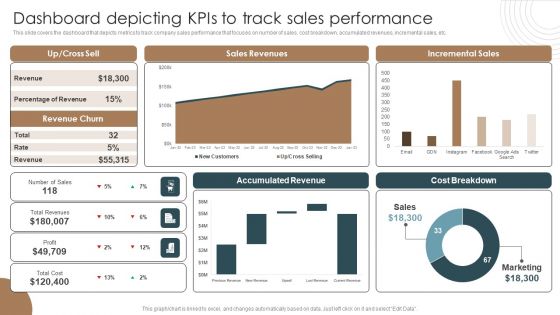
Dashboard Depicting Kpis To Track Sales Performance Integrating Technology To Transform Change Portrait PDF
This slide covers the dashboard that depicts metrics to track company sales performance that focuses on number of sales, cost breakdown, accumulated revenues, incremental sales, etc.If you are looking for a format to display your unique thoughts, then the professionally designed Dashboard Depicting Kpis To Track Sales Performance Integrating Technology To Transform Change Portrait PDF is the one for you. You can use it as a Google Slides template or a PowerPoint template. Incorporate impressive visuals, symbols, images, and other charts. Modify or reorganize the text boxes as you desire. Experiment with shade schemes and font pairings. Alter, share or cooperate with other people on your work. Download Dashboard Depicting Kpis To Track Sales Performance Integrating Technology To Transform Change Portrait PDF and find out how to give a successful presentation. Present a perfect display to your team and make your presentation unforgettable.

Quarter Based Finance Review Kpi Ppt PowerPoint Presentation Background Designs
This is a quarter based finance review kpi ppt powerpoint presentation background designs. This is a five stage process. The stages in this process are cost of sales, gross profit, customer acquisition cost, other operating cost expense, operating profit, change in cash, ending cash.

Investment Project KPI Dashboard For Repair And Rehabilitation Sample PDF
This slide covers dashboard for reviewing the status of capital projects under construction. It includes project information such as active projects, project budget, project schedule, estimated cost, actual cost, etc. Pitch your topic with ease and precision using this Investment Project KPI Dashboard For Repair And Rehabilitation Sample PDF. This layout presents information on Riverside Park Rehabilitation, Construction, Pre Design. It is also available for immediate download and adjustment. So, changes can be made in the color, design, graphics or any other component to create a unique layout.
Consumer Risk Assessment Kpi Dashboard Icon Ppt Icon Professional PDF
Showcasing this set of slides titled Consumer Risk Assessment Kpi Dashboard Icon Ppt Icon Professional PDF. The topics addressed in these templates are Consumer Risk Assessment, KPI Dashboard, Icon. All the content presented in this PPT design is completely editable. Download it and make adjustments in color, background, font etc. as per your unique business setting.
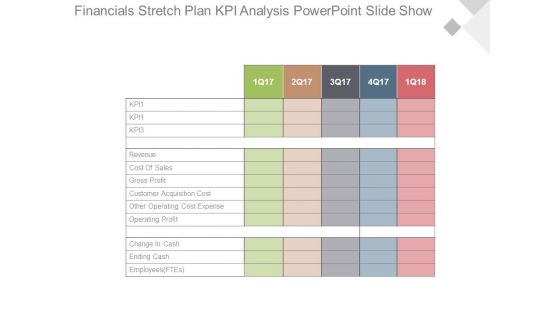
Financials Stretch Plan Kpi Analysis Powerpoint Slide Show
This is a financials stretch plan kpi analysis powerpoint slide show. This is a five stage process. The stages in this process are kpi1, kpi1, kpi3, revenue, cost of sales, gross profit, customer acquisition cost, other operating cost expense, operating profit, change in cash, ending cash, employees ftes.
Kpi Assessment Ppt PowerPoint Presentation Gallery Background Image
This is a kpi assessment ppt powerpoint presentation gallery background image. This is a three stage process. The stages in this process are kpi assessment.

Enterprise Quality Control KPI Executing Effective Quality Enhancement Mockup Pdf
This slide covers KPI dashboard to assess quality control system in organization It involves details such as total issues, issue status and KPIs such as efficiency, customer service and effectiveness indicator. Find highly impressive Enterprise Quality Control KPI Executing Effective Quality Enhancement Mockup Pdf on Slidegeeks to deliver a meaningful presentation. You can save an ample amount of time using these presentation templates. No need to worry to prepare everything from scratch because Slidegeeks experts have already done a huge research and work for you. You need to download Enterprise Quality Control KPI Executing Effective Quality Enhancement Mockup Pdf for your upcoming presentation. All the presentation templates are 100 percent editable and you can change the color and personalize the content accordingly. Download now.

KPI Dashboard To Track IT Protection Performance Elements PDF
This slide shows the dashboard of cyber protection with incident and threat management. It includes overall progress, risk identified, number of critical incidents, initiatives, incident and threat management etc. Pitch your topic with ease and precision using this KPI Dashboard To Track IT Protection Performance Elements PDF. This layout presents information on Incident Management, Threat Management, Critital Risks Identified. It is also available for immediate download and adjustment. So, changes can be made in the color, design, graphics or any other component to create a unique layout.
PPC Marketing KPI Dashboard To Analyse Strategy Efficiency Icons PDF
This slide covers PPC marketing dashboard to improve efficiency. It involves total spends, number of clicks, cost per conversion, change in conversion rate and cost per thousand impression. Make sure to capture your audiences attention in your business displays with our gratis customizable PPC Marketing KPI Dashboard To Analyse Strategy Efficiency Icons PDF. These are great for business strategies, office conferences, capital raising or task suggestions. If you desire to acquire more customers for your tech business and ensure they stay satisfied, create your own sales presentation with these plain slides.
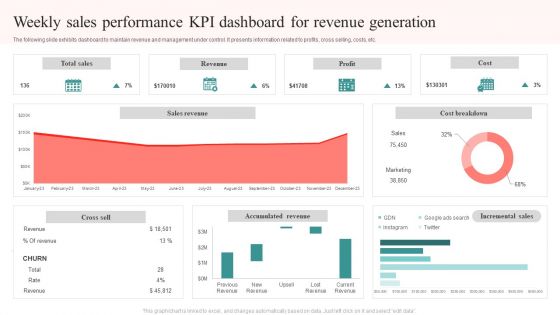
Weekly Sales Performance KPI Dashboard For Revenue Generation Brochure PDF
The following slide exhibits dashboard to maintain revenue and management under control. It presents information related to profits, cross selling, costs, etc. Pitch your topic with ease and precision using this Weekly Sales Performance KPI Dashboard For Revenue Generation Brochure PDF. This layout presents information on Total Sales, Revenue, Profit, Cost. It is also available for immediate download and adjustment. So, changes can be made in the color, design, graphics or any other component to create a unique layout.
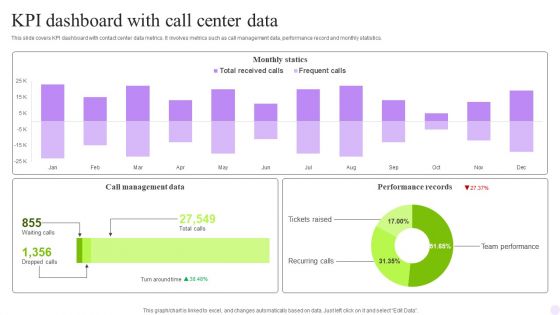
KPI Dashboard With Call Center Data Rules PDF
This slide covers contact center performance metrics KPI dashboard. It involves details such as number of total calls, average answer speed, abandon rate, data of agents performance and call abandon rate by departments. Pitch your topic with ease and precision using this KPI Dashboard With Call Center Data Rules PDF. This layout presents information on Monthly Statics, Management Data, Performance Records. It is also available for immediate download and adjustment. So, changes can be made in the color, design, graphics or any other component to create a unique layout.
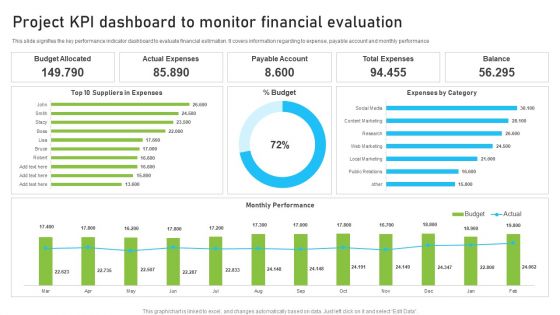
Project KPI Dashboard To Monitor Financial Evaluation Background PDF
This slide signifies the construction project management projection plan. It covers information regarding to the estimate ID, Task, effort hours, resource quantity, performance factor and duration evaluation. Pitch your topic with ease and precision using this Project KPI Dashboard To Monitor Financial Evaluation Background PDF. This layout presents information on Actual Expenses, Payable Account, Budget Allocated. It is also available for immediate download and adjustment. So, changes can be made in the color, design, graphics or any other component to create a unique layout.
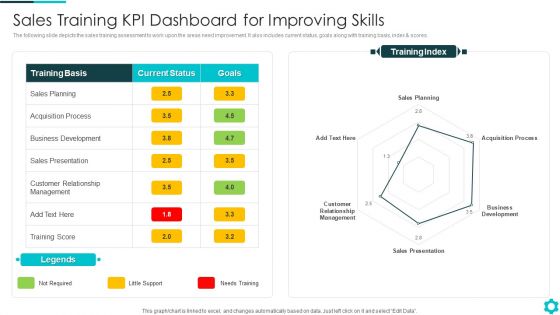
Sales Training KPI Dashboard For Improving Skills Portrait PDF
The following slide depicts the sales training assessment to work upon the areas need improvement. It also includes current status, goals along with training basis, index and scores.Showcasing this set of slides titled Sales Training KPI Dashboard For Improving Skills Portrait PDF The topics addressed in these templates are Acquisition Process, Sales Presentation, Customer Relationship Management All the content presented in this PPT design is completely editable. Download it and make adjustments in color, background, font etc. as per your unique business setting.

Compliance Learning And Improvement KPI Training Dashboard Sample Pdf
This slide provides glimpse about facts and figures of compliance training for employees in a business organization. It includes no. of employees, compliance percent, compliance status by month, etc. Pitch your topic with ease and precision using this Compliance Learning And Improvement KPI Training Dashboard Sample Pdf. This layout presents information on Compliance Learning, Improvement KPI, Training Dashboard, Compliance Training. It is also available for immediate download and adjustment. So, changes can be made in the color, design, graphics or any other component to create a unique layout.
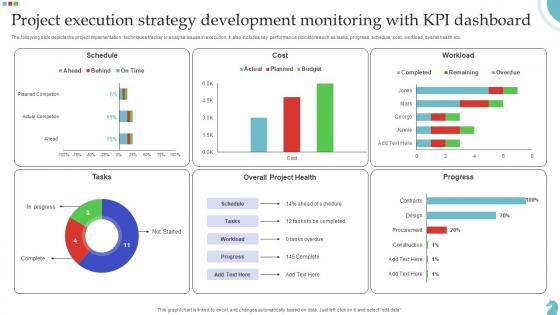
Project Execution Strategy Development Monitoring With Kpi Dashboard Download Pdf
The following slide depicts the project implementation techniques tracker to analyse issues in execution. It also includes key performance indicators such as tasks, progress, schedule, cost, workload, overall health etc. Pitch your topic with ease and precision using this Project Execution Strategy Development Monitoring With Kpi Dashboard Download Pdf. This layout presents information on Project Execution, Strategy Development, Monitoring Kpi Dashboard. It is also available for immediate download and adjustment. So, changes can be made in the color, design, graphics or any other component to create a unique layout.

Continuous Process Improvement KPI Dashboard For IT Industry Clipart PDF
Following slide depicts the IT industry KPI dashboard which will assist in generating more of profit by improving strategic plan according to changing environment with clients preferences .The KPI mentioned in a slide are such as risk analysis, outstanding task , upcoming task, budget analysis, etc. Pitch your topic with ease and precision using this Continuous Process Improvement KPI Dashboard For IT Industry Clipart PDF. This layout presents information on Overall Progress, Risk Analysis, Budget Analysis. It is also available for immediate download and adjustment. So, changes can be made in the color, design, graphics or any other component to create a unique layout.

Yearly Turnover With Target KPI PPT Example SS
Present like a pro with Yearly Turnover With Target KPI PPT Example SS. Create beautiful presentations together with your team, using our easy-to-use presentation slides. Share your ideas in real-time and make changes on the fly by downloading our templates. So whether you are in the office, on the go, or in a remote location, you can stay in sync with your team and present your ideas with confidence. With Slidegeeks presentation got a whole lot easier. Grab these presentations today.
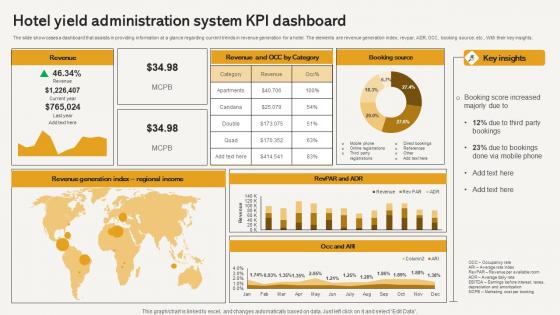
Hotel Yield Administration System Kpi Dashboard Elements Pdf
The slide showcases a dashboard that assists in providing information at a glance regarding current trends in revenue generation for a hotel. The elements are revenue generation index, revpar, ADR, OCC, booking source, etc., With their key insights. Pitch your topic with ease and precision using this Hotel Yield Administration System Kpi Dashboard Elements Pdf This layout presents information on Revenue, Booking Source, Regional Income, Key Insights It is also available for immediate download and adjustment. So, changes can be made in the color, design, graphics or any other component to create a unique layout.

Problem Administration Kpi Dashboard With Bugs Status Ideas PDF
This slide covers dashboard that will help the project managers to keep the track of the bugs faced by the team members during the IT project. Pitch your topic with ease and precision using this problem administration kpi dashboard with bugs status ideas pdf. This layout presents information on problem administration kpi dashboard with bugs status. It is also available for immediate download and adjustment. So, changes can be made in the color, design, graphics or any other component to create a unique layout.
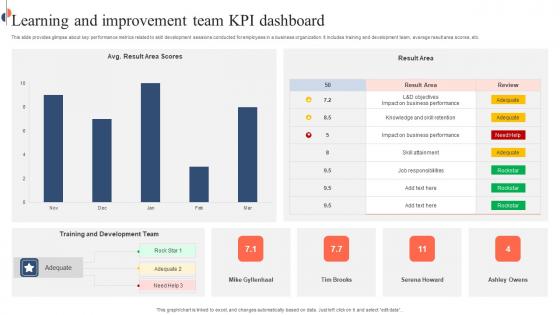
Learning And Improvement Team KPI Dashboard Slides Pdf
This slide provides glimpse about key performance metrics related to skill development sessions conducted for employees in a business organization. It includes training and development team, average result area scores, etc. Pitch your topic with ease and precision using this Learning And Improvement Team KPI Dashboard Slides Pdf. This layout presents information on Learning And Improvement Team, KPI Dashboard, Development Team. It is also available for immediate download and adjustment. So, changes can be made in the color, design, graphics or any other component to create a unique layout.
KPI Dashboard For Tracking Brand Communication Techniques Performance Topics PDF
The following slide illustrates dashboard which helps brand managers to improve their communication campaign performance. It presents information related to campaigns, cost per acquisitions, etc. Pitch your topic with ease and precision using this KPI Dashboard For Tracking Brand Communication Techniques Performance Topics PDF. This layout presents information on KPI Dashboard, Tracking Brand Communication, Techniques Performance. It is also available for immediate download and adjustment. So, changes can be made in the color, design, graphics or any other component to create a unique layout.

Financial Projecting Dashboard With Various KPI Themes Pdf
Following slide showcasing the dashboard on financial planning of an organization to generate maximum of revenue by reducing their cost. The KPI such as waterfall statement , income and expenditure, payable accounts , etc . Pitch your topic with ease and precision using this Financial Projecting Dashboard With Various KPI Themes Pdf. This layout presents information on Income Budget, Expenses Budget, Net Profit Margin. It is also available for immediate download and adjustment. So, changes can be made in the color, design, graphics or any other component to create a unique layout.
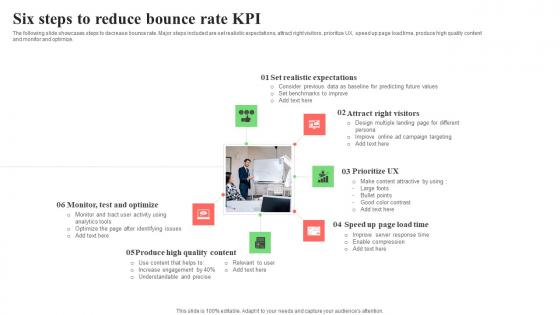
Six Steps To Reduce Bounce Rate KPI Mockup Pdf
The following slide showcases steps to decrease bounce rate. Major steps included are set realistic expectations, attract right visitors, prioritize UX, speed up page load time, produce high quality content and monitor and optimize. Pitch your topic with ease and precision using this Six Steps To Reduce Bounce Rate KPI Mockup Pdf. This layout presents information on Load Time, Produce High, Quality Content. It is also available for immediate download and adjustment. So, changes can be made in the color, design, graphics or any other component to create a unique layout.
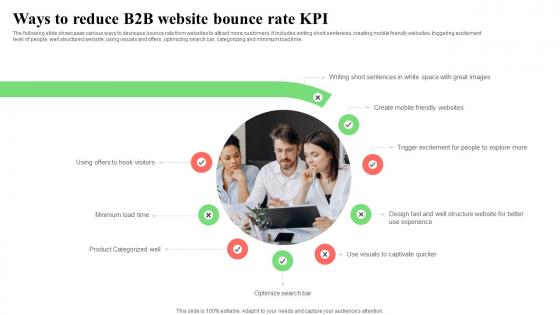
Ways To Reduce B2B Website Bounce Rate KPI Information Pdf
The following slide showcases various ways to decrease bounce rate from websites to attract more customers. It includes writing short sentences, creating mobile friendly websites, triggering excitement level of people, well structured website, using visuals and offers, optimizing search bar, categorizing and minimum load time. Pitch your topic with ease and precision using this Ways To Reduce B2B Website Bounce Rate KPI Information Pdf. This layout presents information on Well Structured Website, Using Visuals Offers, Optimizing Search. It is also available for immediate download and adjustment. So, changes can be made in the color, design, graphics or any other component to create a unique layout.
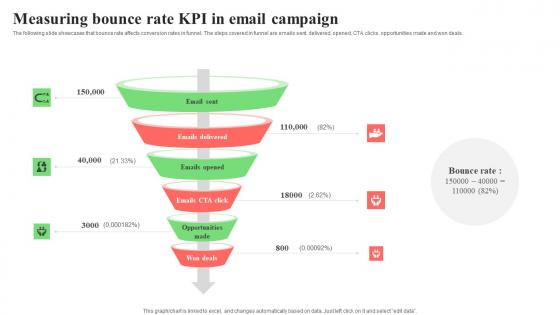
Measuring Bounce Rate KPI In Email Campaign Designs Pdf
The following slide showcases that bounce rate affects conversion rates in funnel. The steps covered in funnel are emails sent, delivered, opened, CTA clicks, opportunities made and won deals. Pitch your topic with ease and precision using this Measuring Bounce Rate KPI In Email Campaign Designs Pdf. This layout presents information on Delivered, Opened, CTA Clicks, Opportunities. It is also available for immediate download and adjustment. So, changes can be made in the color, design, graphics or any other component to create a unique layout.
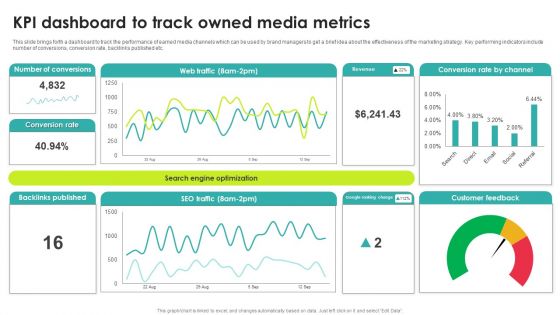
Kpi Dashboard To Track Owned Media Metrics Rules PDF
This slide brings forth a dashboard to track the performance of earned media channels which can be used by brand managers to get a brief idea about the effectiveness of the marketing strategy. Key performing indicators include number of conversions, conversion rate, backlinks published etc. Pitch your topic with ease and precision using this Kpi Dashboard To Track Owned Media Metrics Rules PDF. This layout presents information on Conversions, Backlinks Published, Metrics. It is also available for immediate download and adjustment. So, changes can be made in the color, design, graphics or any other component to create a unique layout.

KPI Dashboard For Modernizing Hospitality Business Inspiration PDF
The following slide showcases dashboard to track data and perform analytics for managing staff, ordering supplies and to maintain customer satisfaction. It presents information related to expenses, sales, etc. Pitch your topic with ease and precision using this KPI Dashboard For Modernizing Hospitality Business Inspiration PDF. This layout presents information on Fiscal Year, Labor, Modernizing Hospitality. It is also available for immediate download and adjustment. So, changes can be made in the color, design, graphics or any other component to create a unique layout.
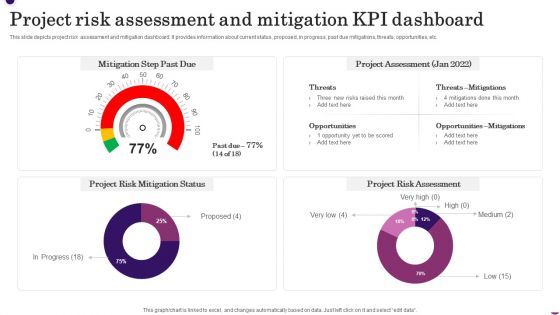
Project Risk Assessment And Mitigation KPI Dashboard Summary PDF
Pitch your topic with ease and precision using this Project Risk Assessment And Mitigation KPI Dashboard Summary PDF. This layout presents information on Mitigation Step Past Due, Project Assessment, Mitigation Status, Project Risk Assessment. It is also available for immediate download and adjustment. So, changes can be made in the color, design, graphics or any other component to create a unique layout.
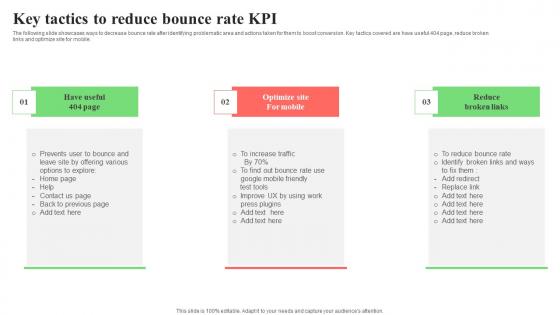
Key Tactics To Reduce Bounce Rate KPI Summary Pdf
The following slide showcases ways to decrease bounce rate after identifying problematic area and actions taken for them to boost conversion. Key tactics covered are have useful 404 page, reduce broken links and optimize site for mobile. Pitch your topic with ease and precision using this Key Tactics To Reduce Bounce Rate KPI Summary Pdf. This layout presents information on Reduce Broken, Optimize Site, Mobile. It is also available for immediate download and adjustment. So, changes can be made in the color, design, graphics or any other component to create a unique layout.

Financial KPI Dashboard With Profit And Loss Summary Professional PDF
Pitch your topic with ease and precision using this Financial KPI Dashboard With Profit And Loss Summary Professional PDF. This layout presents information on Net Working Capital, Gross Working Capital. It is also available for immediate download and adjustment. So, changes can be made in the color, design, graphics or any other component to create a unique layout.
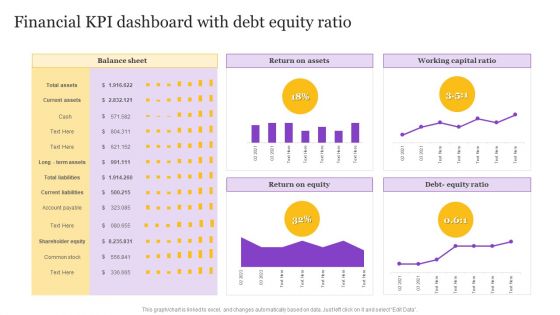
Financial KPI Dashboard With Debt Equity Ratio Rules PDF
Pitch your topic with ease and precision using this Financial KPI Dashboard With Debt Equity Ratio Rules PDF. This layout presents information on Working Capital Ratio, Return On Assets, Return On Equity. It is also available for immediate download and adjustment. So, changes can be made in the color, design, graphics or any other component to create a unique layout.
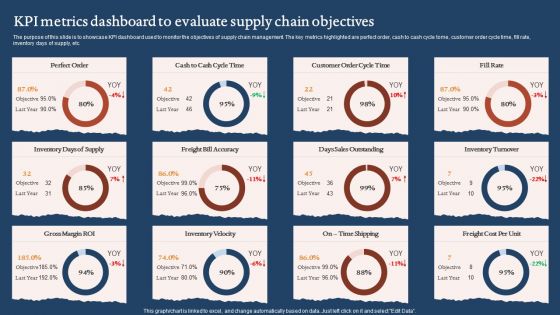
KPI Metrics Dashboard To Evaluate Supply Chain Objectives Graphics PDF
The purpose of this slide is to showcase KPI dashboard used to monitor the objectives of supply chain management. The key metrics highlighted are perfect order, cash to cash cycle tome, customer order cycle time, fill rate, inventory days of supply, etc. Pitch your topic with ease and precision using this KPI Metrics Dashboard To Evaluate Supply Chain Objectives Graphics PDF. This layout presents information on Days Sales Outstanding, Inventory Velocity, Gross Margin Roi. It is also available for immediate download and adjustment. So, changes can be made in the color, design, graphics or any other component to create a unique layout.
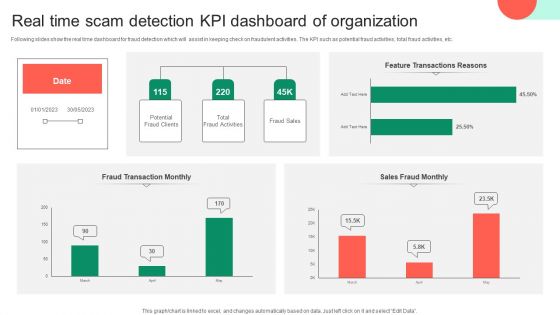
Real Time Scam Detection KPI Dashboard Of Organization Information PDF
Following slides show the real time dashboard for fraud detection which will assist in keeping check on fraudulent activities. The KPI such as potential fraud activities, total fraud activities, etc. Pitch your topic with ease and precision using this Real Time Scam Detection KPI Dashboard Of Organization Information PDF. This layout presents information on Real Time Scam Detection, Kpi Dashboard Of Organization. It is also available for immediate download and adjustment. So, changes can be made in the color, design, graphics or any other component to create a unique layout.
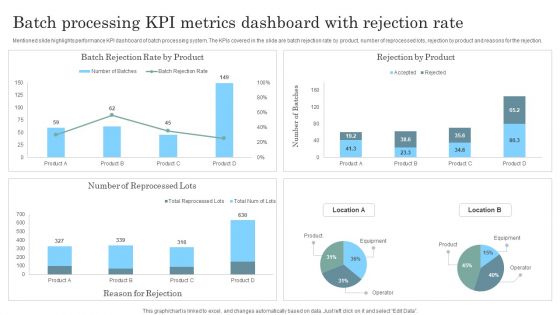
Batch Processing KPI Metrics Dashboard With Rejection Rate Topics PDF
Mentioned slide highlights performance KPI dashboard of batch processing system. The KPIs covered in the slide are batch rejection rate by product, number of reprocessed lots, rejection by product and reasons for the rejection. Pitch your topic with ease and precision using this Batch Processing KPI Metrics Dashboard With Rejection Rate Topics PDF. This layout presents information on Batch Processing KPI Metrics, Dashboard Rejection Rate. It is also available for immediate download and adjustment. So, changes can be made in the color, design, graphics or any other component to create a unique layout.
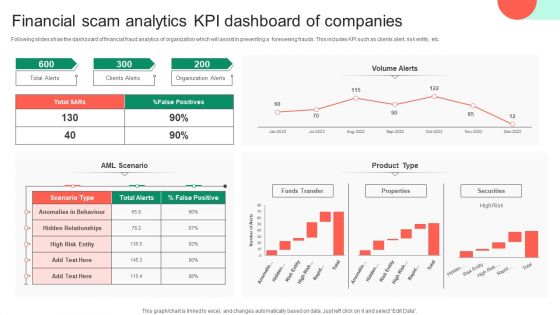
Financial Scam Analytics KPI Dashboard Of Companies Clipart PDF
Following slides show the dashboard of financial fraud analytics of organization which will assist in preventing a foreseeing frauds. This includes KPI such as clients alert, risk entity, etc. Pitch your topic with ease and precision using this Financial Scam Analytics KPI Dashboard Of Companies Clipart PDF. This layout presents information on Financial Scam Analytics, Kpi Dashboard Of Companies. It is also available for immediate download and adjustment. So, changes can be made in the color, design, graphics or any other component to create a unique layout.
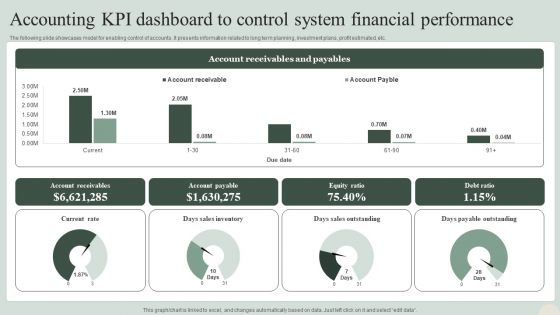
Accounting KPI Dashboard To Control System Financial Performance Formats PDF
The following slide showcases model for enabling control of accounts. It presents information related to long term planning, investment plans, profit estimated, etc. Pitch your topic with ease and precision using this Accounting KPI Dashboard To Control System Financial Performance Formats PDF. This layout presents information on Sales Outstanding, Payable Outstanding, Sales Inventory. It is also available for immediate download and adjustment. So, changes can be made in the color, design, graphics or any other component to create a unique layout.

KPI Framework For Manufacturing Ppt PowerPoint Presentation Gallery Themes PDF
This slide highlights key performance indicator framework for manufacturing company which includes different kpis such as labor cost, material cost, equipment utilization, average downtime etc. It also includes the success criteria for each KPI. Pitch your topic with ease and precision using this kpi framework for manufacturing ppt powerpoint presentation gallery themes pdf This layout presents information on measure, manufacturing, performance. It is also available for immediate download and adjustment. So, changes can be made in the color, design, graphics or any other component to create a unique layout.
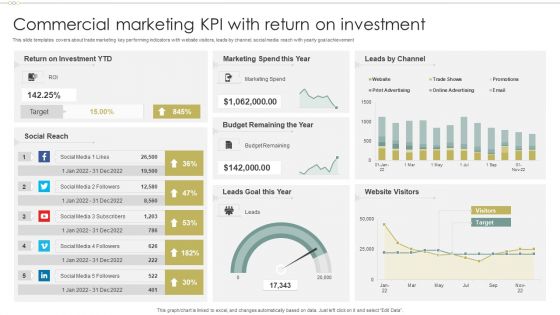
Commercial Marketing KPI With Return On Investment Diagrams PDF
This slide templates covers about trade marketing key performing indicators with website visitors, leads by channel, social media reach with yearly goal achievement.Pitch your topic with ease and precision using this Commercial Marketing KPI With Return On Investment Diagrams PDF. This layout presents information on Marketing Spend, Return Investment, Budget Remaining. It is also available for immediate download and adjustment. So, changes can be made in the color, design, graphics or any other component to create a unique layout.

Talent Acquisition And Multinational Hiring KPI Dashboard Mockup PDF
The slide highlights the talent acquisition and multinational recruitment dash board depicting number of positions, open positions by location, candidate pipeline, interview and compliance.Pitch your topic with ease and precision using this Talent Acquisition And Multinational Hiring KPI Dashboard Mockup PDF This layout presents information on Candidate Ranking, Positions, Contingent It is also available for immediate download and adjustment. So, changes can be made in the color, design, graphics or any other component to create a unique layout.
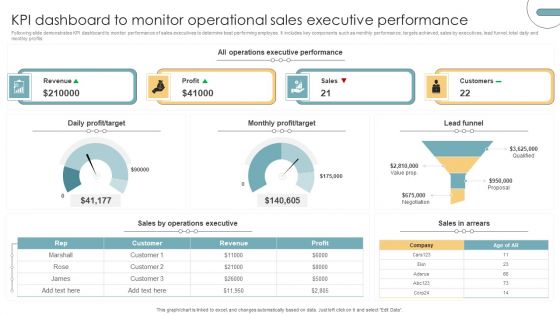
KPI Dashboard To Monitor Operational Sales Executive Performance Portrait PDF
Following slide demonstrates KPI dashboard to monitor performance of sales executives to determine best performing employee. It includes key components such as monthly performance, targets achieved, sales by executives, lead funnel, total daily and monthly profits. Pitch your topic with ease and precision using this KPI Dashboard To Monitor Operational Sales Executive Performance Portrait PDF. This layout presents information on Revenue, Profit, Sales, Customers. It is also available for immediate download and adjustment. So, changes can be made in the color, design, graphics or any other component to create a unique layout.
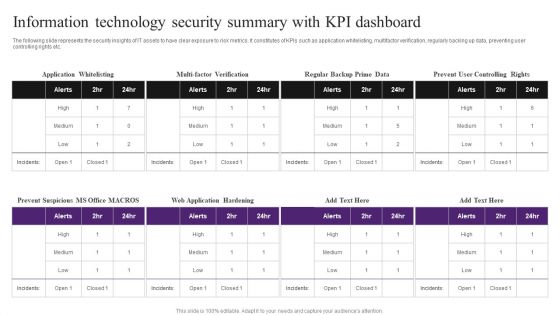
Information Technology Security Summary With KPI Dashboard Inspiration PDF
The following slide represents the security insights of IT assets to have clear exposure to risk metrics. It constitutes of KPIs such as application whitelisting, multifactor verification, regularly backing up data, preventing user controlling rights etc. Pitch your topic with ease and precision using this Information Technology Security Summary With KPI Dashboard Inspiration PDF. This layout presents information on Information Technology Security, Summary With KPI Dashboard. It is also available for immediate download and adjustment. So, changes can be made in the color, design, graphics or any other component to create a unique layout.
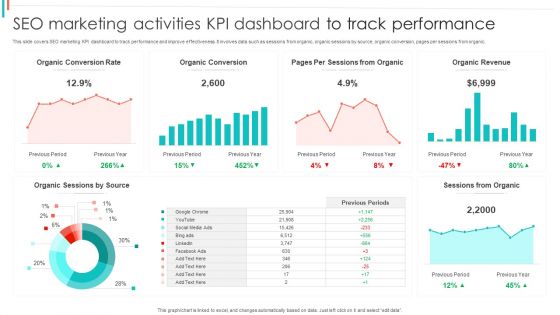
SEO Marketing Activities KPI Dashboard To Track Performance Brochure PDF
This slide covers SEO marketing KPI dashboard to track performance and improve effectiveness. It involves data such as sessions from organic, organic sessions by source, organic conversion, pages per sessions from organic.Pitch your topic with ease and precision using this SEO Marketing Activities KPI Dashboard To Track Performance Brochure PDF. This layout presents information on Organic Conversion, Sessions Organic, Organic Revenue. It is also available for immediate download and adjustment. So, changes can be made in the color, design, graphics or any other component to create a unique layout.

Digital KPI Dashboard To Track Email Bounce Slides PDF
This slide shows dashboard which can e used by organizations to monitor performance of email. It includes key performance indicators such as traffic status, conversions, behaviors, etc. Pitch your topic with ease and precision using this Digital KPI Dashboard To Track Email Bounce Slides PDF. This layout presents information on Digital Kpi Dashboard, Track Email Bounce. It is also available for immediate download and adjustment. So, changes can be made in the color, design, graphics or any other component to create a unique layout.
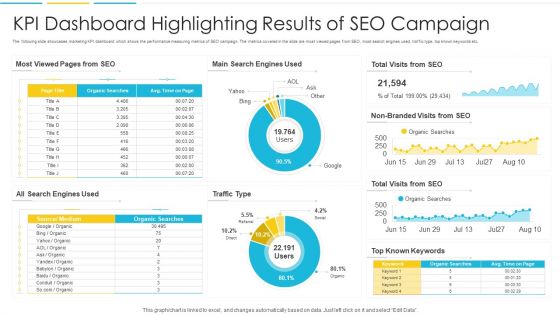
KPI Dashboard Highlighting Results Of SEO Campaign Topics PDF
The following slide showcases marketing KPI dashboard which shows the performance measuring metrics of SEO campaign. The metrics covered in the slide are most viewed pages from SEO, most search engines used, traffic type, top known keywords etc. Pitch your topic with ease and precision using this KPI Dashboard Highlighting Results Of SEO Campaign Topics PDF. This layout presents information on Search Engines, Traffic, Organic. It is also available for immediate download and adjustment. So, changes can be made in the color, design, graphics or any other component to create a unique layout.
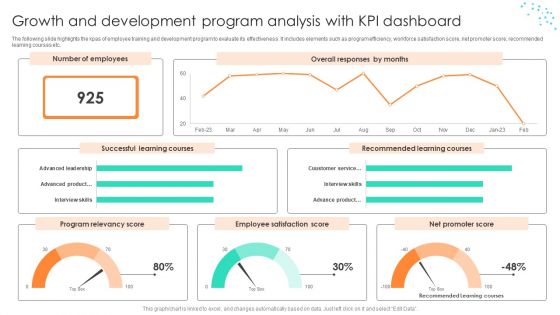
Growth And Development Program Analysis With KPI Dashboard Structure PDF
The following slide highlights the kpas of employee training and development program to evaluate its effectiveness. It includes elements such as program efficiency, workforce satisfaction score, net promoter score, recommended learning courses etc. Pitch your topic with ease and precision using this Growth And Development Program Analysis With KPI Dashboard Structure PDF. This layout presents information on Analysis With KPI Dashboard, Growth And Development Program. It is also available for immediate download and adjustment. So, changes can be made in the color, design, graphics or any other component to create a unique layout.
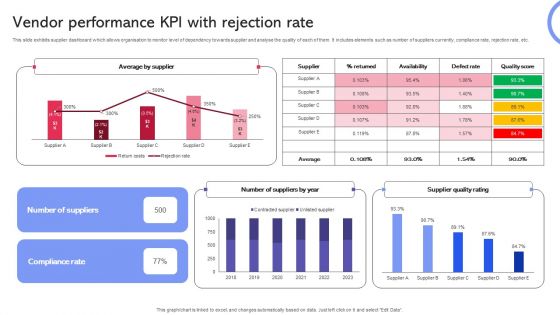
Vendor Performance KPI With Rejection Rate Inspiration PDF
This slide exhibits supplier dashboard which allows organisation to monitor level of dependency towards supplier and analyse the quality of each of them. It includes elements such as number of suppliers currently, compliance rate, rejection rate, etc. Pitch your topic with ease and precision using this Vendor Performance KPI With Rejection Rate Inspiration PDF. This layout presents information on Vendor Performance KPI, Rejection Rate. It is also available for immediate download and adjustment. So, changes can be made in the color, design, graphics or any other component to create a unique layout.

Logistics KPI Dashboard With Loading Time Utilization Analysis Download PDF
The following slide showcases some KPIs to measure effectiveness of logistics and supply chain management. It includes KPAs such as fleet analysis, order delivery state, location wise delivery status, yearly loading time etc. Pitch your topic with ease and precision using this Logistics KPI Dashboard With Loading Time Utilization Analysis Download PDF. This layout presents information on Fleet Analysis, Order Delivery State, Location Wise Delivery Status. It is also available for immediate download and adjustment. So, changes can be made in the color, design, graphics or any other component to create a unique layout.
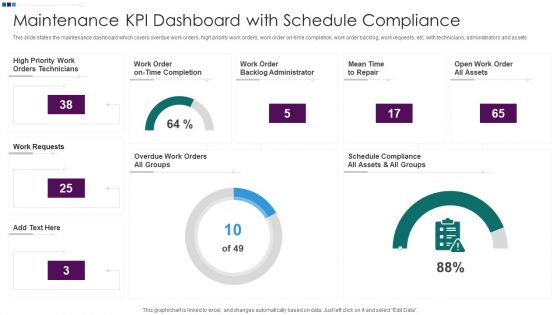
Maintenance KPI Dashboard With Schedule Compliance Ppt Styles Demonstration PDF
This slide states the maintenance dashboard which covers overdue work orders, high priority work orders, work order on-time completion, work order backlog, work requests, etc. with technicians, administrators and assets. Pitch your topic with ease and precision using this Maintenance KPI Dashboard With Schedule Compliance Ppt Styles Demonstration PDF. This layout presents information on High Priority Work, Work Order Backlog, Mean Time Repair, Open Work Order. It is also available for immediate download and adjustment. So, changes can be made in the color, design, graphics or any other component to create a unique layout.

Digital Marketing KPI Framework Ppt PowerPoint Presentation File Slides PDF
This slide outlines relevant information about digital marketing key performance indicator framework. It includes different stages of brand journey such as reach, act, convert and engage along with kips, indicators and segments. Pitch your topic with ease and precision using this digital marketing kpi framework ppt powerpoint presentation file slides pdf This layout presents information on techniques, demographics, customers It is also available for immediate download and adjustment. So, changes can be made in the color, design, graphics or any other component to create a unique layout.
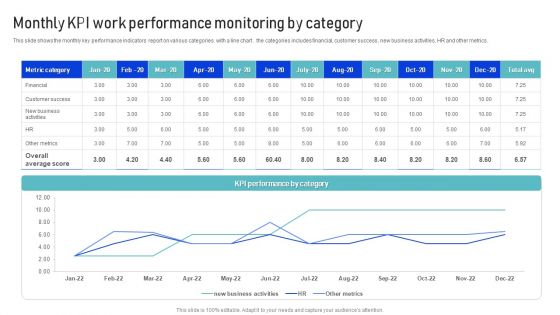
Monthly KPI Work Performance Monitoring By Category Microsoft PDF
This slide shows the monthly key performance indicators report on various categories with a line chart . the categories includes financial, customer success , new business activities, HR and other metrics. Pitch your topic with ease and precision using this Monthly KPI Work Performance Monitoring By Category Microsoft PDF. This layout presents information on Metrics, Financial, Customer Success. It is also available for immediate download and adjustment. So, changes can be made in the color, design, graphics or any other component to create a unique layout.

Quarterly Overall Business Performance Assessment With Kpi Dashboard Microsoft PDF
The given below slide showcases the overall business performance to evaluate the trends and KPAs. It includes quarterly insights of elements such as revenue, new customers, net profit, customer satisfaction, sales profitability, growth etc. Pitch your topic with ease and precision using this Quarterly Overall Business Performance Assessment With Kpi Dashboard Microsoft PDF. This layout presents information on Revenue, Customer Satisfaction, Net Profit. It is also available for immediate download and adjustment. So, changes can be made in the color, design, graphics or any other component to create a unique layout.
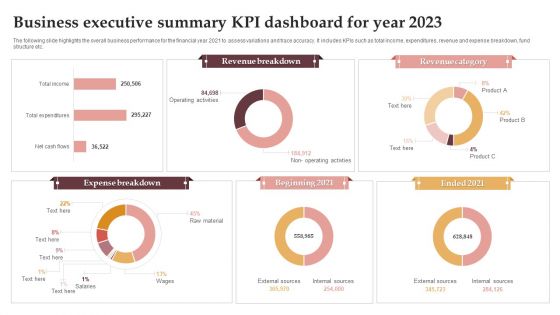
Business Executive Summary KPI Dashboard For Year 2023 Graphics PDF
The following slide highlights the overall business performance for the financial year 2021 to assess variations and trace accuracy. It includes KPIs such as total income, expenditures, revenue and expense breakdown, fund structure etc. Pitch your topic with ease and precision using this Business Executive Summary KPI Dashboard For Year 2023 Graphics PDF. This layout presents information on Revenue Breakdown, Revenue Category, Expense Breakdown. It is also available for immediate download and adjustment. So, changes can be made in the color, design, graphics or any other component to create a unique layout.

Sales And Revenue Assessment Kpi Dashboard Brochure PDF
Following slide exhibits dashboard that determine impact of environmental assessment on business performance. It includes indicators such as average operative cost, product model performance etc. If your project calls for a presentation, then Slidegeeks is your go-to partner because we have professionally designed, easy-to-edit templates that are perfect for any presentation. After downloading, you can easily edit Sales And Revenue Assessment Kpi Dashboard Brochure PDF and make the changes accordingly. You can rearrange slides or fill them with different images. Check out all the handy templates
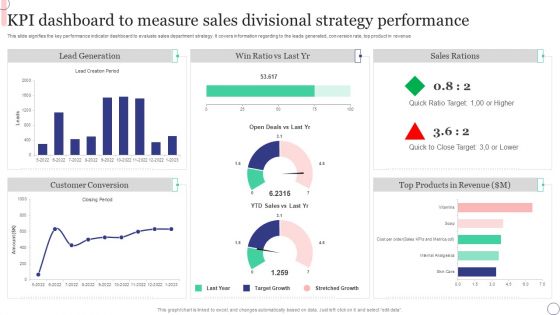
KPI Dashboard To Measure Sales Divisional Strategy Performance Microsoft PDF
This slide signifies the key performance indicator dashboard to evaluate sales department strategy. It covers information regarding to the leads generated, conversion rate, top product in revenue. Pitch your topic with ease and precision using this KPI Dashboard To Measure Sales Divisional Strategy Performance Microsoft PDF. This layout presents information on Sales Rations, Lead Generation, Customer Conversion. It is also available for immediate download and adjustment. So, changes can be made in the color, design, graphics or any other component to create a unique layout.
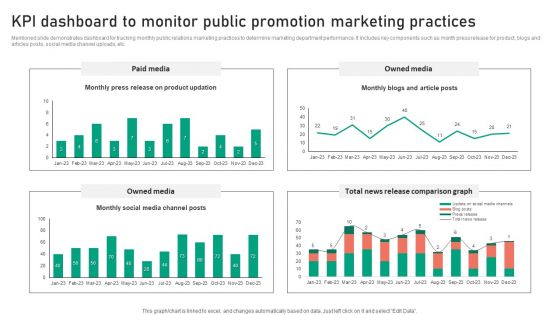
KPI Dashboard To Monitor Public Promotion Marketing Practices Template PDF
Mentioned slide demonstrates dashboard for tracking monthly public relations marketing practices to determine marketing department performance. It includes key components such as month press release for product, blogs and articles posts, social media channel uploads, etc. Pitch your topic with ease and precision using this KPI Dashboard To Monitor Public Promotion Marketing Practices Template PDF. This layout presents information on Paid Media, Owned Media, Total News Release, Comparison Graph. It is also available for immediate download and adjustment. So, changes can be made in the color, design, graphics or any other component to create a unique layout.

Online Marketing KPI Dashboard With Cost Trend Slides PDF
The following slide highlights the key metrics of digital marketing to reach the target audience in the most cost effective way. It includes average daily impressions, click through rate, cost per click, lead generation, conversion and scoring etc. Pitch your topic with ease and precision using this Online Marketing KPI Dashboard With Cost Trend Slides PDF. This layout presents information on Average Daily Impressions, Click Through Rate, Cost Per Click, Lead Generation, Conversion And Scoring. It is also available for immediate download and adjustment. So, changes can be made in the color, design, graphics or any other component to create a unique layout.
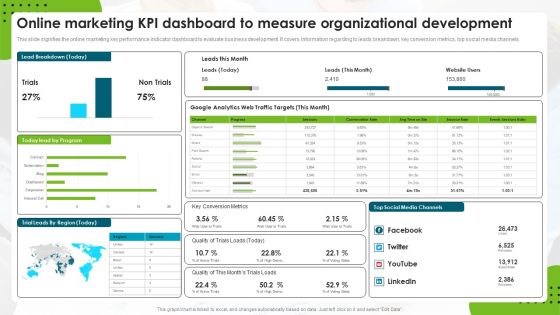
Online Marketing Kpi Dashboard To Measure Organizational Development Rules PDF
This slide signifies the online marketing key performance indicator dashboard to evaluate business development. It covers information regarding to leads breakdown, key conversion metrics, top social media channels. Pitch your topic with ease and precision using this Online Marketing Kpi Dashboard To Measure Organizational Development Rules PDF. This layout presents information on Web Traffic Targets, Google Analytics, Social Media Channels. It is also available for immediate download and adjustment. So, changes can be made in the color, design, graphics or any other component to create a unique layout.

 Home
Home