Change Management Infographics
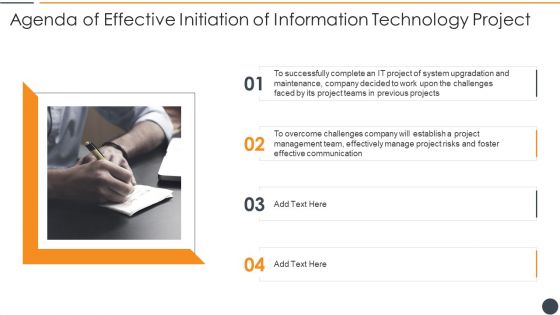
Agenda Of Effective Initiation Of Information Technology Project Infographics PDF
This is a agenda of effective initiation of information technology project infographics pdf template with various stages. Focus and dispense information on four stages using this creative set, that comes with editable features. It contains large content boxes to add your information on topics like it project, project management team, project risks, communication. You can also showcase facts, figures, and other relevant content using this PPT layout. Grab it now.

Process Involved In Qualitative Data Evaluation Infographics Pdf
This slide covers process of qualitative analysis. The purpose of this slide is to represent comprehensive steps to assess data and study research question by drawing useful insights. It includes various steps such as translating data, understanding data etc. Pitch your topic with ease and precision using this Process Involved In Qualitative Data Evaluation Infographics Pdf This layout presents information on Qualitative Data, Analysis Steps, Framework It is also available for immediate download and adjustment. So, changes can be made in the color, design, graphics or any other component to create a unique layout.

Risk Analysis Process Of It Network Infographics Pdf
This slide illustrates risk assessment life cycle steps that helps the organization to identify all potential risk associate with network operation and to formulating effective mitigation action plan. It includes steps such as evaluation, vulnerability identification, exposure determination, threat determination, risk assessment and risk mitigation.Pitch your topic with ease and precision using this Risk Analysis Process Of It Network Infographics Pdf This layout presents information on Threat Determination, Vulnerability Identification, Exposure Determination It is also available for immediate download and adjustment. So, changes can be made in the color, design, graphics or any other component to create a unique layout.
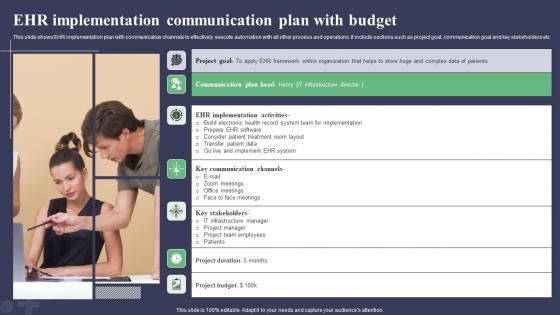
EHR Implementation Communication Plan With Budget Infographics Pdf
This slide shows EHR implementation plan with communication channels to effectively execute automation with all other process and operations. It include sections such as project goal, communication goal and key stakeholders etc.Pitch your topic with ease and precision using this EHR Implementation Communication Plan With Budget Infographics Pdf This layout presents information on Key Communication Channels, Key Stakeholders, Build Electronic It is also available for immediate download and adjustment. So, changes can be made in the color, design, graphics or any other component to create a unique layout.

Key Benefits Of Eco Marketing Strategy Infographics Pdf
This slide outlines strategic advantages of green marketing aimed at creating a positive social impact on environment by making business sustainably oriented. It covers appealing to new markets, profitability, low costs and awareness. Pitch your topic with ease and precision using this Key Benefits Of Eco Marketing Strategy Infographics Pdf. This layout presents information on Profitability, Low Costs, Awareness. It is also available for immediate download and adjustment. So, changes can be made in the color, design, graphics or any other component to create a unique layout.

Pricing Plan For Marketing New Product Infographics Pdf
This slide showcase various pricing strategic approach for marketing new product and increase product reach and target audience. It includes cost plus pricing, margin cost pricing, experience curve pricing, demand based pricing and psychological pricing. Pitch your topic with ease and precision using this Pricing Plan For Marketing New Product Infographics Pdf. This layout presents information on Margin Cost Pricing, Experience Curve Pricing, Demand Based Pricing. It is also available for immediate download and adjustment. So, changes can be made in the color, design, graphics or any other component to create a unique layout.

Steps For Value Based Pricing Plan Infographics Pdf
This slide showcase steps for value pricing strategy approach for product with market analysis and creating ideal prices for product. It includes evaluate consumer need and value, set target price to reflect customer value, choose pricing model and experiment and learn. Pitch your topic with ease and precision using this Steps For Value Based Pricing Plan Infographics Pdf. This layout presents information on Value Pricing Strategy Approach, Market Analysis, Ideal Prices For Product. It is also available for immediate download and adjustment. So, changes can be made in the color, design, graphics or any other component to create a unique layout.
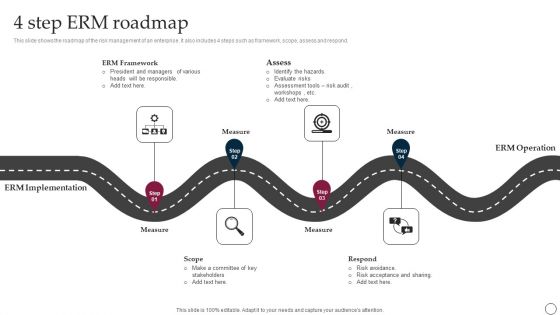
4 Step ERM Roadmap Ppt PowerPoint Presentation File Infographics PDF
This slide shows the roadmap of the risk management of an enterprise. It also includes 4 steps such as framework, scope, assess and respond. Presenting 4 Step ERM Roadmap Ppt PowerPoint Presentation File Infographics PDF to dispense important information. This template comprises four stages. It also presents valuable insights into the topics including Erm Framework, Measure, Erm Implementation. This is a completely customizable PowerPoint theme that can be put to use immediately. So, download it and address the topic impactfully.

Steps To Enhance Efficiency Of Marketing Group Infographics Pdf
The mentioned slide delineates the steps to improve efficiency of marketing team so that they work to the best of their abilities. It includes clearly stating work strategy, embracing a collaboration tool, meeting personally, tracking the efforts, revising and improve etc. Pitch your topic with ease and precision using this Steps To Enhance Efficiency Of Marketing Group Infographics Pdf. This layout presents information on Diminish Distractions, Encourage Productivity, Discourage Multitasking. It is also available for immediate download and adjustment. So, changes can be made in the color, design, graphics or any other component to create a unique layout.

Benefits And Positive Impacts Of Edge Analytics Infographics Pdf
This slide covers the benefits of edge analytics and positive impacts on businesses. The purpose of this template is to showcase the advantages of edge analytics in terms of reduced latency, improved security, and improved compliance. It includes operational efficiency, reduced data breaches, and enhanced decision making.Pitch your topic with ease and precision using this Benefits And Positive Impacts Of Edge Analytics Infographics Pdf This layout presents information on Reduced Latency, Improved Security, Increased Scalability It is also available for immediate download and adjustment. So, changes can be made in the color, design, graphics or any other component to create a unique layout.

Challenges Of Improving First Contact Resolution Infographics Pdf
The following slide highlight complex IVR, long hold times, insufficient information, high agent turnover and lack of agent authority to show challenges of improving first call resolution. It helps organizations to identify and understand challenges face in improving first call resolution.Pitch your topic with ease and precision using this Challenges Of Improving First Contact Resolution Infographics Pdf This layout presents information on Resolve Complex, Customer Issues, Impact Service It is also available for immediate download and adjustment. So, changes can be made in the color, design, graphics or any other component to create a unique layout.
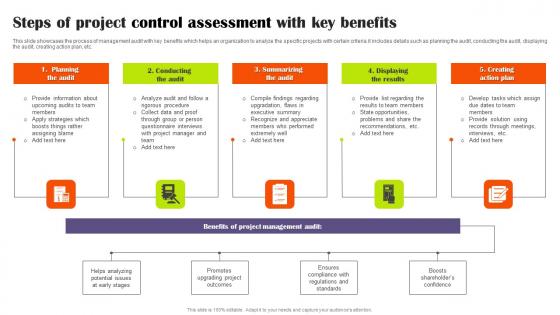
Steps Of Project Control Assessment With Key Benefits Infographics Pdf
This slide showcases the process of management audit with key benefits which helps an organization to analyze the specific projects with certain criteria.it includes details such as planning the audit, conducting the audit, displaying the audit, creating action plan, etc. Showcasing this set of slides titled Steps Of Project Control Assessment With Key Benefits Infographics Pdf The topics addressed in these templates are Planning The Audit, Conducting The Audit, Summarizing The Audit All the content presented in this PPT design is completely editable. Download it and make adjustments in color, background, font etc. as per your unique business setting.

Employee Training Status Report With Activities Infographics PDF
This slide presents the training progress report that records the time involved in completing specific training activities that enables the manager to analyze reasons for the delay. It includes elements such as training activities, employee name, responsible, status, etc. Pitch your topic with ease and precision using this Employee Training Status Report With Activities Infographics PDF. This layout presents information on Team Building Exercise, Customer Experience Optimization, Product Management. It is also available for immediate download and adjustment. So, changes can be made in the color, design, graphics or any other component to create a unique layout.
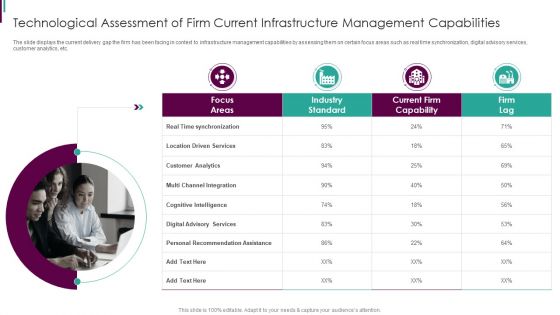
Developing Business Analytics Framework Technological Assessment Infographics PDF
The slide displays the current delivery gap the firm has been facing in context to infrastructure management capabilities by assessing them on certain focus areas such as real time synchronization, digital advisory services, customer analytics, etc.This is a Developing Business Analytics Framework Technological Assessment Infographics PDF template with various stages. Focus and dispense information on four stages using this creative set, that comes with editable features. It contains large content boxes to add your information on topics like Industry Standard, Current Capability, Recommendation You can also showcase facts, figures, and other relevant content using this PPT layout. Grab it now.

Strategic Communication Plan For Brand Marketing Infographics PDF
The slide illustrates a communication plan to effectively manage brand advertising strategy. Various strategies included are social media advertising, pay-per-click advertisement, open contest advertising, sponsorship ads, etc.Pitch your topic with ease and precision using this Strategic Communication Plan For Brand Marketing Infographics PDF. This layout presents information on Boost Engagement, Brand Development, Brand Awareness. It is also available for immediate download and adjustment. So, changes can be made in the color, design, graphics or any other component to create a unique layout.
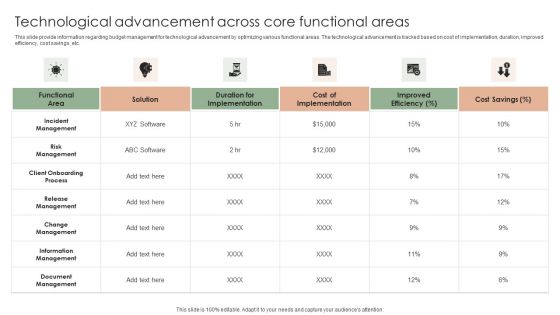
Implementing Effective Strategy Technological Advancement Across Core Functional Infographics PDF
This slide provide information regarding budget management for technological advancement by optimizing various functional areas. The technological advancement is tracked based on cost of implementation, duration, improved efficiency, cost savings, etc. Want to ace your presentation in front of a live audience Our Implementing Effective Strategy Technological Advancement Across Core Functional Infographics PDF can help you do that by engaging all the users towards you.. Slidegeeks experts have put their efforts and expertise into creating these impeccable powerpoint presentations so that you can communicate your ideas clearly. Moreover, all the templates are customizable, and easy-to-edit and downloadable. Use these for both personal and commercial use.

Business Partnership Strategy Scheme Ppt Infographics Portrait PDF
This slide covers the partners management framework which has classified on assessed criticality, risk and complexity along with business reviews, cross functional reviews and operational meetings. Presenting business partnership strategy scheme ppt infographics portrait pdf to provide visual cues and insights. Share and navigate important information on three stages that need your due attention. This template can be used to pitch topics like process, activities, methods. In addtion, this PPT design contains high resolution images, graphics, etc, that are easily editable and available for immediate download.

Checklist To Monitor IT Infrastructure Functional Areas Infographics PDF
This slide provides information regarding the checklist to monitor IT infrastructure focus areas. The assessment checklist defines key activities for effective infrastructure management in terms of data and cloud storage, hardware and software capabilities, etc. There are so many reasons you need a Checklist To Monitor IT Infrastructure Functional Areas Infographics PDF. The first reason is you can not spend time making everything from scratch, Thus, Slidegeeks has made presentation templates for you too. You can easily download these templates from our website easily.

Introduction To Cloud Storage Ppt Infographics Examples PDF
This slide depicts the introduction to cloud storage, including its features such as being cost effective, flexible, available, and its management by third party vendors. This is a introduction to cloud storage ppt infographics examples pdf template with various stages. Focus and dispense information on four stages using this creative set, that comes with editable features. It contains large content boxes to add your information on topics like internet, information, networks. You can also showcase facts, figures, and other relevant content using this PPT layout. Grab it now.
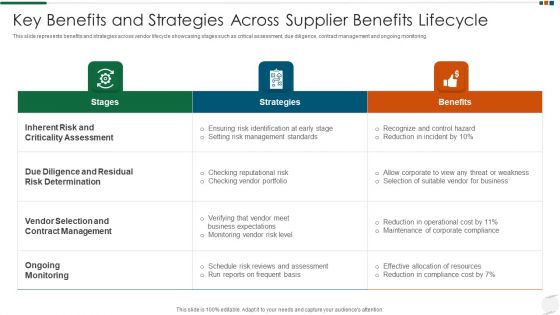
Key Benefits And Strategies Across Supplier Benefits Lifecycle Infographics PDF
Pitch your topic with ease and precision using this key benefits and strategies across supplier benefits lifecycle infographics pdf. This layout presents information on management, risk, strategies. It is also available for immediate download and adjustment. So, changes can be made in the color, design, graphics or any other component to create a unique layout.
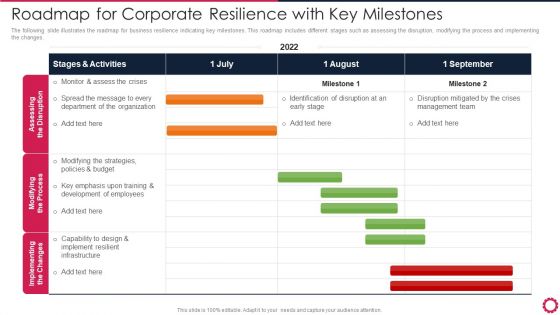
Roadmap For Corporate Resilience With Key Milestones Infographics PDF
The following slide illustrates the roadmap for business resilience indicating key milestones. This roadmap includes different stages such as assessing the disruption, modifying the process and implementing the changes. Pitch your topic with ease and precision using this Roadmap For Corporate Resilience With Key Milestones Infographics PDF. This layout presents information on Implementing The Changes, Modifying The Process, Assessing The Disruption. It is also available for immediate download and adjustment. So, changes can be made in the color, design, graphics or any other component to create a unique layout.

Process Flow To Build Medical Strategy Infographics PDF
The following slide delineates process flow to build a successful medical strategy. It provides information about medical evaluation plan, risk management, pre-medical testing, mechanical and electrical testing, etc.Pitch your topic with ease and precision using this Process Flow To Build Medical Strategy Infographics PDF. This layout presents information on Risk Management, Medical Evaluation, Sufficient Medical. It is also available for immediate download and adjustment. So, changes can be made in the color, design, graphics or any other component to create a unique layout.
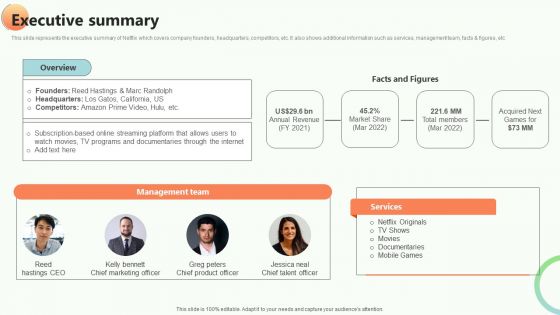
Online Video Content Provider Business Profile Executive Summary Infographics PDF
This slide represents the executive summary of Netflix which covers company founders, headquarters, competitors, etc. It also shows additional information such as services, management team, facts and figures, etc Get a simple yet stunning designed Online Video Content Provider Business Profile Executive Summary Infographics PDF. It is the best one to establish the tone in your meetings. It is an excellent way to make your presentations highly effective. So, download this PPT today from Slidegeeks and see the positive impacts. Our easy to edit Online Video Content Provider Business Profile Executive Summary Infographics PDF can be your go to option for all upcoming conferences and meetings. So, what are you waiting for Grab this template today.

5ws Of Advertising Communication Plan To Boost Sales Infographics Pdf
This slide illustrates the five ws of digital marketing communication planning to generate brand awareness in market. It includes elements such as location, gender, life long warranty, publish content , market share etc. Pitch your topic with ease and precision using this 5ws Of Advertising Communication Plan To Boost Sales Infographics Pdf. This layout presents information on Provides Feedback, Business Analyst, Stores Location. It is also available for immediate download and adjustment. So, changes can be made in the color, design, graphics or any other component to create a unique layout.
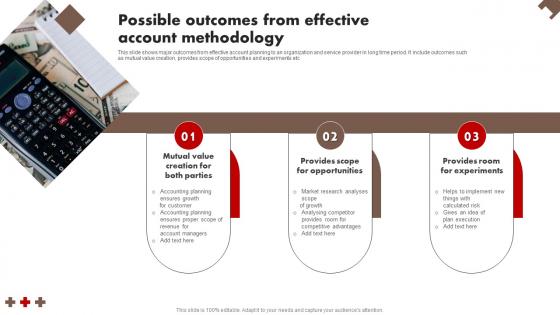
Possible Outcomes From Effective Account Methodology Infographics Pdf
This slide shows major outcomes from effective account planning to an organization and service provider in long time period. It include outcomes such as mutual value creation, provides scope of opportunities and experiments etc Pitch your topic with ease and precision using this Possible Outcomes From Effective Account Methodology Infographics Pdf This layout presents information on Mutual Value, Provides Scope For Opportunities, Provides Room It is also available for immediate download and adjustment. So, changes can be made in the color, design, graphics or any other component to create a unique layout.
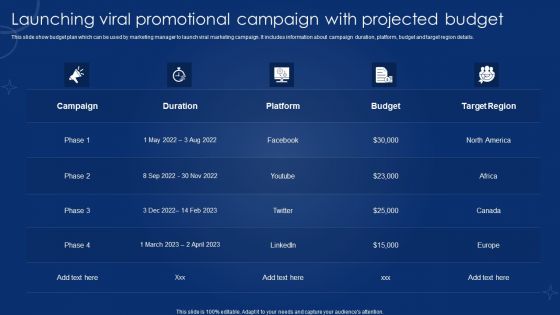
Launching Viral Promotional Campaign With Projected Budget Infographics PDF
This slide show budget plan which can be used by marketing manager to launch viral marketing campaign. It includes information about campaign duration, platform, budget and target region details. Pitch your topic with ease and precision using this Launching Viral Promotional Campaign With Projected Budget Infographics PDF. This layout presents information on Campaign, Duration, Platform, Budget, Target Region. It is also available for immediate download and adjustment. So, changes can be made in the color, design, graphics or any other component to create a unique layout.

Business Milestones Budget Guide Plan Ppt Infographics Pictures PDF
The slide communicated a guide plan of business milestones to measure the progress toward the ultimate goal. It shows tasks, start and end date, cost, manager and department. Pitch your topic with ease and precision using this Business Milestones Budget Guide Plan Ppt Infographics Pictures PDF. This layout presents information on Corporate Identity, Seminar Implementation, Business Plan Review. It is also available for immediate download and adjustment. So, changes can be made in the color, design, graphics or any other component to create a unique layout.

Project Communication Program In A Software Development Firm Infographics Pdf
The slide showcases communication plan opted by managers in a software development firm that assists in frequent and active task reporting among the project team members. The elements are communication purpose, method used, frequency, goal, owners, audience. Pitch your topic with ease and precision using this Project Communication Program In A Software Development Firm Infographics Pdf. This layout presents information on Project Communication Program, Software Development Firm, Communication Purpose. It is also available for immediate download and adjustment. So, changes can be made in the color, design, graphics or any other component to create a unique layout.
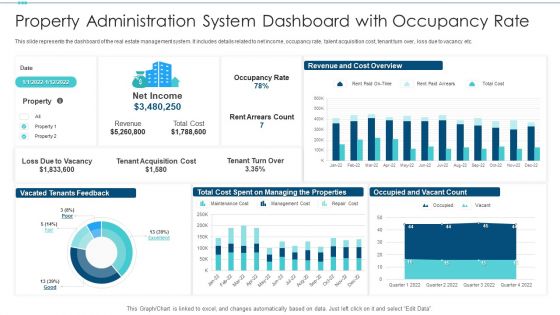
Property Administration System Dashboard With Occupancy Rate Infographics PDF
Pitch your topic with ease and precision using this property administration system dashboard with occupancy rate infographics pdf. This layout presents information on revenue, cost, occupancy rate. It is also available for immediate download and adjustment. So, changes can be made in the color, design, graphics or any other component to create a unique layout.

Progress Summary Dashboard For Monitoring Project Kpis Infographics PDF
The following slide showcases progress reporting dashboard for clients to stay informed about changes, schedules and budgets. It presents information related to work items, tasks late, issues red, etc. Pitch your topic with ease and precision using this Progress Summary Dashboard For Monitoring Project Kpis Infographics PDF. This layout presents information on Project Status, Project Manager, Project Type, Percent Complete. It is also available for immediate download and adjustment. So, changes can be made in the color, design, graphics or any other component to create a unique layout.
Organization Data Breach Incident Communication Strategy Icon Infographics PDF
Pitch your topic with ease and precision using this Organization Data Breach Incident Communication Strategy Icon Infographics PDF. This layout presents information on Organization Data, Breach Incident, Communication Strategy. It is also available for immediate download and adjustment. So, changes can be made in the color, design, graphics or any other component to create a unique layout.
Corporate Pillars Of Business Sustainability Framework Icon Infographics PDF
Pitch your topic with ease and precision using this Corporate Pillars Of Business Sustainability Framework Icon Infographics PDF. This layout presents information on Corporate Pillars Of Business, Sustainability Framework Icon. It is also available for immediate download and adjustment. So, changes can be made in the color, design, graphics or any other component to create a unique layout.

Assessment Matrix For Analyzing Company Position Infographics PDF
Pitch your topic with ease and precision using this Assessment Matrix For Analyzing Company Position Infographics PDF. This layout presents information on Production Costs, Purchase Order, Evaluation Criteria. It is also available for immediate download and adjustment. So, changes can be made in the color, design, graphics or any other component to create a unique layout.
Software Lifecycle Governance With Project Tracking Infographics PDF
Pitch your topic with ease and precision using this Software Lifecycle Governance With Project Tracking Infographics PDF. This layout presents information on Create, Select, Plan. It is also available for immediate download and adjustment. So, changes can be made in the color, design, graphics or any other component to create a unique layout.
Procurement Transition Leading To Business Transformation Icon Infographics PDF
Pitch your topic with ease and precision using this Procurement Transition Leading To Business Transformation Icon Infographics PDF This layout presents information on Procurement Transition, Leading Business, Transformation Icon It is also available for immediate download and adjustment. So, changes can be made in the color, design, graphics or any other component to create a unique layout.
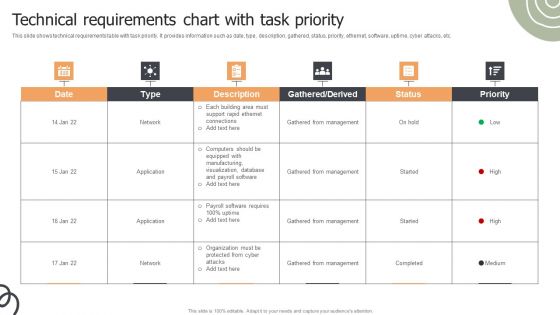
Technical Requirements Chart With Task Priority Ppt Infographics Styles PDF
This slide shows technical requirements table with task priority. It provides information such as date, type, description, gathered, status, priority, ethernet, software, uptime, cyber attacks, etc. Pitch your topic with ease and precision using this Technical Requirements Chart With Task Priority Ppt Infographics Styles PDF. This layout presents information on Gathered From Management, Network, Application. It is also available for immediate download and adjustment. So, changes can be made in the color, design, graphics or any other component to create a unique layout.
Professional Hiring Procedure Icon To Hire Right Talent Infographics PDF
Pitch your topic with ease and precision using this Professional Hiring Procedure Icon To Hire Right Talent Infographics PDF. This layout presents information on Professional Hiring, Procedure Icon, Hire Right Talent. It is also available for immediate download and adjustment. So, changes can be made in the color, design, graphics or any other component to create a unique layout.

Common Metaverse Marketing Trends For Business Entity Infographics Pdf
Pitch your topic with ease and precision using this Common Metaverse Marketing Trends For Business Entity Infographics Pdf This layout presents information on Personalized Experience, Virtual Storefronts, Immersive Experience It is also available for immediate download and adjustment. So, changes can be made in the color, design, graphics or any other component to create a unique layout.
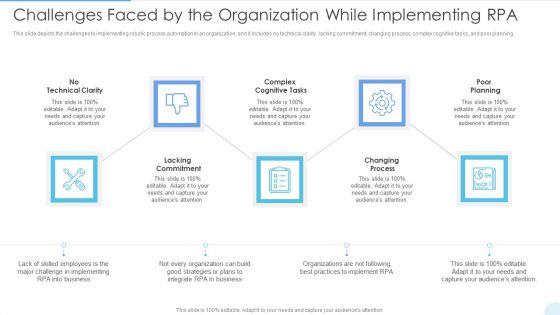
Challenges Faced By The Organization While Implementing Rpa Infographics PDF
This slide depicts the challenges to implementing robotic process automation in an organization, and it includes no technical clarity, lacking commitment, changing process, complex cognitive tasks, and poor planning. This is a Challenges Faced By The Organization While Implementing Rpa Infographics PDF template with various stages. Focus and dispense information on five stages using this creative set, that comes with editable features. It contains large content boxes to add your information on topics like Lacking Commitment, Complex Cognitive Tasks, Changing Process. You can also showcase facts, figures, and other relevant content using this PPT layout. Grab it now.
Website Leads Tracking Dashboard With Traffic Sources Infographics PDF
This slide showcases dashboard for lead generation that can help organziation to identify the traffic sources plus visitors and make changes in SEO of website. It also showcases key metrics that are bounce rate by week, visitors by user type, top channels by conversion, top campaign by conversion and top pages by conversion. Pitch your topic with ease and precision using this Website Leads Tracking Dashboard With Traffic Sources Infographics PDF. This layout presents information on Visitors User Type, Traffic Sources, Bounce Rate Week. It is also available for immediate download and adjustment. So, changes can be made in the color, design, graphics or any other component to create a unique layout.

Construction Quality Control Administration One Year Plan Infographics PDF
This slide provides report on quality control to ensure non-slippery construction. It includes Dimensional inspection, welding inspection, equipment inspection etc.Pitch your topic with ease and precision using this Construction Quality Control Administration One Year Plan Infographics PDF This layout presents information on Welding Completed, Checked Equipment, Ultrasonic Inspection It is also available for immediate download and adjustment. So, changes can be made in the color, design, graphics or any other component to create a unique layout.
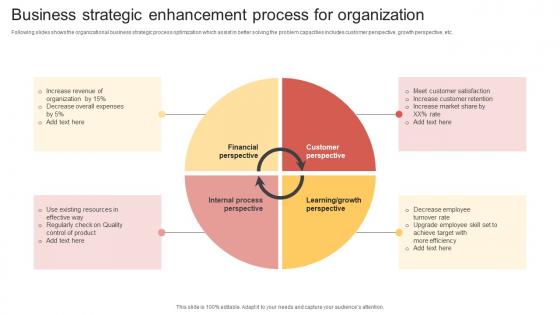
Business Strategic Enhancement Process For Organization Infographics Pdf
Following slides shows the organizational business strategic process optimization which assist in better solving the problem capacities includes customer perspective, growth perspective, etc. Pitch your topic with ease and precision using this Business Strategic Enhancement Process For Organization Infographics Pdf. This layout presents information on Financial Perspective, Customer Perspective, Growth Perspective. It is also available for immediate download and adjustment. So, changes can be made in the color, design, graphics or any other component to create a unique layout.
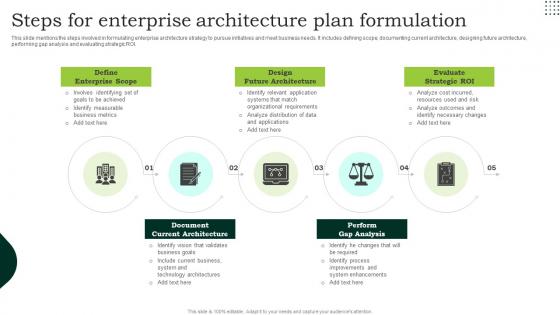
Steps For Enterprise Architecture Plan Formulation Infographics Pdf
This slide mentions the steps involved in formulating enterprise architecture strategy to pursue initiatives and meet business needs. It includes defining scope, documenting current architecture, designing future architecture, performing gap analysis and evaluating strategic ROI. Showcasing this set of slides titled Steps For Enterprise Architecture Plan Formulation Infographics Pdf. The topics addressed in these templates are Define Enterprise Scope, Design Future Architecture, Evaluate Strategic Roi. All the content presented in this PPT design is completely editable. Download it and make adjustments in color, background, font etc. as per your unique business setting.

Project Transition Plan And Closure Process Infographics PDF
This slide covers project transition plan and closure process which include service architect and project manager. Pitch your topic with ease and precision using this Project Transition Plan And Closure Process Infographics PDF. This layout presents information on Service Requirement, Deployment, System Requirements. It is also available for immediate download and adjustment. So, changes can be made in the color, design, graphics or any other component to create a unique layout.
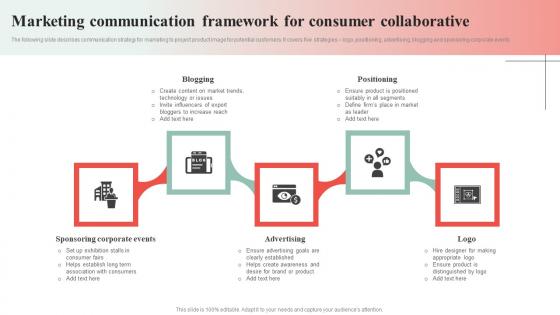
Marketing Communication Framework For Consumer Collaborative Infographics Pdf
The following slide describes communication strategy for marketing to project product image for potential customers. It covers five strategies logo, positioning, advertising, blogging and sponsoring corporate events Pitch your topic with ease and precision using this Marketing Communication Framework For Consumer Collaborative Infographics Pdf This layout presents information on Sponsoring Corporate Events, Advertising, Positioning It is also available for immediate download and adjustment. So, changes can be made in the color, design, graphics or any other component to create a unique layout.
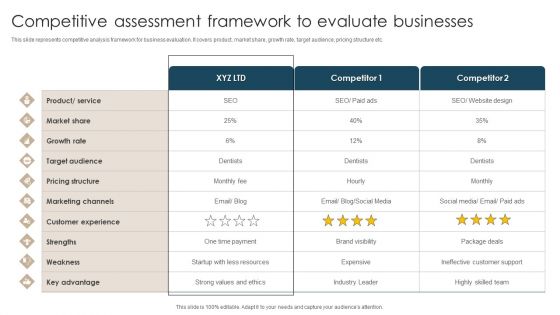
Competitive Assessment Framework To Evaluate Businesses Infographics PDF
This slide represents competitive analysis framework for business evaluation. It covers product, market share, growth rate, target audience, pricing structure etc. Pitch your topic with ease and precision using this Competitive Assessment Framework To Evaluate Businesses Infographics PDF. This layout presents information on Target Audience, Growth Rate, Market Share. It is also available for immediate download and adjustment. So, changes can be made in the color, design, graphics or any other component to create a unique layout.
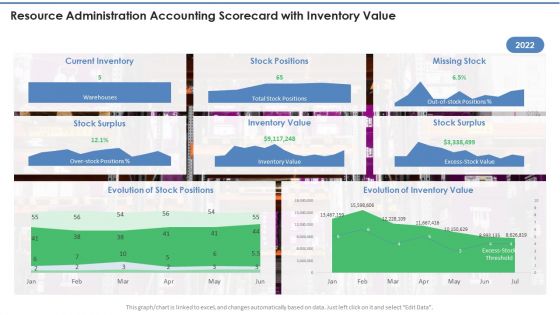
Resource Administration Accounting Scorecard With Inventory Value Infographics PDF
This graph or chart is linked to excel, and changes automatically based on data. Just left click on it and select Edit Data. Deliver and pitch your topic in the best possible manner with this Resource Administration Accounting Scorecard With Inventory Value Infographics PDF. Use them to share invaluable insights on Current Inventory, Stock Positions, Missing Stock and impress your audience. This template can be altered and modified as per your expectations. So, grab it now.
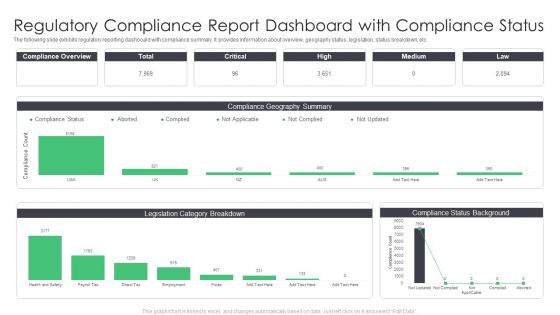
Regulatory Compliance Report Dashboard With Compliance Status Infographics PDF
The following slide exhibits regulatory reporting dashboard with compliance summary. It provides information about overview, geography status, legislation, status breakdown, etc. Pitch your topic with ease and precision using this Regulatory Compliance Report Dashboard With Compliance Status Infographics PDF. This layout presents information on Dashboard With Compliance Status, Regulatory Compliance Report. It is also available for immediate download and adjustment. So, changes can be made in the color, design, graphics or any other component to create a unique layout.
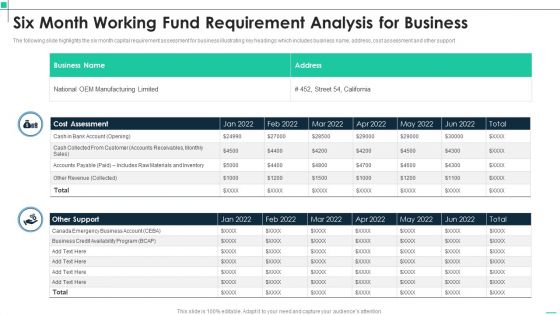
Six Month Working Fund Requirement Analysis For Business Infographics PDF
The following slide highlights the six month capital requirement assessment for business illustrating key headings which includes business name, address, cost assessment and other support. Pitch your topic with ease and precision using this Six Month Working Fund Requirement Analysis For Business Infographics PDF. This layout presents information on Cost Assessment, Accounts Payable, Raw Materials. It is also available for immediate download and adjustment. So, changes can be made in the color, design, graphics or any other component to create a unique layout.
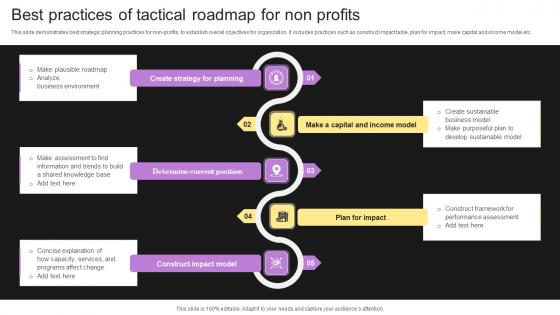
Best Practices Of Tactical Roadmap For Non Profits Infographics Pdf
This slide demonstrates best strategic planning practices for non profits, to establish overall objectives for organization. It includes practices such as construct impact table, plan for impact, make capital and income model etc.Showcasing this set of slides titled Best Practices Of Tactical Roadmap For Non Profits Infographics Pdf The topics addressed in these templates are Determine Current Position, Construct Impact Model, Performance Assessment All the content presented in this PPT design is completely editable. Download it and make adjustments in color, background, font etc. as per your unique business setting.
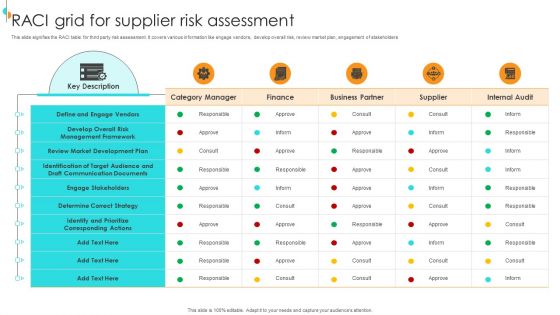
RACI Grid For Supplier Risk Assessment Infographics PDF
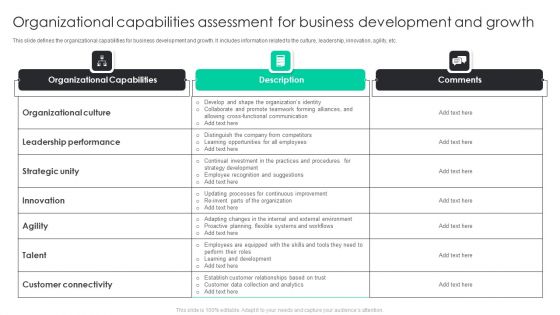
Organizational Capabilities Assessment For Business Development And Growth Infographics PDF
This slide defines the organizational capabilities for business development and growth. It includes information related to the culture, leadership, innovation, agility, etc.Pitch your topic with ease and precision using this Organizational Capabilities Assessment For Business Development And Growth Infographics PDF. This layout presents information on Leadership Performance, Organizational Culture, Functional Communication. It is also available for immediate download and adjustment. So, changes can be made in the color, design, graphics or any other component to create a unique layout.

Competitive Assessment Of Various Digital Platforms Infographics PDF
This slide represents competitor analysis for digital platforms. It covers product features, core competency, pricing, support etc. that enables business to analyze their competitors. Pitch your topic with ease and precision using this Competitive Assessment Of Various Digital Platforms Infographics PDF. This layout presents information on Optimization, E Commerce, Pricing. It is also available for immediate download and adjustment. So, changes can be made in the color, design, graphics or any other component to create a unique layout.
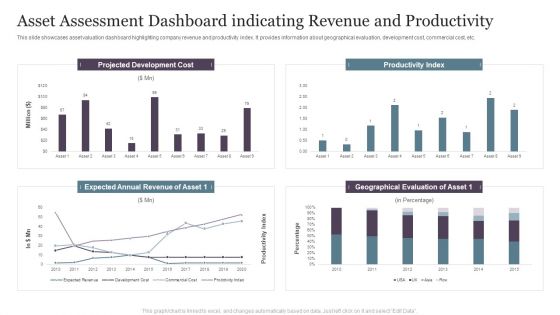
Asset Assessment Dashboard Indicating Revenue And Productivity Infographics PDF
This slide showcases asset valuation dashboard highlighting company revenue and productivity index. It provides information about geographical evaluation, development cost, commercial cost, etc.Pitch your topic with ease and precision using this Asset Assessment Dashboard Indicating Revenue And Productivity Infographics PDF. This layout presents information on Projected Development, Productivity Index, Geographical Evaluation. It is also available for immediate download and adjustment. So, changes can be made in the color, design, graphics or any other component to create a unique layout.

Optimizing Performance Of Analyzation Of Business Processes Infographics PDF
The following slide highlights business process review performance optimization. It includes element such as assess, baseline, analyze, prioritize, plan and do. Pitch your topic with ease and precision using this Optimizing Performance Of Analyzation Of Business Processes Infographics PDF. This layout presents information on Plan, Prioritize, Analyze. It is also available for immediate download and adjustment. So, changes can be made in the color, design, graphics or any other component to create a unique layout.

Data And Analytics Procedure Evaluation Checklist Infographics PDF
This slide showcases a checklist of data and analytics process to find current trends and improve performance. The KPIs involved in this are cost, performance scalability, and modernization. Pitch your topic with ease and precision using this Data And Analytics Procedure Evaluation Checklist Infographics PDF. This layout presents information on Particulars, Owner, Deadline. It is also available for immediate download and adjustment. So, changes can be made in the color, design, graphics or any other component to create a unique layout.
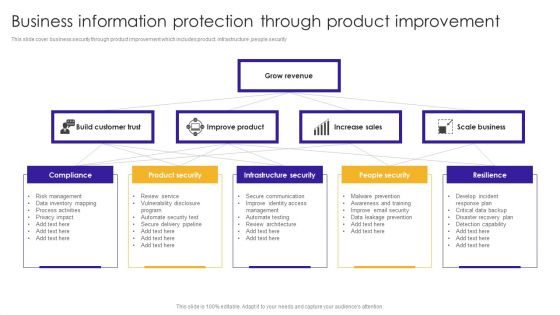
Business Information Protection Through Product Improvement Infographics PDF
This slide cover business security through product improvement which includes product, infrastructure ,people security. Pitch your topic with ease and precision using this Business Information Protection Through Product Improvement Infographics PDF. This layout presents information on Improve Product, Scale Business, Infrastructure Security. It is also available for immediate download and adjustment. So, changes can be made in the color, design, graphics or any other component to create a unique layout.
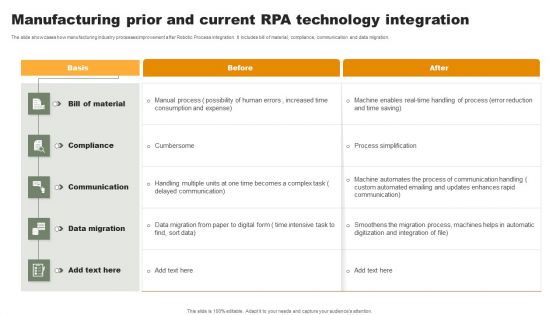
Manufacturing Prior And Current Rpa Technology Integration Infographics PDF
The slide showcases how manufacturing industry processes improvement after Robotic Process integration. It includes bill of material, compliance, communication and data migration. Pitch your topic with ease and precision using this Manufacturing Prior And Current Rpa Technology Integration Infographics PDF. This layout presents information on Communication, Data Migration, Material. It is also available for immediate download and adjustment. So, changes can be made in the color, design, graphics or any other component to create a unique layout.
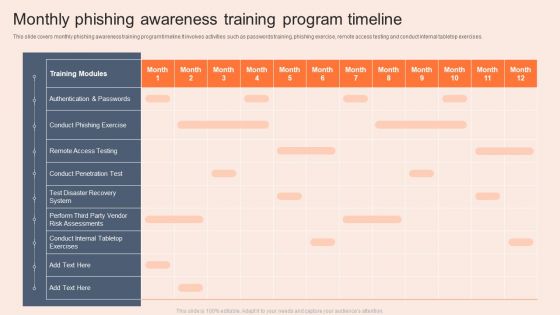
Monthly Phishing Awareness Training Program Timeline Infographics PDF
This slide covers monthly phishing awareness training program timeline.It involves activities such as passwords training, phishing exercise, remote access testing and conduct internal tabletop exercises. Pitch your topic with ease and precision using this Monthly Phishing Awareness Training Program Timeline Infographics PDF. This layout presents information on Risk Assessments, System, Awareness Training Program Timeline. It is also available for immediate download and adjustment. So, changes can be made in the color, design, graphics or any other component to create a unique layout.
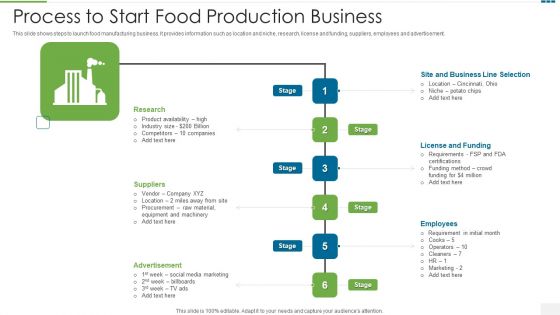
Process To Start Food Production Business Infographics PDF
This slide shows steps to launch food manufacturing business. It provides information such as location and niche, research, license and funding, suppliers, employees and advertisement.Pitch your topic with ease and precision using this process to start food production business infographics pdf This layout presents information on license and funding, employees, advertisement It is also available for immediate download and adjustment. So, changes can be made in the color, design, graphics or any other component to create a unique layout.

 Home
Home