Analytics
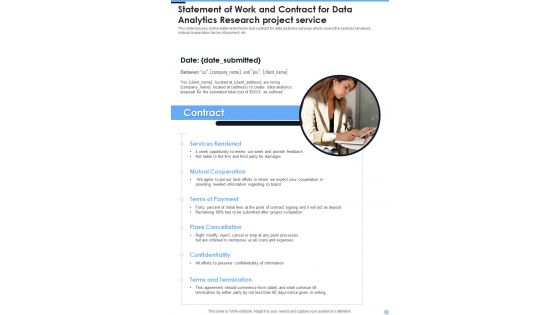
Statement Of Work And Contract For Data Analytics Research Project Service One Pager Sample Example Document
Presenting you an exemplary Statement Of Work And Contract For Data Analytics Research Project Service One Pager Sample Example Document. Our one-pager comprises all the must-have essentials of an inclusive document. You can edit it with ease, as its layout is completely editable. With such freedom, you can tweak its design and other elements to your requirements. Download this Statement Of Work And Contract For Data Analytics Research Project Service One Pager Sample Example Document brilliant piece now.
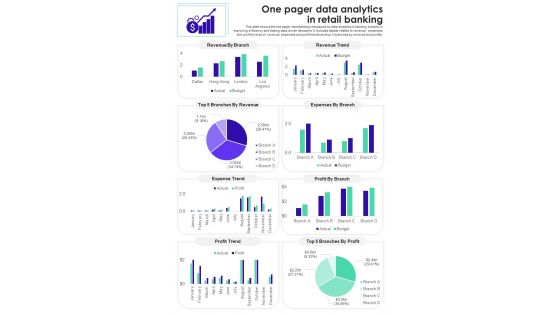
One Pager Data Analytics In Retail Banking PDF Document PPT Template
Heres a predesigned One Pager Data Analytics In Retail Banking PDF Document PPT Template for you. Built on extensive research and analysis, this one-pager template has all the centerpieces of your specific requirements. This temple exudes brilliance and professionalism. Being completely editable, you can make changes to suit your purpose. Get this One Pager Data Analytics In Retail Banking PDF Document PPT Template Download now.

One Page Yearly Summary For Marketing Analytics PDF Document PPT Template
Heres a predesigned One Page Yearly Summary For Marketing Analytics PDF Document PPT Template for you. Built on extensive research and analysis, this one-pager template has all the centerpieces of your specific requirements. This temple exudes brilliance and professionalism. Being completely editable, you can make changes to suit your purpose. Get this One Page Yearly Summary For Marketing Analytics PDF Document PPT Template Download now.
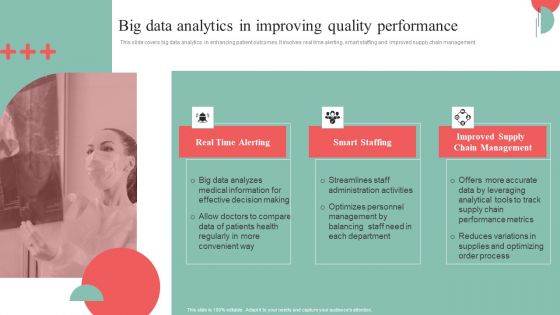
Incorporating HIS To Enhance Healthcare Services Big Data Analytics In Improving Quality Performance Microsoft PDF
This slide covers big data analytics in enhancing patient outcomes. It involves real time alerting, smart staffing and improved supply chain management. There are so many reasons you need a Incorporating HIS To Enhance Healthcare Services Big Data Analytics In Improving Quality Performance Microsoft PDF. The first reason is you cannot spend time making everything from scratch, Thus, Slidegeeks has made presentation templates for you too. You can easily download these templates from our website easily.

Modern Analytics Infrastructure Framework For Effective Information Supply Chain Brochure PDF
The following slide exhibits a modern and integrated analytics ecosystem for data preparation and management. It includes elements such as sources, data management, applications, and process. Showcasing this set of slides titled Modern Analytics Infrastructure Framework For Effective Information Supply Chain Brochure PDF. The topics addressed in these templates are Sources, Data Management, Applications. All the content presented in this PPT design is completely editable. Download it and make adjustments in color, background, font etc. as per your unique business setting.
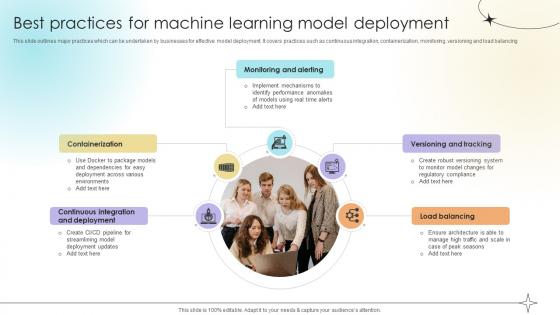
Best Practices For Machine Learning Model Deployment Data Analytics SS V
This slide outlines major practices which can be undertaken by businesses for effective model deployment. It covers practices such as continuous integration, containerization, monitoring, versioning and load balancing.This Best Practices For Machine Learning Model Deployment Data Analytics SS V is perfect for any presentation, be it in front of clients or colleagues. It is a versatile and stylish solution for organizing your meetings. The Best Practices For Machine Learning Model Deployment Data Analytics SS V features a modern design for your presentation meetings. The adjustable and customizable slides provide unlimited possibilities for acing up your presentation. Slidegeeks has done all the homework before launching the product for you. So, do not wait, grab the presentation templates today

Step 3 Analyse Trends In Product Demand And Supply Data Analytics SS V
This slide provides trends in product demand and supply highlighting errors in inventory management. It covers a graph showing trends in demand and supply levels with key insights on potential issues.Formulating a presentation can take up a lot of effort and time, so the content and message should always be the primary focus. The visuals of the PowerPoint can enhance the presenters message, so our Step 3 Analyse Trends In Product Demand And Supply Data Analytics SS V was created to help save time. Instead of worrying about the design, the presenter can concentrate on the message while our designers work on creating the ideal templates for whatever situation is needed. Slidegeeks has experts for everything from amazing designs to valuable content, we have put everything into Step 3 Analyse Trends In Product Demand And Supply Data Analytics SS V.

Use Cases Of Genetic Algorithms In Various Domains Data Analytics SS V
This slide outlines major applications of genetic algorithms aimed at exploring and optimizing decision making strategies. It covers applications in areas such as optimization problems, machine learning, image and signal processing, combinatorial optimization and robotics.Are you searching for a Use Cases Of Genetic Algorithms In Various Domains Data Analytics SS V that is uncluttered, straightforward, and original Its easy to edit, and you can change the colors to suit your personal or business branding. For a presentation that expresses how much effort you have put in, this template is ideal With all of its features, including tables, diagrams, statistics, and lists, its perfect for a business plan presentation. Make your ideas more appealing with these professional slides. Download Use Cases Of Genetic Algorithms In Various Domains Data Analytics SS V from Slidegeeks today.

Most Critical Vs Of Big Data Analytics Advanced Tools For Hyperautomation Ppt Summary Rules Pdf
This slide represents the most critical Vs of big data, such as volume, variety, velocity, veracity, value, and variability and how they work. Each of these Vs describes the feature of big data where volume represents the amount of collected information, variety tells the data type, and so on. Slidegeeks is one of the best resources for PowerPoint templates. You can download easily and regulate Most Critical Vs Of Big Data Analytics Advanced Tools For Hyperautomation Ppt Summary Rules Pdf for your personal presentations from our wonderful collection. A few clicks is all it takes to discover and get the most relevant and appropriate templates. Use our Templates to add a unique zing and appeal to your presentation and meetings. All the slides are easy to edit and you can use them even for advertisement purposes.
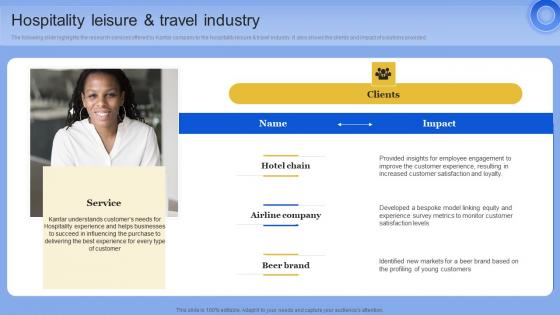
Hospitality Leisure And Travel Industry Data Analytics Company Outline Slides PDF
The following slide highlights the research services offered by Kantar company to the hospitality leisure and travel industry. It also shows the clients and impact of solutions providedWelcome to our selection of the Hospitality Leisure And Travel Industry Data Analytics Company Outline Slides PDF These are designed to help you showcase your creativity and bring your sphere to life. Planning and Innovation are essential for any business that is just starting out. This collection contains the designs that you need for your everyday presentations. All of our PowerPoints are 100 percent editable, so you can customize them to suit your needs. This multi-purpose template can be used in various situations. Grab these presentation templates today
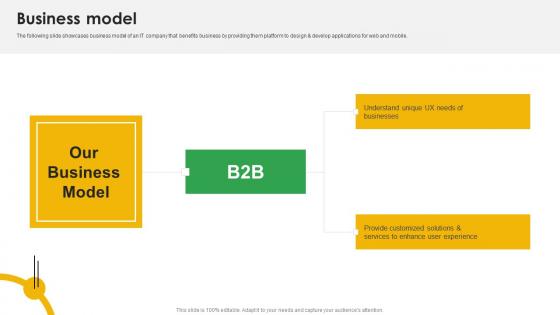
Business Model Mobile App Analytics Company Fund Raising Pitch Deck Formats Pdf
The following slide showcases business model of an IT company that benefits business by providing them platform to design and develop applications for web and mobile. Retrieve professionally designed Business Model Mobile App Analytics Company Fund Raising Pitch Deck Formats Pdf to effectively convey your message and captivate your listeners. Save time by selecting pre made slideshows that are appropriate for various topics, from business to educational purposes. These themes come in many different styles, from creative to corporate, and all of them are easily adjustable and can be edited quickly. Access them as PowerPoint templates or as Google Slides themes. You do not have to go on a hunt for the perfect presentation because Slidegeeks got you covered from everywhere.
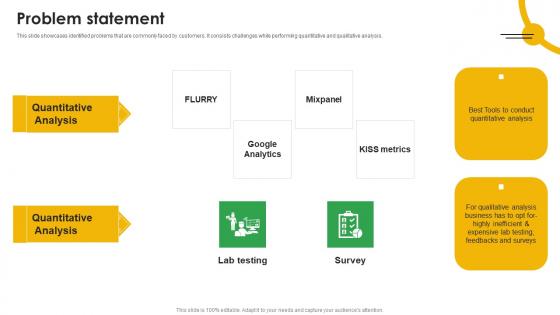
Problem Statement Mobile App Analytics Company Fund Raising Pitch Deck Professional Pdf
This slide showcases identified problems that are commonly faced by customers. It consists challenges while performing quantitative and qualitative analysis. Slidegeeks is here to make your presentations a breeze with Problem Statement Mobile App Analytics Company Fund Raising Pitch Deck Professional Pdf With our easy to use and customizable templates, you can focus on delivering your ideas rather than worrying about formatting. With a variety of designs to choose from, you are sure to find one that suits your needs. And with animations and unique photos, illustrations, and fonts, you can make your presentation pop. So whether you are giving a sales pitch or presenting to the board, make sure to check out Slidegeeks first

Step 5 Employ Looker To Optimize Inventory Levels Data Analytics SS V
This slide explains use of inventory software aimed at helping businesses optimize inventory levels using effective analysis. It covers use of BI solution, vendor portal, hardware, accounting software, customer relationship management and enterprise resource planning.This modern and well-arranged Step 5 Employ Looker To Optimize Inventory Levels Data Analytics SS V provides lots of creative possibilities. It is very simple to customize and edit with the Powerpoint Software. Just drag and drop your pictures into the shapes. All facets of this template can be edited with Powerpoint, no extra software is necessary. Add your own material, put your images in the places assigned for them, adjust the colors, and then you can show your slides to the world, with an animated slide included.

Critical Steps Involved In Statistical Data Analytics For Informed Decision Ppt Presentation
This slide represents the working process of statistical data analysis. The steps involved in performing statistical analysis are data collection, data cleaning, descriptive analysis, inferential analysis, interpretation, etc. Slidegeeks is here to make your presentations a breeze with Critical Steps Involved In Statistical Data Analytics For Informed Decision Ppt Presentation With our easy-to-use and customizable templates, you can focus on delivering your ideas rather than worrying about formatting. With a variety of designs to choose from, you are sure to find one that suits your needs. And with animations and unique photos, illustrations, and fonts, you can make your presentation pop. So whether you are giving a sales pitch or presenting to the board, make sure to check out Slidegeeks first
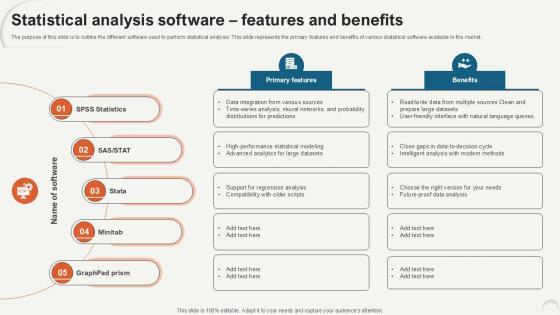
Statistical Analysis Software Features Data Analytics For Informed Decision Ppt Presentation
The purpose of this slide is to outline the different software used to perform statistical analysis. This slide represents the primary features and benefits of various statistical software available in the market. This Statistical Analysis Software Features Data Analytics For Informed Decision Ppt Presentation from Slidegeeks makes it easy to present information on your topic with precision. It provides customization options, so you can make changes to the colors, design, graphics, or any other component to create a unique layout. It is also available for immediate download, so you can begin using it right away. Slidegeeks has done good research to ensure that you have everything you need to make your presentation stand out. Make a name out there for a brilliant performance.
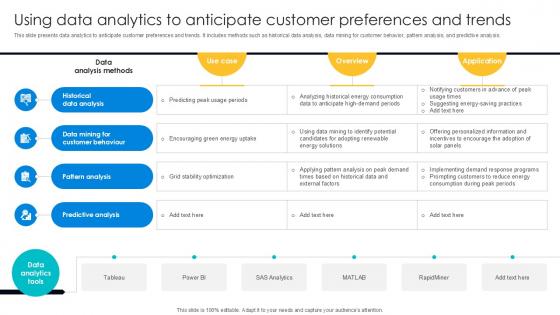
Using Data Analytics To Anticipate Digital Transformation Journey PPT PowerPoint DT SS V
This slide presents data analytics to anticipate customer preferences and trends. It includes methods such as historical data analysis, data mining for customer behavior, pattern analysis, and predictive analysis. Here you can discover an assortment of the finest PowerPoint and Google Slides templates. With these templates, you can create presentations for a variety of purposes while simultaneously providing your audience with an eye-catching visual experience. Download Historical Data Analysis, Data Mining For Customer Behaviour, Pattern Analysis to deliver an impeccable presentation. These templates will make your job of preparing presentations much quicker, yet still, maintain a high level of quality. Slidegeeks has experienced researchers who prepare these templates and write high-quality content for you. Later on, you can personalize the content by editing the Historical Data Analysis, Data Mining For Customer Behaviour, Pattern Analysis.
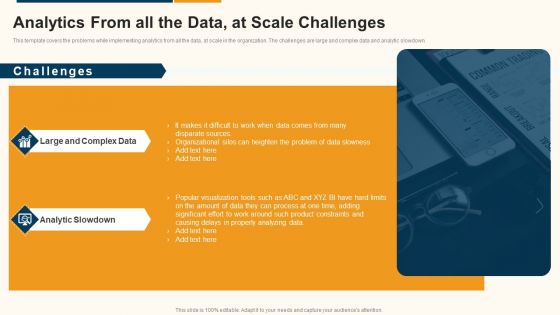
Data Interpretation And Analysis Playbook Analytics From All The Data At Scale Challenges Structure PDF
This template covers the problems while implementing analytics from all the data, at scale in the organization. The challenges are large and complex data and analytic slowdown. This is a data interpretation and analysis playbook analytics from all the data at scale challenges structure pdf template with various stages. Focus and dispense information on two stages using this creative set, that comes with editable features. It contains large content boxes to add your information on topics like large and complex data, analytic slowdown. You can also showcase facts, figures, and other relevant content using this PPT layout. Grab it now.
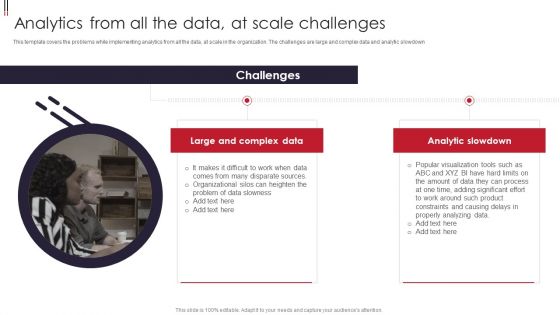
Information Visualizations Playbook Analytics From All The Data At Scale Challenges Structure PDF
This template covers the problems while implementing analytics from all the data, at scale in the organization. The challenges are large and complex data and analytic slowdown. Presenting Information Visualizations Playbook Analytics From All The Data At Scale Challenges Structure PDF to provide visual cues and insights. Share and navigate important information on two stages that need your due attention. This template can be used to pitch topics like Complex Data, Analytic Slowdown. In addtion, this PPT design contains high resolution images, graphics, etc, that are easily editable and available for immediate download.
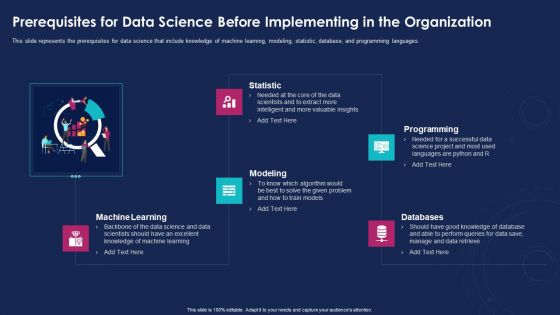
Data Analytics IT Prerequisites For Data Science Before Implementing In The Organization Information PDF
This slide represents the prerequisites for data science that include knowledge of machine learning, modeling, statistic, database, and programming languages. Presenting data analytics it prerequisites for data science before implementing in the organization information pdf to provide visual cues and insights. Share and navigate important information on five stages that need your due attention. This template can be used to pitch topics like machine learning, statistic, modeling, programming, databases. In addtion, this PPT design contains high resolution images, graphics, etc, that are easily editable and available for immediate download.
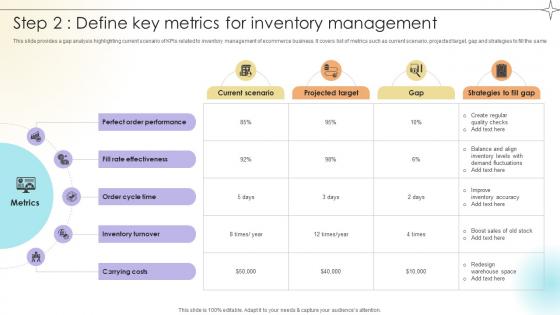
Step 2 Define Key Metrics For Inventory Management Data Analytics SS V
This slide provides a gap analysis highlighting current scenario of KPIs related to inventory management of ecommerce business. It covers list of metrics such as current scenario, projected target, gap and strategies to fill the same.Make sure to capture your audiences attention in your business displays with our gratis customizable Step 2 Define Key Metrics For Inventory Management Data Analytics SS V. These are great for business strategies, office conferences, capital raising or task suggestions. If you desire to acquire more customers for your tech business and ensure they stay satisfied, create your own sales presentation with these plain slides.
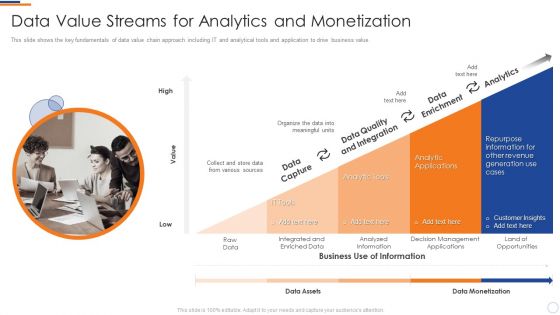
Business Intelligence And Big Data Value Streams For Analytics And Monetization Designs PDF
This slide shows the key fundamentals of data value chain approach including IT and analytical tools and application to drive business value. This is a business intelligence and big data value streams for analytics and monetization designs pdf template with various stages. Focus and dispense information on one stages using this creative set, that comes with editable features. It contains large content boxes to add your information on topics like data capture, data quality and integration, data enrichment, analytics. You can also showcase facts, figures, and other relevant content using this PPT layout. Grab it now.
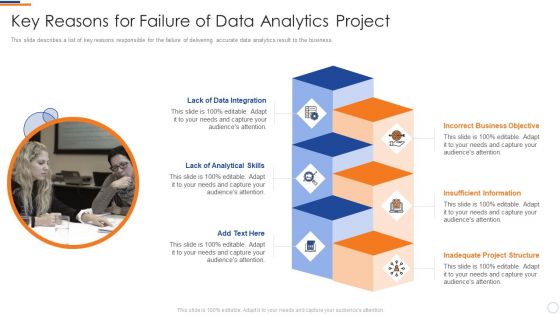
Business Intelligence And Big Key Reasons For Failure Of Data Analytics Project Rules PDF
This slide describes a list of key reasons responsible for the failure of delivering accurate data analytics result to the business. Presenting business intelligence and big key reasons for failure of data analytics project rules pdf to provide visual cues and insights. Share and navigate important information on six stages that need your due attention. This template can be used to pitch topics like lack data integration, lack analytical skills, incorrect business objective, insufficient information, inadequate project structure. In addtion, this PPT design contains high resolution images, graphics, etc, that are easily editable and available for immediate download.
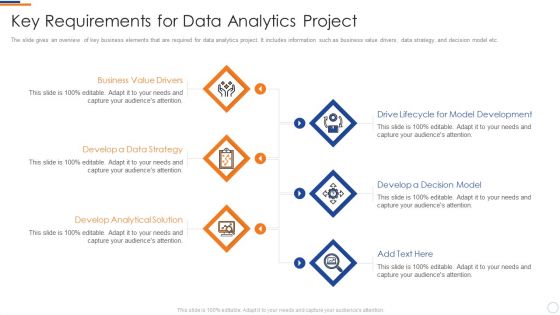
Business Intelligence And Big Key Requirements For Data Analytics Project Brochure PDF
The slide gives an overview of key business elements that are required for data analytics project. It includes information such as business value drivers, data strategy, and decision model etc. This is a business intelligence and big key requirements for data analytics project brochure pdf template with various stages. Focus and dispense information on six stages using this creative set, that comes with editable features. It contains large content boxes to add your information on topics like business value drivers, develop a data strategy, develop analytical solution, develop a decision model. You can also showcase facts, figures, and other relevant content using this PPT layout. Grab it now.

Industry Data Analytics Value Stream Model Business Intelligence And Big Inspiration PDF
This slide shows the data value streams structure that will identify and represent all data sources and methods to transform the ingest information into analytical data for business decision-making. Deliver an awe inspiring pitch with this creative industry data analytics value stream model business intelligence and big inspiration pdf bundle. Topics like data sources, data ecosystem, analytics, intelligence analysis, decision management can be discussed with this completely editable template. It is available for immediate download depending on the needs and requirements of the user.
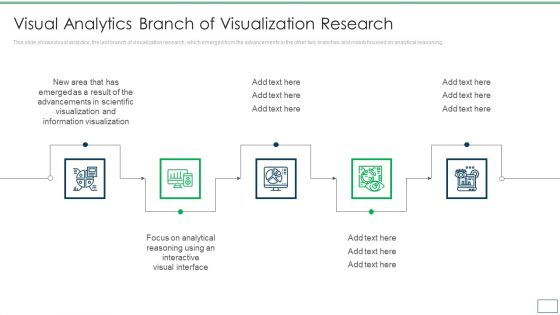
Departments Of Visualization Research Visual Analytics Branch Of Visualization Research Information PDF
This slide shows visual analytics, the last branch of visualization research, which emerged from the advancements in the other two branches and mainly focused on analytical reasoning.Presenting Departments Of Visualization Research Visual Analytics Branch Of Visualization Research Information PDF to provide visual cues and insights. Share and navigate important information on five stages that need your due attention. This template can be used to pitch topics like Information Visualization, Advancements In Scientific, Interactive Visual Interface In addtion, this PPT design contains high resolution images, graphics, etc, that are easily editable and available for immediate download.
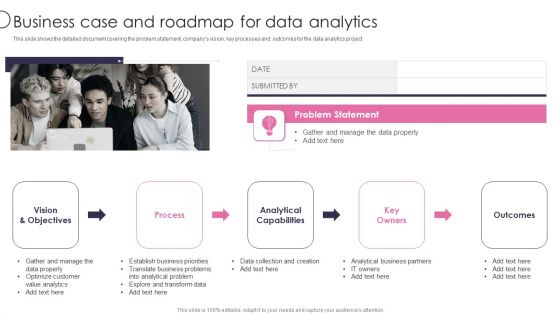
Information Transformation Process Toolkit Business Case And Roadmap For Data Analytics Ideas PDF
This slide shows the detailed document covering the problem statement, companys vision, key processes and outcomes for the data analytics project. This is a Information Transformation Process Toolkit Business Case And Roadmap For Data Analytics Ideas PDF template with various stages. Focus and dispense information on five stages using this creative set, that comes with editable features. It contains large content boxes to add your information on topics like Analytical Capabilities, Key Owners, Outcomes. You can also showcase facts, figures, and other relevant content using this PPT layout. Grab it now.
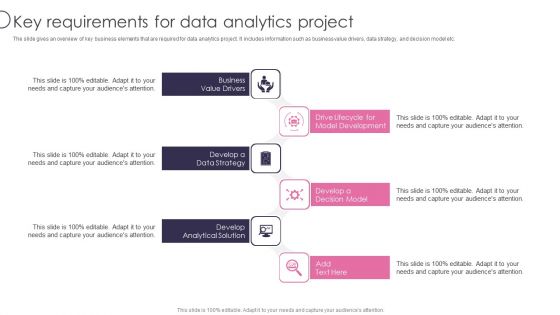
Information Transformation Process Toolkit Key Requirements For Data Analytics Project Designs PDF
The slide gives an overview of key business elements that are required for data analytics project. It includes information such as business value drivers, data strategy, and decision model etc. Presenting Information Transformation Process Toolkit Key Requirements For Data Analytics Project Designs PDF to provide visual cues and insights. Share and navigate important information on six stages that need your due attention. This template can be used to pitch topics like Business Value Drivers, Develop A Data Strategy, Develop Analytical Solution. In addtion, this PPT design contains high resolution images, graphics, etc, that are easily editable and available for immediate download.
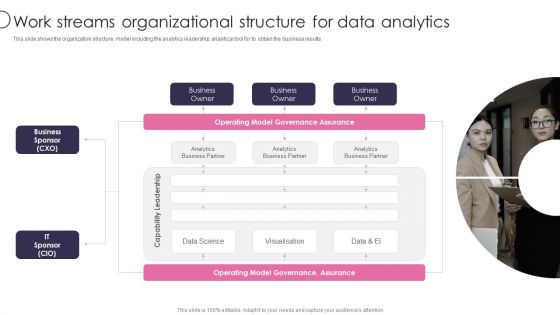
Information Transformation Process Toolkit Work Streams Organizational Structure For Data Analytics Guidelines PDF
This slide shows the organization structure model including the analytics leadership, analytical tool for to obtain the business results. This is a Information Transformation Process Toolkit Work Streams Organizational Structure For Data Analytics Guidelines PDF template with various stages. Focus and dispense information on one stages using this creative set, that comes with editable features. It contains large content boxes to add your information on topics like Business Owner, Business Sponsor, Data Science. You can also showcase facts, figures, and other relevant content using this PPT layout. Grab it now.
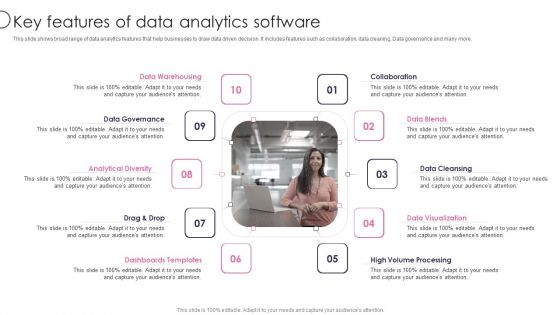
Information Transformation Process Toolkit Key Features Of Data Analytics Software Formats PDF
This slide shows broad range of data analytics features that help businesses to draw data driven decision. It includes features such as collaboration, data cleaning, Data governance and many more. Presenting Information Transformation Process Toolkit Key Features Of Data Analytics Software Formats PDF to provide visual cues and insights. Share and navigate important information on ten stages that need your due attention. This template can be used to pitch topics like Data Warehousing, Data Governance, Analytical Diversity. In addtion, this PPT design contains high resolution images, graphics, etc, that are easily editable and available for immediate download.

Key Reasons For Failure Of Data Analytics Project Business Analysis Modification Toolkit Portrait PDF
This slide describes a list of key reasons responsible for the failure of delivering accurate data analytics results to the business.This is a Key Reasons For Failure Of Data Analytics Project Business Analysis Modification Toolkit Portrait PDF template with various stages. Focus and dispense information on three stages using this creative set, that comes with editable features. It contains large content boxes to add your information on topics like Insufficient Information, Analytical Skills, Data Integration. You can also showcase facts, figures, and other relevant content using this PPT layout. Grab it now.

Key Requirements For Data Analytics Project Business Analysis Modification Toolkit Demonstration PDF
The slide gives an overview of key business elements that are required for data analytics project. It includes information such as business value drivers, data strategy, and decision model etc.Presenting Key Requirements For Data Analytics Project Business Analysis Modification Toolkit Demonstration PDF to provide visual cues and insights. Share and navigate important information on six stages that need your due attention. This template can be used to pitch topics like Analytical Solution, Model Development, Data Strategy. In addtion, this PPT design contains high resolution images, graphics, etc, that are easily editable and available for immediate download.

Data And Information Visualization Visual Analytics Branch Of Visualization Research Designs PDF
This slide shows visual analytics, the last branch of visualization research, which emerged from the advancements in the other two branches and mainly focused on analytical reasoning. Make sure to capture your audiences attention in your business displays with our gratis customizable Data And Information Visualization Visual Analytics Branch Of Visualization Research Designs PDF. These are great for business strategies, office conferences, capital raising or task suggestions. If you desire to acquire more customers for your tech business and ensure they stay satisfied, create your own sales presentation with these plain slides.
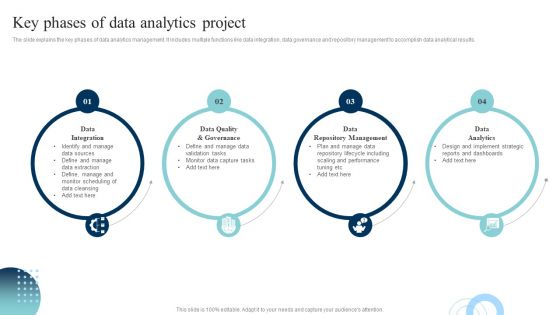
Data Evaluation And Processing Toolkit Key Phases Of Data Analytics Project Professional PDF
The slide explains the key phases of data analytics management. It includes multiple functions like data integration, data governance and repository management to accomplish data analytical results. Boost your pitch with our creative Data Evaluation And Processing Toolkit Key Phases Of Data Analytics Project Professional PDF. Deliver an awe-inspiring pitch that will mesmerize everyone. Using these presentation templates you will surely catch everyones attention. You can browse the ppts collection on our website. We have researchers who are experts at creating the right content for the templates. So you dont have to invest time in any additional work. Just grab the template now and use them.

Branches For Visual Analytics Branch Of Visualization Research And Development Slides PDF
This slide shows visual analytics, the last branch of visualization research, which emerged from the advancements in the other two branches and mainly focused on analytical reasoning. Want to ace your presentation in front of a live audience Our Branches For Visual Analytics Branch Of Visualization Research And Development Slides PDF can help you do that by engaging all the users towards you. Slidegeeks experts have put their efforts and expertise into creating these impeccable powerpoint presentations so that you can communicate your ideas clearly. Moreover, all the templates are customizable, and easy-to-edit and downloadable. Use these for both personal and commercial use.
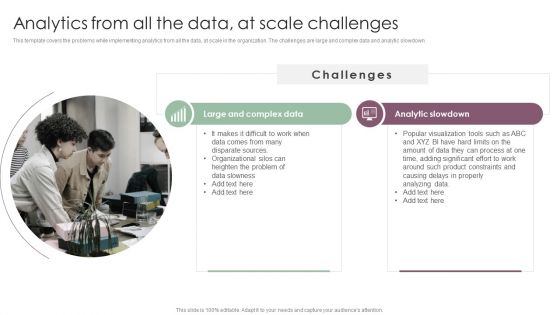
Information Analysis And BI Playbook Analytics From All The Data At Scale Challenges Slides PDF
This template covers the problems while implementing analytics from all the data, at scale in the organization. The challenges are large and complex data and analytic slowdown. Create an editable Information Analysis And BI Playbook Analytics From All The Data At Scale Challenges Slides PDF that communicates your idea and engages your audience. Whether you are presenting a business or an educational presentation, pre designed presentation templates help save time. Information Analysis And BI Playbook Analytics From All The Data At Scale Challenges Slides PDF is highly customizable and very easy to edit, covering many different styles from creative to business presentations. Slidegeeks has creative team members who have crafted amazing templates. So, go and get them without any delay.
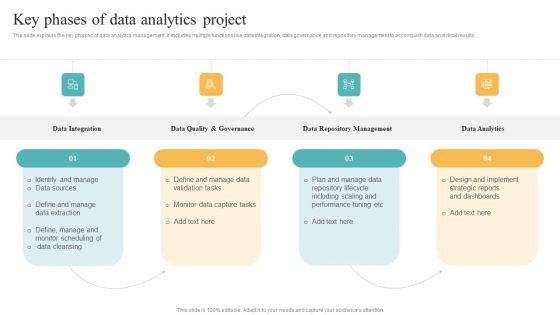
Transformation Toolkit Competitive Intelligence Information Analysis Key Phases Of Data Analytics Project Template PDF
The slide explains the key phases of data analytics management. It includes multiple functions like data integration, data governance and repository management to accomplish data analytical results. Explore a selection of the finest Transformation Toolkit Competitive Intelligence Information Analysis Key Phases Of Data Analytics Project Template PDF here. With a plethora of professionally designed and pre made slide templates, you can quickly and easily find the right one for your upcoming presentation. You can use our Transformation Toolkit Competitive Intelligence Information Analysis Key Phases Of Data Analytics Project Template PDF to effectively convey your message to a wider audience. Slidegeeks has done a lot of research before preparing these presentation templates. The content can be personalized and the slides are highly editable. Grab templates today from Slidegeeks.
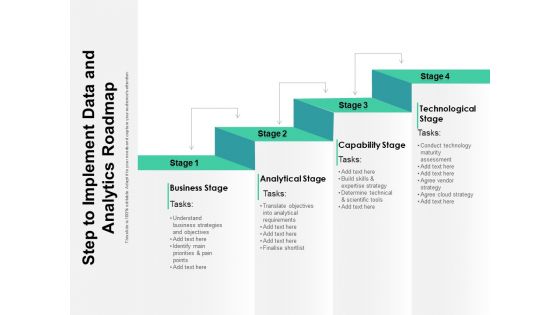
Step To Implement Data And Analytics Roadmap Ppt PowerPoint Presentation Gallery Guidelines PDF
Presenting this set of slides with name step to implement data and analytics roadmap ppt powerpoint presentation gallery guidelines pdf. This is a four stage process. The stages in this process are business, analytical, capability. This is a completely editable PowerPoint presentation and is available for immediate download. Download now and impress your audience.
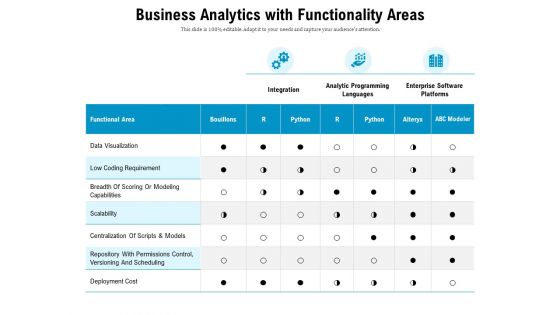
Business Analytics With Functionality Areas Ppt PowerPoint Presentation Infographics Files PDF
Pitch your topic with ease and precision using this business analytics with functionality areas ppt powerpoint presentation infographics files pdf. This layout presents information on data visualization, bouillons, analytic programming languages. It is also available for immediate download and adjustment. So, changes can be made in the color, design, graphics or any other component to create a unique layout.

Website Analytics Dashboard To Track Performance Step By Step Guide Inspiration PDF
This graph chart is linked to excel, and changes automatically based on data. Just left click on it and select Edit Data. Slidegeeks is here to make your presentations a breeze with Website Analytics Dashboard To Track Performance Step By Step Guide Inspiration PDF With our easy-to-use and customizable templates, you can focus on delivering your ideas rather than worrying about formatting. With a variety of designs to choose from, you are sure to find one that suits your needs. And with animations and unique photos, illustrations, and fonts, you can make your presentation pop. So whether you are giving a sales pitch or presenting to the board, make sure to check out Slidegeeks first
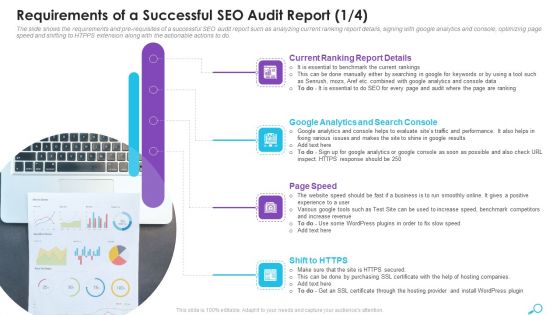
Requirements Of A Successful SEO Audit Report Analytics Ppt Slides Styles PDF
The slide shows the requirements and pre-requisites of a successful SEO audit report such as analyzing current ranking report details, signing with google analytics and console, optimizing page speed and shifting to HTPPS extension along with the actionable actions to do. Presenting requirements of a successful seo audit report analytics ppt slides styles pdf to provide visual cues and insights. Share and navigate important information on four stages that need your due attention. This template can be used to pitch topics like current ranking report details, google analytics and search console, page speed, shift to https. In addtion, this PPT design contains high resolution images, graphics, etc, that are easily editable and available for immediate download
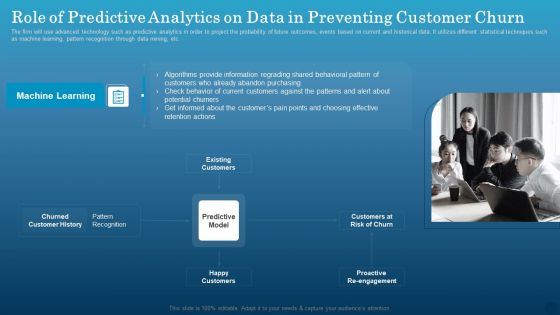
Role Of Predictive Analytics On Data In Preventing Customer Churn Formats PDF
The firm will use advanced technology such as predictive analytics in order to project the probability of future outcomes, events based on current and historical data. It utilizes different statistical techniques such as machine learning, pattern recognition through data mining, etc. Get a simple yet stunning designed Role Of Predictive Analytics On Data In Preventing Customer Churn Formats PDF. It is the best one to establish the tone in your meetings. It is an excellent way to make your presentations highly effective. So, download this PPT today from Slidegeeks and see the positive impacts. Our easy to edit Role Of Predictive Analytics On Data In Preventing Customer Churn Formats PDF can be your go-to option for all upcoming conferences and meetings. So, what are you waiting for Grab this template today.

BI Technique For Data Informed Decisions Mobile Devices Requirements For Sap Analytics Cloud Suite Clipart PDF
The following slide tabulates the mobile requirements for SAP Analytics Cloud suite in terms of mobile operating system, minimum RAM, devices supported etc. Do you have to make sure that everyone on your team knows about any specific topic I yes, then you should give BI Technique For Data Informed Decisions Mobile Devices Requirements For Sap Analytics Cloud Suite Clipart PDF a try. Our experts have put a lot of knowledge and effort into creating this impeccable BI Technique For Data Informed Decisions Mobile Devices Requirements For Sap Analytics Cloud Suite Clipart PDF. You can use this template for your upcoming presentations, as the slides are perfect to represent even the tiniest detail. You can download these templates from the Slidegeeks website and these are easy to edit. So grab these today.

BI Technique For Data Informed Decisions Pricing Plans For Sap Analytics Cloud Sample PDF
This slide represents the pricing plans for multiple licensing options of SAP Analytics Cloud. It also compares multiple suites of software on the bases of price, number of users, standard data connections, data modeling etc. Get a simple yet stunning designed BI Technique For Data Informed Decisions Pricing Plans For Sap Analytics Cloud Sample PDF. It is the best one to establish the tone in your meetings. It is an excellent way to make your presentations highly effective. So, download this PPT today from Slidegeeks and see the positive impacts. Our easy to edit BI Technique For Data Informed Decisions Pricing Plans For Sap Analytics Cloud Sample PDF can be your go to option for all upcoming conferences and meetings. So, what are you waiting for Grab this template today.
BI Technique For Data Informed Decisions Global Market Landscape Of Sap Analytics Cloud Suite Icons PDF
The purpose of this slide is to showcase the global market landscape of SAP analytics cloud as BI tool. It also contains information regarding the business intelligence BI software market share and SAP analytics cloud customers by industry. Are you in need of a template that can accommodate all of your creative concepts This one is crafted professionally and can be altered to fit any style. Use it with Google Slides or PowerPoint. Include striking photographs, symbols, depictions, and other visuals. Fill, move around, or remove text boxes as desired. Test out color palettes and font mixtures. Edit and save your work, or work with colleagues. Download BI Technique For Data Informed Decisions Global Market Landscape Of Sap Analytics Cloud Suite Icons PDF and observe how to make your presentation outstanding. Give an impeccable presentation to your group and make your presentation unforgettable.

BI Technique For Data Informed Decisions Major Users Of Sap Analytics Cloud Suite Summary PDF
The following slide illustrates the major user of SAP Analytics Cloud suite which are business users and business intelligence seekers. It also contains details regarding the usage statistics of both the users. Crafting an eye catching presentation has never been more straightforward. Let your presentation shine with this tasteful yet straightforward BI Technique For Data Informed Decisions Major Users Of Sap Analytics Cloud Suite Summary PDF template. It offers a minimalistic and classy look that is great for making a statement. The colors have been employed intelligently to add a bit of playfulness while still remaining professional. Construct the ideal BI Technique For Data Informed Decisions Major Users Of Sap Analytics Cloud Suite Summary PDF that effortlessly grabs the attention of your audience Begin now and be certain to wow your customers.

BI Technique For Data Informed Decisions Sap Analytics Cloud Comparison With Other BI Tools Structure PDF
The purpose of this slide is to showcase the comparison of SAP Analytics Cloud comparison with other available tools in the market. The comparison is done on multiple parameters such as pricing, core functionalities, and training available. Formulating a presentation can take up a lot of effort and time, so the content and message should always be the primary focus. The visuals of the PowerPoint can enhance the presenters message, so our BI Technique For Data Informed Decisions Sap Analytics Cloud Comparison With Other BI Tools Structure PDF was created to help save time. Instead of worrying about the design, the presenter can concentrate on the message while our designers work on creating the ideal templates for whatever situation is needed. Slidegeeks has experts for everything from amazing designs to valuable content, we have put everything into BI Technique For Data Informed Decisions Sap Analytics Cloud Comparison With Other BI Tools Structure PDF.
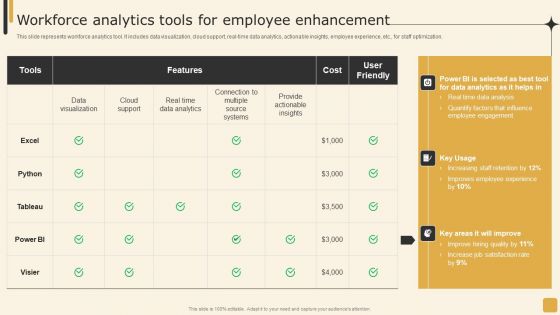
Workforce Analytics Tools For Employee Enhancement Employee Performance Management Tactics Graphics PDF
This slide represents workforce analytics tool. It includes data visualization, cloud support, real-time data analytics, actionable insights, employee experience, etc., for staff optimization.Slidegeeks is here to make your presentations a breeze with Workforce Analytics Tools For Employee Enhancement Employee Performance Management Tactics Graphics PDF With our easy-to-use and customizable templates, you can focus on delivering your ideas rather than worrying about formatting. With a variety of designs to choose from, you are sure to find one that suits your needs. And with animations and unique photos, illustrations, and fonts, you can make your presentation pop. So whether you are giving a sales pitch or presenting to the board, make sure to check out Slidegeeks first.

Information Analysis And BI Playbook Final Thoughts For Data Analytics Playbook Designs PDF
This template covers the data analytics company final thoughts at the end of the e book. Do you have to make sure that everyone on your team knows about any specific topic I yes, then you should give Information Analysis And BI Playbook Final Thoughts For Data Analytics Playbook Designs PDF a try. Our experts have put a lot of knowledge and effort into creating this impeccable Information Analysis And BI Playbook Final Thoughts For Data Analytics Playbook Designs PDF. You can use this template for your upcoming presentations, as the slides are perfect to represent even the tiniest detail. You can download these templates from the Slidegeeks website and these are easy to edit. So grab these today.
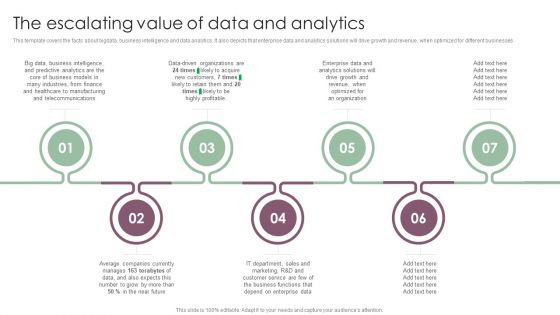
Information Analysis And BI Playbook The Escalating Value Of Data And Analytics Download PDF
This template covers the facts about bigdata, business intelligence and data analytics. It also depicts that enterprise data and analytics solutions will drive growth and revenue, when optimized for different businesses. Slidegeeks is here to make your presentations a breeze with Information Analysis And BI Playbook The Escalating Value Of Data And Analytics Download PDF With our easy to use and customizable templates, you can focus on delivering your ideas rather than worrying about formatting. With a variety of designs to choose from, you are sure to find one that suits your needs. And with animations and unique photos, illustrations, and fonts, you can make your presentation pop. So whether you are giving a sales pitch or presenting to the board, make sure to check out Slidegeeks first.
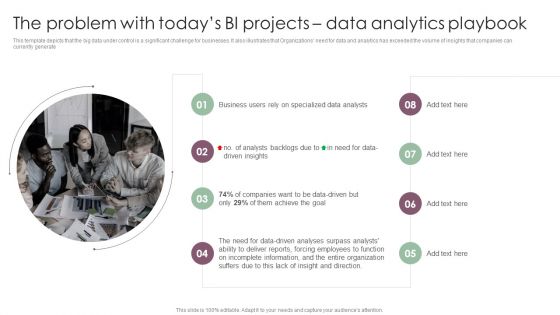
Information Analysis And BI Playbook The Problem With Todays BI Projects Data Analytics Playbook Portrait PDF
This template depicts that the big data under control is a significant challenge for businesses. It also illustrates that Organizations need for data and analytics has exceeded the volume of insights that companies can currently generate. Do you have an important presentation coming up Are you looking for something that will make your presentation stand out from the rest Look no further than Information Analysis And BI Playbook The Problem With Todays BI Projects Data Analytics Playbook Portrait PDF. With our professional designs, you can trust that your presentation will pop and make delivering it a smooth process. And with Slidegeeks, you can trust that your presentation will be unique and memorable. So why wait Grab Information Analysis And BI Playbook The Problem With Todays BI Projects Data Analytics Playbook Portrait PDF today and make your presentation stand out from the rest.

Search Driven Analytics Challenges Low BI Adoption Rate And Poor User Experience Background PDF
This template covers the problems while implementing search driven analytics in the organization. The challenges are failure rate for BI projects and poor user experience stifles adoption. Whether you have daily or monthly meetings, a brilliant presentation is necessary. Search Driven Analytics Challenges Low BI Adoption Rate And Poor User Experience Background PDF can be your best option for delivering a presentation. Represent everything in detail using Search Driven Analytics Challenges Low BI Adoption Rate And Poor User Experience Background PDF and make yourself stand out in meetings. The template is versatile and follows a structure that will cater to your requirements. All the templates prepared by Slidegeeks are easy to download and edit. Our research experts have taken care of the corporate themes as well. So, give it a try and see the results.

How To Bridge Business Intelligence And Predictive Analytics Challenges Mockup PDF
This template depicts that with interactive BI visualization and predictive modeling in the same enterprise analytics platform, organizations can easily collaborate on initiatives that make recommended actions accessible to the business. If you are looking for a format to display your unique thoughts, then the professionally designed How To Bridge Business Intelligence And Predictive Analytics Challenges Mockup PDF is the one for you. You can use it as a Google Slides template or a PowerPoint template. Incorporate impressive visuals, symbols, images, and other charts. Modify or reorganize the text boxes as you desire. Experiment with shade schemes and font pairings. Alter, share or cooperate with other people on your work. Download How To Bridge Business Intelligence And Predictive Analytics Challenges Mockup PDF and find out how to give a successful presentation. Present a perfect display to your team and make your presentation unforgettable.
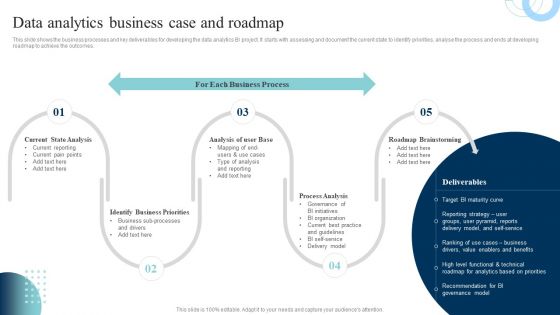
Data Evaluation And Processing Toolkit Data Analytics Business Case And Roadmap Guidelines PDF
This slide shows the business processes and key deliverables for developing the data analytics BI project. It starts with assessing and document the current state to identify priorities, analyse the process and ends at developing roadmap to achieve the outcomes. Find highly impressive Data Evaluation And Processing Toolkit Data Analytics Business Case And Roadmap Guidelines PDF on Slidegeeks to deliver a meaningful presentation. You can save an ample amount of time using these presentation templates. No need to worry to prepare everything from scratch because Slidegeeks experts have already done a huge research and work for you. You need to download Data Evaluation And Processing Toolkit Data Analytics Business Case And Roadmap Guidelines PDF for your upcoming presentation. All the presentation templates are 100 percent editable and you can change the color and personalize the content accordingly. Download now.

Data Evaluation And Processing Toolkit Data Analytics Program Checklist Inspiration PDF
This slide shows progress status of data analytics process which includes important key tasks that must be performed while initiating a project. If you are looking for a format to display your unique thoughts, then the professionally designed Data Evaluation And Processing Toolkit Data Analytics Program Checklist Inspiration PDF is the one for you. You can use it as a Google Slides template or a PowerPoint template. Incorporate impressive visuals, symbols, images, and other charts. Modify or reorganize the text boxes as you desire. Experiment with shade schemes and font pairings. Alter, share or cooperate with other people on your work. Download Data Evaluation And Processing Toolkit Data Analytics Program Checklist Inspiration PDF and find out how to give a successful presentation. Present a perfect display to your team and make your presentation unforgettable.

Data Evaluation And Processing Toolkit Data Analytics Value Stream Chain Microsoft PDF
This slide illustrates the series of activities required for analyzing the data. It contains information such as data preparation, exploratory analysis, and predictive analytics etc. Formulating a presentation can take up a lot of effort and time, so the content and message should always be the primary focus. The visuals of the PowerPoint can enhance the presenters message, so our Data Evaluation And Processing Toolkit Data Analytics Value Stream Chain Microsoft PDF was created to help save time. Instead of worrying about the design, the presenter can concentrate on the message while our designers work on creating the ideal templates for whatever situation is needed. Slidegeeks has experts for everything from amazing designs to valuable content, we have put everything into Data Evaluation And Processing Toolkit Data Analytics Value Stream Chain Microsoft PDF.
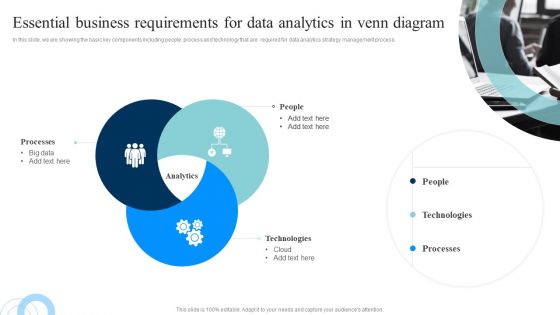
Data Evaluation And Processing Toolkit Essential Business Requirements For Data Analytics Topics PDF
In this slide, we are showing the basic key components including people, process and technology that are required for data analytics strategy management process. Explore a selection of the finest Data Evaluation And Processing Toolkit Essential Business Requirements For Data Analytics Topics PDF here. With a plethora of professionally designed and pre-made slide templates, you can quickly and easily find the right one for your upcoming presentation. You can use our Data Evaluation And Processing Toolkit Essential Business Requirements For Data Analytics Topics PDF to effectively convey your message to a wider audience. Slidegeeks has done a lot of research before preparing these presentation templates. The content can be personalized and the slides are highly editable. Grab templates today from Slidegeeks.

Data Evaluation And Processing Toolkit Key Checklist For Data Analytics Program Sample PDF
This slide shows the list of skills that are required for implementing the data analytics process. Are you searching for a Data Evaluation And Processing Toolkit Key Checklist For Data Analytics Program Sample PDF that is uncluttered, straightforward, and original Its easy to edit, and you can change the colors to suit your personal or business branding. For a presentation that expresses how much effort youve put in, this template is ideal With all of its features, including tables, diagrams, statistics, and lists, its perfect for a business plan presentation. Make your ideas more appealing with these professional slides. Download Data Evaluation And Processing Toolkit Key Checklist For Data Analytics Program Sample PDF from Slidegeeks today.
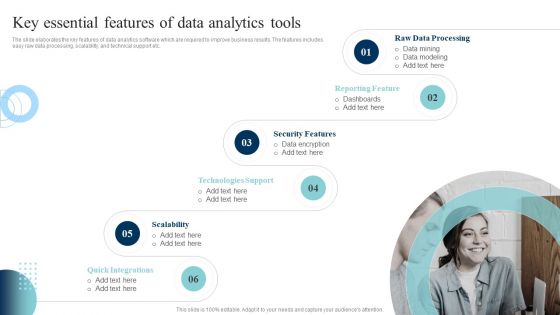
Data Evaluation And Processing Toolkit Key Essential Features Of Data Analytics Tools Inspiration PDF
The slide elaborates the key features of data analytics software which are required to improve business results. The features includes easy raw data processing, scalability, and technical support etc. Here you can discover an assortment of the finest PowerPoint and Google Slides templates. With these templates, you can create presentations for a variety of purposes while simultaneously providing your audience with an eye-catching visual experience. Download Data Evaluation And Processing Toolkit Key Essential Features Of Data Analytics Tools Inspiration PDF to deliver an impeccable presentation. These templates will make your job of preparing presentations much quicker, yet still, maintain a high level of quality. Slidegeeks has experienced researchers who prepare these templates and write high-quality content for you. Later on, you can personalize the content by editing the Data Evaluation And Processing Toolkit Key Essential Features Of Data Analytics Tools Inspiration PDF.
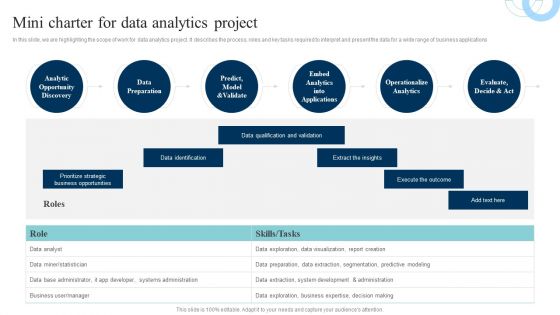
Data Evaluation And Processing Toolkit Mini Charter For Data Analytics Project Graphics PDF
In this slide, we are highlighting the scope of work for data analytics project. It describes the process, roles and key tasks required to interpret and present the data for a wide range of business applications. Do you have to make sure that everyone on your team knows about any specific topic I yes, then you should give Data Evaluation And Processing Toolkit Mini Charter For Data Analytics Project Graphics PDF a try. Our experts have put a lot of knowledge and effort into creating this impeccable Data Evaluation And Processing Toolkit Mini Charter For Data Analytics Project Graphics PDF. You can use this template for your upcoming presentations, as the slides are perfect to represent even the tiniest detail. You can download these templates from the Slidegeeks website and these are easy to edit. So grab these today.
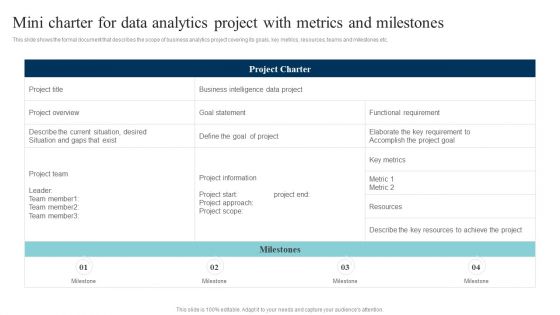
Data Evaluation And Processing Toolkit Mini Charter For Data Analytics Project With Metrics Brochure PDF
This slide shows the formal document that describes the scope of business analytics project covering its goals, key metrics, resources, teams and milestones etc. Get a simple yet stunning designed Data Evaluation And Processing Toolkit Mini Charter For Data Analytics Project With Metrics Brochure PDF. It is the best one to establish the tone in your meetings. It is an excellent way to make your presentations highly effective. So, download this PPT today from Slidegeeks and see the positive impacts. Our easy-to-edit Data Evaluation And Processing Toolkit Mini Charter For Data Analytics Project With Metrics Brochure PDF can be your go-to option for all upcoming conferences and meetings. So, what are you waiting for Grab this template today.

 Home
Home