Analytics
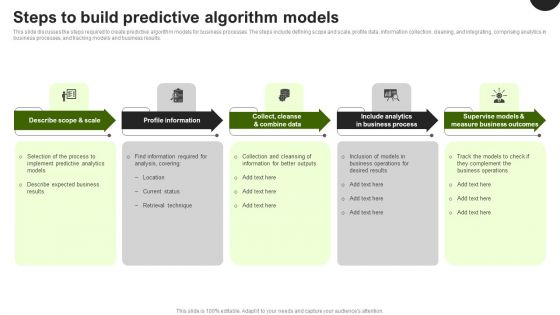
Predictive Analytics In The Age Of Big Data Steps To Build Predictive Algorithm Models Sample PDF
This slide discusses the steps required to create predictive algorithm models for business processes. The steps include defining scope and scale, profile data, information collection, cleaning, and integrating, comprising analytics in business processes, and tracking models and business results. Create an editable Predictive Analytics In The Age Of Big Data Steps To Build Predictive Algorithm Models Sample PDF that communicates your idea and engages your audience. Whether youre presenting a business or an educational presentation, pre designed presentation templates help save time. Predictive Analytics In The Age Of Big Data Steps To Build Predictive Algorithm Models Sample PDF is highly customizable and very easy to edit, covering many different styles from creative to business presentations. Slidegeeks has creative team members who have crafted amazing templates. So, go and get them without any delay.

Online Marketing Analytics To Enhance Business Growth Case Study Improving Teams Performance Diagrams PDF
This slide covers a case study of a company that improved various business teams performance by utilizing marketing analytics. The issues solved are developing proprietary insights engines, reporting weekly advertising spends, timely reporting, and stopping marketing APIs. Do you have to make sure that everyone on your team knows about any specific topic I yes, then you should give Online Marketing Analytics To Enhance Business Growth Case Study Improving Teams Performance Diagrams PDF a try. Our experts have put a lot of knowledge and effort into creating this impeccable Online Marketing Analytics To Enhance Business Growth Case Study Improving Teams Performance Diagrams PDF. You can use this template for your upcoming presentations, as the slides are perfect to represent even the tiniest detail. You can download these templates from the Slidegeeks website and these are easy to edit. So grab these today.

Financial Analytics Solution Investor Funding Elevator Pitch Deck Core Team Microsoft PDF
This slide represents core management team of analytics company. It includes CEO, Technology manager, and marketing manager. Formulating a presentation can take up a lot of effort and time, so the content and message should always be the primary focus. The visuals of the PowerPoint can enhance the presenters message, so our Financial Analytics Solution Investor Funding Elevator Pitch Deck Core Team Microsoft PDF was created to help save time. Instead of worrying about the design, the presenter can concentrate on the message while our designers work on creating the ideal templates for whatever situation is needed. Slidegeeks has experts for everything from amazing designs to valuable content, we have put everything into Financial Analytics Solution Investor Funding Elevator Pitch Deck Core Team Microsoft PDF
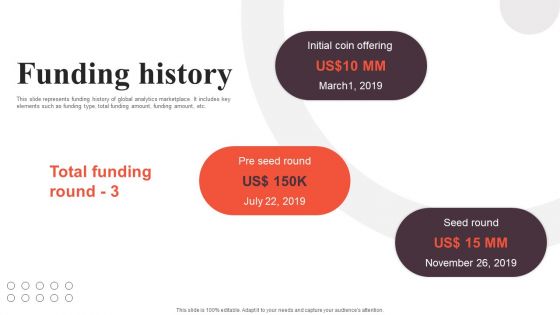
Financial Analytics Solution Investor Funding Elevator Pitch Deck Funding History Ideas PDF
This slide represents funding history of global analytics marketplace. It includes key elements such as funding type, total funding amount, funding amount, etc. Explore a selection of the finest Financial Analytics Solution Investor Funding Elevator Pitch Deck Funding History Ideas PDF here. With a plethora of professionally designed and pre made slide templates, you can quickly and easily find the right one for your upcoming presentation. You can use our Financial Analytics Solution Investor Funding Elevator Pitch Deck Funding History Ideas PDF to effectively convey your message to a wider audience. Slidegeeks has done a lot of research before preparing these presentation templates. The content can be personalized and the slides are highly editable. Grab templates today from Slidegeeks.

Financial Analytics Solution Investor Funding Elevator Pitch Deck Our Solutions Designs PDF
Following slide exhibits major solutions offered to issues faced by businesses in financial and organizational analysis. It includes key solution which is digital marketplace for analytics. Crafting an eye catching presentation has never been more straightforward. Let your presentation shine with this tasteful yet straightforward Financial Analytics Solution Investor Funding Elevator Pitch Deck Our Solutions Designs PDF template. It offers a minimalistic and classy look that is great for making a statement. The colors have been employed intelligently to add a bit of playfulness while still remaining professional. Construct the ideal Financial Analytics Solution Investor Funding Elevator Pitch Deck Our Solutions Designs PDF that effortlessly grabs the attention of your audience. Begin now and be certain to wow your customers.
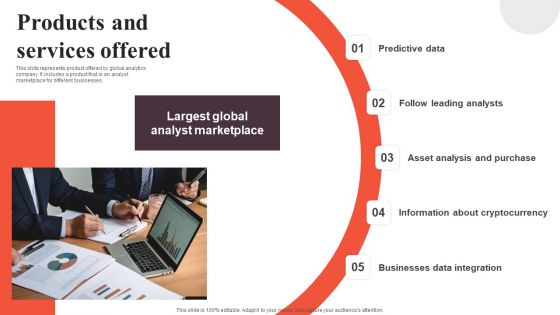
Financial Analytics Solution Investor Funding Elevator Pitch Deck Products And Services Offered Rules PDF
This slide represents product offered by global analytics company. It includes a product that is an analyst marketplace for different businesses. Formulating a presentation can take up a lot of effort and time, so the content and message should always be the primary focus. The visuals of the PowerPoint can enhance the presenters message, so our Financial Analytics Solution Investor Funding Elevator Pitch Deck Products And Services Offered Rules PDF was created to help save time. Instead of worrying about the design, the presenter can concentrate on the message while our designers work on creating the ideal templates for whatever situation is needed. Slidegeeks has experts for everything from amazing designs to valuable content, we have put everything into Financial Analytics Solution Investor Funding Elevator Pitch Deck Products And Services Offered Rules PDF
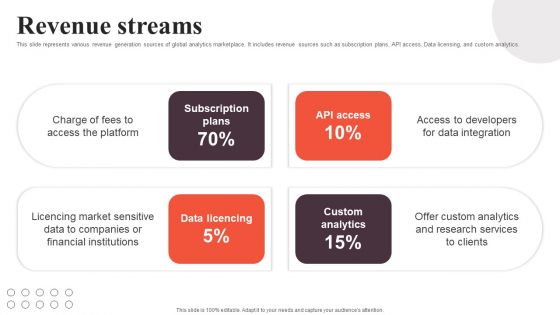
Financial Analytics Solution Investor Funding Elevator Pitch Deck Revenue Streams Elements PDF
This slide represents various revenue generation sources of global analytics marketplace. It includes revenue sources such as subscription plans, API access, Data licensing, and custom analytics. Coming up with a presentation necessitates that the majority of the effort goes into the content and the message you intend to convey. The visuals of a PowerPoint presentation can only be effective if it supplements and supports the story that is being told. Keeping this in mind our experts created Financial Analytics Solution Investor Funding Elevator Pitch Deck Revenue Streams Elements PDF to reduce the time that goes into designing the presentation. This way, you can concentrate on the message while our designers take care of providing you with the right template for the situation.
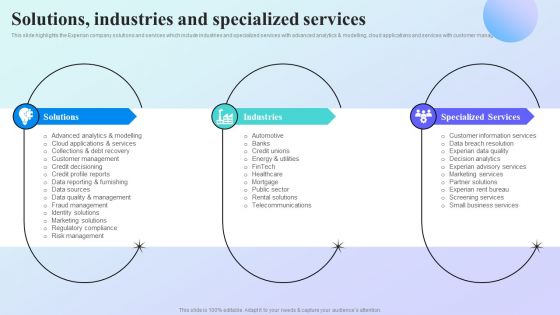
Information Analytics Company Outline Solutions Industries And Specialized Services Portrait PDF
This slide highlights the Experian company solutions and services which include industries and specialized services with advanced analytics and modelling, cloud applications and services with customer management. Are you searching for a Information Analytics Company Outline Solutions Industries And Specialized Services Portrait PDF that is uncluttered, straightforward, and original Its easy to edit, and you can change the colors to suit your personal or business branding. For a presentation that expresses how much effort you have put in, this template is ideal. With all of its features, including tables, diagrams, statistics, and lists, its perfect for a business plan presentation. Make your ideas more appealing with these professional slides. Download Information Analytics Company Outline Solutions Industries And Specialized Services Portrait PDF from Slidegeeks today.
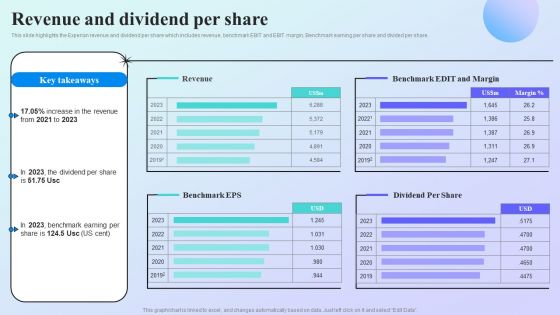
Information Analytics Company Outline Revenue And Dividend Per Share Guidelines PDF
This slide highlights the Experian revenue and dividend per share which includes revenue, benchmark EBIT and EBIT margin, Benchmark earning per share and divided per share. Presenting this PowerPoint presentation, titled Information Analytics Company Outline Revenue And Dividend Per Share Guidelines PDF, with topics curated by our researchers after extensive research. This editable presentation is available for immediate download and provides attractive features when used. Download now and captivate your audience. Presenting this Information Analytics Company Outline Revenue And Dividend Per Share Guidelines PDF. Our researchers have carefully researched and created these slides with all aspects taken into consideration. This is a completely customizable Information Analytics Company Outline Revenue And Dividend Per Share Guidelines PDF that is available for immediate downloading. Download now and make an impact on your audience. Highlight the attractive features available with our PPTs.

Projection Model Applications Of Predictive Analytics In Healthcare Department Summary PDF
This slide outlines the application of predictive analytics in the healthcare department for forecasting the probability of patients having particular medical disorders. The benefits include improving patient outcomes, relief for healthcare professionals, and improvement in the decision making process. Find highly impressive Projection Model Applications Of Predictive Analytics In Healthcare Department Summary PDF on Slidegeeks to deliver a meaningful presentation. You can save an ample amount of time using these presentation templates. No need to worry to prepare everything from scratch because Slidegeeks experts have already done a huge research and work for you. You need to download Projection Model Applications Of Predictive Analytics In Healthcare Department Summary PDF for your upcoming presentation. All the presentation templates are 100 percent editable and you can change the color and personalize the content accordingly. Download now
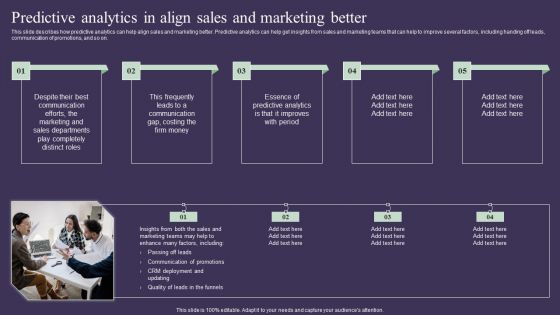
Projection Model Predictive Analytics In Align Sales And Marketing Better Ideas PDF
This slide describes how predictive analytics can help align sales and marketing better. Predictive analytics can help get insights from sales and marketing teams that can help to improve several factors, including handing off leads, communication of promotions, and so on. This Projection Model Predictive Analytics In Align Sales And Marketing Better Ideas PDF from Slidegeeks makes it easy to present information on your topic with precision. It provides customization options, so you can make changes to the colors, design, graphics, or any other component to create a unique layout. It is also available for immediate download, so you can begin using it right away. Slidegeeks has done good research to ensure that you have everything you need to make your presentation stand out. Make a name out there for a brilliant performance.
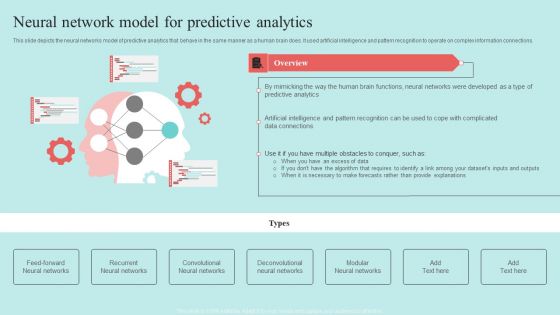
Predictive Data Model Neural Network Model For Predictive Analytics Structure PDF
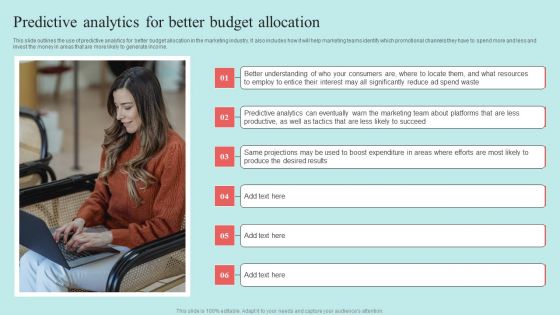
Predictive Data Model Predictive Analytics For Better Budget Allocation Background PDF
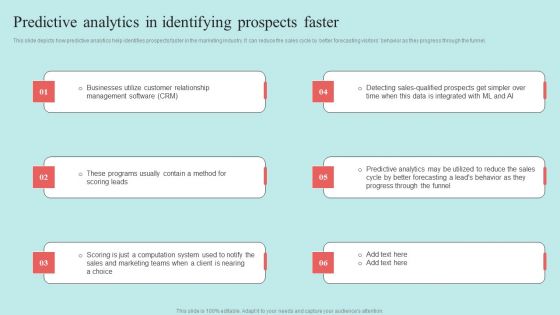
Predictive Data Model Predictive Analytics In Identifying Prospects Faster Pictures PDF
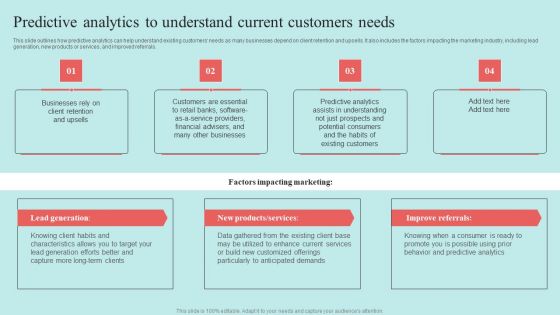
Predictive Data Model Predictive Analytics To Understand Current Customers Needs Infographics PDF
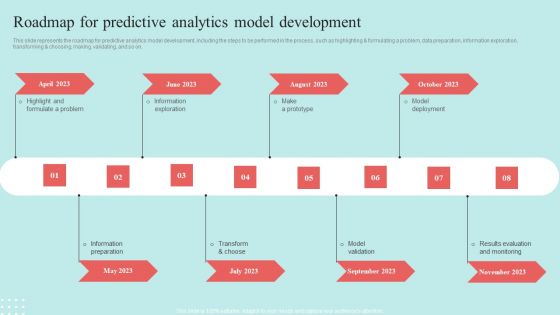
Predictive Data Model Roadmap For Predictive Analytics Model Development Clipart PDF
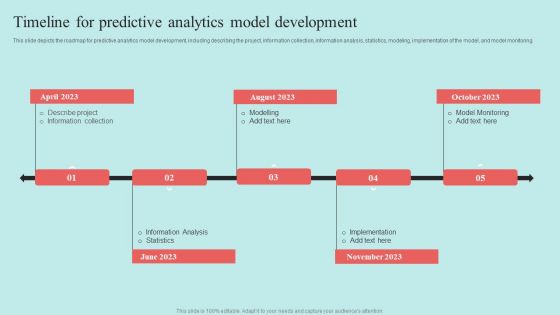
Predictive Data Model Timeline For Predictive Analytics Model Development Elements PDF
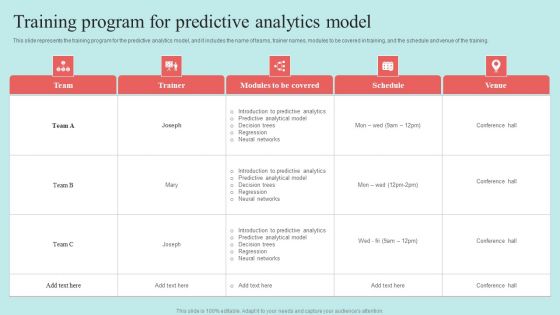
Predictive Data Model Training Program For Predictive Analytics Model Microsoft PDF
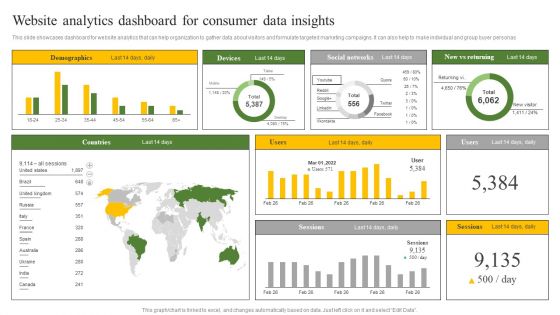
Website Analytics Dashboard For Consumer Data Insights Ppt Infographic Template Samples PDF
This slide showcases dashboard for website analytics that can help organization to gather data about visitors and formulate targeted marketing campaigns. It can also help to make individual and group buyer personas. Crafting an eye catching presentation has never been more straightforward. Let your presentation shine with this tasteful yet straightforward Website Analytics Dashboard For Consumer Data Insights Ppt Infographic Template Samples PDF template. It offers a minimalistic and classy look that is great for making a statement. The colors have been employed intelligently to add a bit of playfulness while still remaining professional. Construct the ideal Website Analytics Dashboard For Consumer Data Insights Ppt Infographic Template Samples PDF that effortlessly grabs the attention of your audience Begin now and be certain to wow your customers.
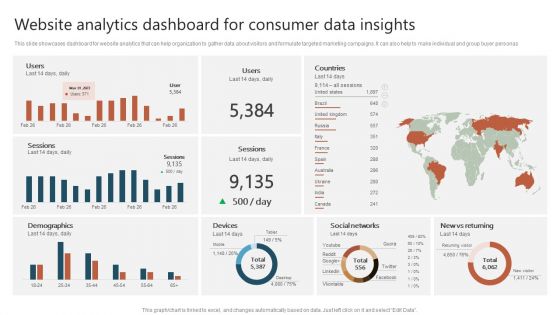
Website Analytics Dashboard For Consumer Data Insights Ppt Show Graphics Download PDF
This slide showcases dashboard for website analytics that can help organization to gather data about visitors and formulate targeted marketing campaigns. It can also help to make individual and group buyer personas. Crafting an eye catching presentation has never been more straightforward. Let your presentation shine with this tasteful yet straightforward Website Analytics Dashboard For Consumer Data Insights Ppt Show Graphics Download PDF template. It offers a minimalistic and classy look that is great for making a statement. The colors have been employed intelligently to add a bit of playfulness while still remaining professional. Construct the ideal Website Analytics Dashboard For Consumer Data Insights Ppt Show Graphics Download PDF that effortlessly grabs the attention of your audience Begin now and be certain to wow your customers.
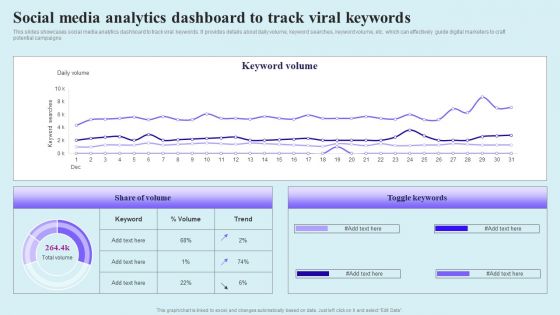
Go Viral Campaign Strategies To Increase Engagement Social Media Analytics Dashboard Track Viral Graphics PDF
This slides showcases social media analytics dashboard to track viral keywords. It provides details about daily volume, keyword searches, keyword volume, etc. which can effectively guide digital marketers to craft potential campaigns Are you searching for a Go Viral Campaign Strategies To Increase Engagement Social Media Analytics Dashboard Track Viral Graphics PDF that is uncluttered, straightforward, and original Its easy to edit, and you can change the colors to suit your personal or business branding. For a presentation that expresses how much effort you have put in, this template is ideal. With all of its features, including tables, diagrams, statistics, and lists, its perfect for a business plan presentation. Make your ideas more appealing with these professional slides. Download Go Viral Campaign Strategies To Increase Engagement Social Media Analytics Dashboard Track Viral Graphics PDF from Slidegeeks today.

Iot Integration In Manufacturing Predictive Analytics Dashboard To Track Manufacturing Operations Background PDF
This slide depicts the predictive analytics dashboard to track manufacturing operations, including production volume, order volume, active machines, sales revenue, top five products, downtime causes, production volume by top five machines, and so on. If you are looking for a format to display your unique thoughts, then the professionally designed Iot Integration In Manufacturing Predictive Analytics Dashboard To Track Manufacturing Operations Background PDF is the one for you. You can use it as a Google Slides template or a PowerPoint template. Incorporate impressive visuals, symbols, images, and other charts. Modify or reorganize the text boxes as you desire. Experiment with shade schemes and font pairings. Alter, share or cooperate with other people on your work. Download Iot Integration In Manufacturing Predictive Analytics Dashboard To Track Manufacturing Operations Background PDF and find out how to give a successful presentation. Present a perfect display to your team and make your presentation unforgettable.
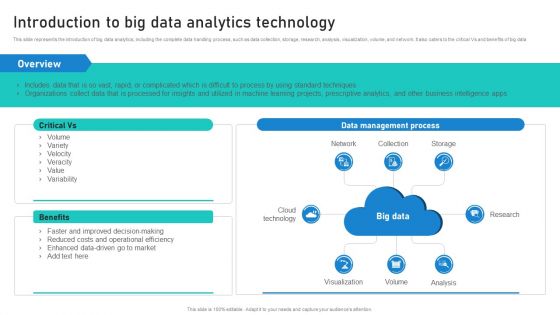
Intelligent Process Automation IPA Introduction To Big Data Analytics Technology Background PDF
This slide represents the introduction of big data analytics, including the complete data handling process, such as data collection, storage, research, analysis, visualization, volume, and network. It also caters to the critical Vs and benefits of big data. Create an editable Intelligent Process Automation IPA Introduction To Big Data Analytics Technology Background PDF that communicates your idea and engages your audience. Whether you are presenting a business or an educational presentation, pre-designed presentation templates help save time. Intelligent Process Automation IPA Introduction To Big Data Analytics Technology Background PDF is highly customizable and very easy to edit, covering many different styles from creative to business presentations. Slidegeeks has creative team members who have crafted amazing templates. So, go and get them without any delay.

Transforming Manufacturing With Automation Predictive Analytics Dashboard To Track Diagrams PDF
This slide depicts the predictive analytics dashboard to track manufacturing operations, including production volume, order volume, active machines, sales revenue, top five products, downtime causes, production volume by top five machines, and so on. Get a simple yet stunning designed Transforming Manufacturing With Automation Predictive Analytics Dashboard To Track Diagrams PDF. It is the best one to establish the tone in your meetings. It is an excellent way to make your presentations highly effective. So, download this PPT today from Slidegeeks and see the positive impacts. Our easy to edit Transforming Manufacturing With Automation Predictive Analytics Dashboard To Track Diagrams PDF can be your go to option for all upcoming conferences and meetings. So, what are you waiting for Grab this template today.

Improving Business Marketing Performance Comparison Of Performance Analytics Tools CRP DK SS V
This slide showcases comparative assessment of marketing analytics tools based on features, prices, free trail and user ratings. Find highly impressive Improving Business Marketing Performance Comparison Of Performance Analytics Tools CRP DK SS V on Slidegeeks to deliver a meaningful presentation. You can save an ample amount of time using these presentation templates. No need to worry to prepare everything from scratch because Slidegeeks experts have already done a huge research and work for you. You need to download Improving Business Marketing Performance Comparison Of Performance Analytics Tools CRP DK SS V for your upcoming presentation. All the presentation templates are 100 percent editable and you can change the color and personalize the content accordingly. Download now

Advantage And Disadvantages Of Using Developing Strategic Insights Using Big Data Analytics SS V
This slide showcases benefits and drawbacks of implementing descriptive analytics in business. It includes elements such as complex datasets, inaccurate data, data correlations, performance assessment, data driven decision making etc. Create an editable Advantage And Disadvantages Of Using Developing Strategic Insights Using Big Data Analytics SS V that communicates your idea and engages your audience. Whether you are presenting a business or an educational presentation, pre-designed presentation templates help save time. Advantage And Disadvantages Of Using Developing Strategic Insights Using Big Data Analytics SS V is highly customizable and very easy to edit, covering many different styles from creative to business presentations. Slidegeeks has creative team members who have crafted amazing templates. So, go and get them without any delay.

Best Practices For Implementing Prescriptive Developing Strategic Insights Using Big Data Analytics SS V
This slide showcases tips which can be adopted for leveraging prescriptive analytics techniques for driving business outcomes. It provides information regarding cost analysis, data quality and advanced analytics tools. Slidegeeks is here to make your presentations a breeze with Best Practices For Implementing Prescriptive Developing Strategic Insights Using Big Data Analytics SS V With our easy-to-use and customizable templates, you can focus on delivering your ideas rather than worrying about formatting. With a variety of designs to choose from, you are sure to find one that suits your needs. And with animations and unique photos, illustrations, and fonts, you can make your presentation pop. So whether you are giving a sales pitch or presenting to the board, make sure to check out Slidegeeks first

Comparative Assessment Of Predictive Developing Strategic Insights Using Big Data Analytics SS V
This slide showcases comparison of predictive analytics software used for data discovery and driving business outcomes. It provides information regarding software, features, price, free trial and user ratings. This Comparative Assessment Of Predictive Developing Strategic Insights Using Big Data Analytics SS V is perfect for any presentation, be it in front of clients or colleagues. It is a versatile and stylish solution for organizing your meetings. The Comparative Assessment Of Predictive Developing Strategic Insights Using Big Data Analytics SS V features a modern design for your presentation meetings. The adjustable and customizable slides provide unlimited possibilities for acing up your presentation. Slidegeeks has done all the homework before launching the product for you. So, do not wait, grab the presentation templates today
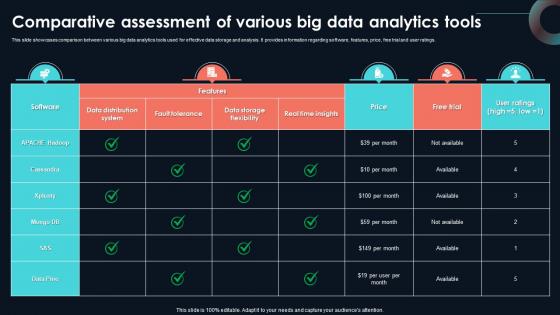
Comparative Assessment Of Various Big Developing Strategic Insights Using Big Data Analytics SS V
This slide showcases comparison between various big data analytics tools used for effective data storage and analysis. It provides information regarding software, features, price, free trial and user ratings. Explore a selection of the finest Comparative Assessment Of Various Big Developing Strategic Insights Using Big Data Analytics SS V here. With a plethora of professionally designed and pre-made slide templates, you can quickly and easily find the right one for your upcoming presentation. You can use our Comparative Assessment Of Various Big Developing Strategic Insights Using Big Data Analytics SS V to effectively convey your message to a wider audience. Slidegeeks has done a lot of research before preparing these presentation templates. The content can be personalized and the slides are highly editable. Grab templates today from Slidegeeks.
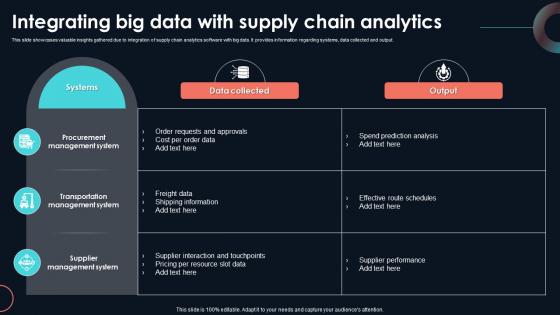
Integrating Big Data With Supply Chain Developing Strategic Insights Using Big Data Analytics SS V
This slide showcases valuable insights gathered due to integration of supply chain analytics software with big data. It provides information regarding systems, data collected and output. Create an editable Integrating Big Data With Supply Chain Developing Strategic Insights Using Big Data Analytics SS V that communicates your idea and engages your audience. Whether you are presenting a business or an educational presentation, pre-designed presentation templates help save time. Integrating Big Data With Supply Chain Developing Strategic Insights Using Big Data Analytics SS V is highly customizable and very easy to edit, covering many different styles from creative to business presentations. Slidegeeks has creative team members who have crafted amazing templates. So, go and get them without any delay.
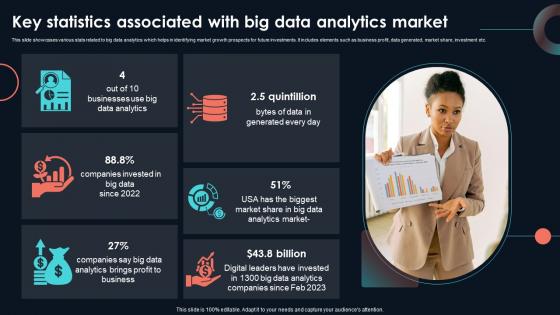
Key Statistics Associated With Big Data Developing Strategic Insights Using Big Data Analytics SS V
This slide showcases various stats related to big data analytics which helps in identifying market growth prospects for future investments. It includes elements such as business profit, data generated, market share, investment etc. If you are looking for a format to display your unique thoughts, then the professionally designed Key Statistics Associated With Big Data Developing Strategic Insights Using Big Data Analytics SS V is the one for you. You can use it as a Google Slides template or a PowerPoint template. Incorporate impressive visuals, symbols, images, and other charts. Modify or reorganize the text boxes as you desire. Experiment with shade schemes and font pairings. Alter, share or cooperate with other people on your work. Download Key Statistics Associated With Big Data Developing Strategic Insights Using Big Data Analytics SS V and find out how to give a successful presentation. Present a perfect display to your team and make your presentation unforgettable.

Key Techniques Used In Big Data Predictive Developing Strategic Insights Using Big Data Analytics SS V
This slide showcases various techniques used in predictive analytics which helps in data driven decision making. It provides information regarding deep learning, graph analytics and recommendation systems. Are you in need of a template that can accommodate all of your creative concepts This one is crafted professionally and can be altered to fit any style. Use it with Google Slides or PowerPoint. Include striking photographs, symbols, depictions, and other visuals. Fill, move around, or remove text boxes as desired. Test out color palettes and font mixtures. Edit and save your work, or work with colleagues. Download Key Techniques Used In Big Data Predictive Developing Strategic Insights Using Big Data Analytics SS V and observe how to make your presentation outstanding. Give an impeccable presentation to your group and make your presentation unforgettable.
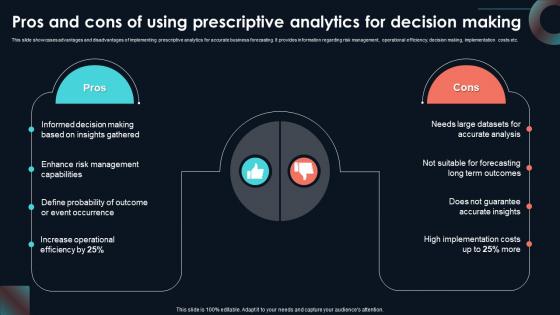
Pros And Cons Of Using Prescriptive Developing Strategic Insights Using Big Data Analytics SS V
This slide showcases advantages and disadvantages of implementing prescriptive analytics for accurate business forecasting. It provides information regarding risk management, operational efficiency, decision making, implementation costs etc. This Pros And Cons Of Using Prescriptive Developing Strategic Insights Using Big Data Analytics SS V is perfect for any presentation, be it in front of clients or colleagues. It is a versatile and stylish solution for organizing your meetings. The Pros And Cons Of Using Prescriptive Developing Strategic Insights Using Big Data Analytics SS V features a modern design for your presentation meetings. The adjustable and customizable slides provide unlimited possibilities for acing up your presentation. Slidegeeks has done all the homework before launching the product for you. So, do not wait, grab the presentation templates today
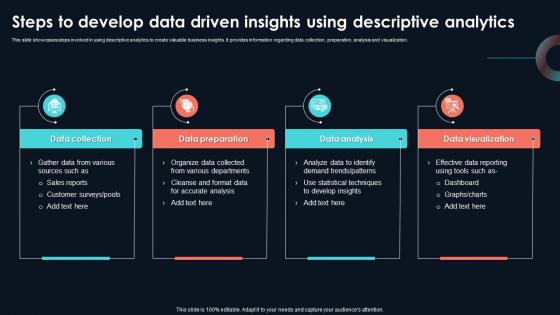
Steps To Develop Data Driven Insights Using Developing Strategic Insights Using Big Data Analytics SS V
This slide showcases steps involved in using descriptive analytics to create valuable business insights. It provides information regarding data collection, preparation, analysis and visualization. Are you searching for a Steps To Develop Data Driven Insights Using Developing Strategic Insights Using Big Data Analytics SS V that is uncluttered, straightforward, and original Its easy to edit, and you can change the colors to suit your personal or business branding. For a presentation that expresses how much effort you have put in, this template is ideal With all of its features, including tables, diagrams, statistics, and lists, its perfect for a business plan presentation. Make your ideas more appealing with these professional slides. Download Steps To Develop Data Driven Insights Using Developing Strategic Insights Using Big Data Analytics SS V from Slidegeeks today.

Online Business Trends With SEO And Google Analytics Ppt PowerPoint Presentation Summary Infographic Template PDF
Presenting this set of slides with name online business trends with seo and google analytics ppt powerpoint presentation summary infographic template pdf. This is a nine stage process. The stages in this process are machine learning ai, augmented reality, image and voice recognition based search, faster checkout system, free delivery, seamless omnichannel management, shopping cart optimization, 4k visual content, seo and google analytics, commerce trends 2020. This is a completely editable PowerPoint presentation and is available for immediate download. Download now and impress your audience.

Market Entry Strategy Clubs Industry Analytics Dashboard For Gym Health And Fitness Clubs Summary PDF
This slide covers the Key performance indicators for analysing social media platforms, email campaigns and website performance. Presenting market entry strategy clubs industry analytics dashboard for gym health and fitness clubs summary pdf to provide visual cues and insights. Share and navigate important information on seven stages that need your due attention. This template can be used to pitch topics like Analytics Dashboard for Gym Health and Fitness Clubs. In addtion, this PPT design contains high-resolution images, graphics, etc, that are easily editable and available for immediate download.

Market Intelligence Multilevel Analytics Five Year Roadmap For Medical Services Sector Introduction
We present our market intelligence multilevel analytics five year roadmap for medical services sector introduction. This PowerPoint layout is easy to edit so you can change the font size, font type, color, and shape conveniently. In addition to this, the PowerPoint layout is Google Slides compatible, so you can share it with your audience and give them access to edit it. Therefore, download and save this well researched market intelligence multilevel analytics five year roadmap for medical services sector introduction in different formats like PDF, PNG, and JPG to smoothly execute your business plan.
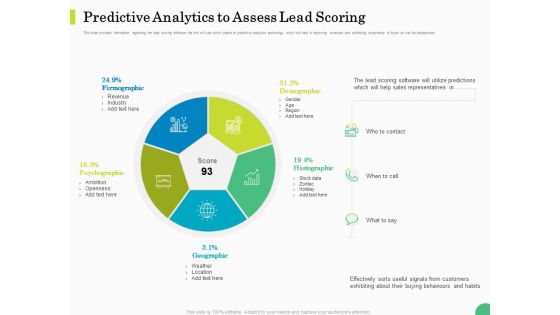
Evaluating Rank Prospects Predictive Analytics To Assess Lead Scoring Ppt Inspiration Clipart PDF
This slide provides information regarding the lead scoring software the firm will use which caters to predictive analytics technology which will help in improving revenues and optimizing experience of buyer as well as salesperson. This is a evaluating rank prospects predictive analytics to assess lead scoring ppt inspiration clipart pdf template with various stages. Focus and dispense information on five stages using this creative set, that comes with editable features. It contains large content boxes to add your information on topics like firmographic, demographic, histographic, geographic, psychographic. You can also showcase facts, figures, and other relevant content using this PPT layout. Grab it now.
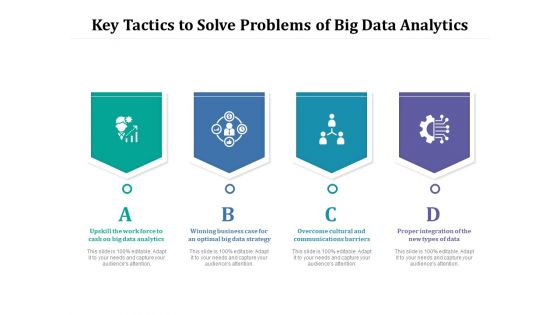
Key Tactics To Solve Problems Of Big Data Analytics Ppt PowerPoint Presentation Slides Styles PDF
Persuade your audience using this key tactics to solve problems of big data analytics ppt powerpoint presentation slides styles pdf. This PPT design covers four stages, thus making it a great tool to use. It also caters to a variety of topics including upskill the work force to cash on big data analytics, winning business case for an optimal big data strategy, overcome cultural and communications barriers, proper integration of the new types of data. Download this PPT design now to present a convincing pitch that not only emphasizes the topic but also showcases your presentation skills.
Controlling Customer Retention Customer Journey Analytics Team Ppt Icon Themes PDF
The firm can also measure churn rate using customer journey analytics tools by mapping entire customer journey by analyzing various touchpoint encountered. This is a controlling customer retention customer journey analytics team ppt icon themes pdf template with various stages. Focus and dispense information on one stages using this creative set, that comes with editable features. It contains large content boxes to add your information on topics like analysis, value, customer, team. You can also showcase facts, figures, and other relevant content using this PPT layout. Grab it now.
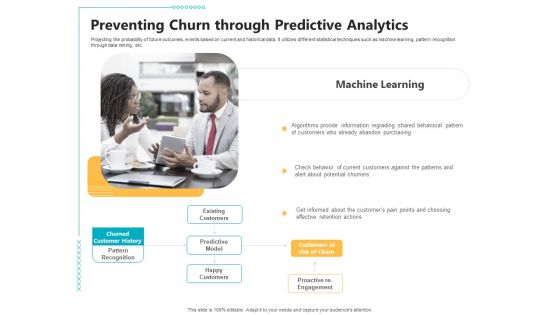
Controlling Customer Retention Preventing Churn Through Predictive Analytics Ppt Model Format PDF
Projecting the probability of future outcomes, events based on current and historical data. It utilizes different statistical techniques such as machine learning, pattern recognition through data mining, etc. This is a controlling customer retention preventing churn through predictive analytics ppt model format pdf template with various stages. Focus and dispense information on one stages using this creative set, that comes with editable features. It contains large content boxes to add your information on topics like preventing churn through predictive analytics. You can also showcase facts, figures, and other relevant content using this PPT layout. Grab it now.
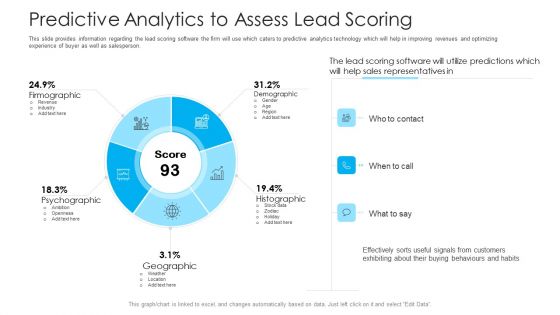
How To Build A Revenue Funnel Predictive Analytics To Assess Lead Scoring Sample PDF
This slide provides information regarding the lead scoring software the firm will use which caters to predictive analytics technology which will help in improving revenues and optimizing experience of buyer as well as salesperson. This is a how to build a revenue funnel predictive analytics to assess lead scoring sample pdf template with various stages. Focus and dispense information on five stages using this creative set, that comes with editable features. It contains large content boxes to add your information on topics like revenue, industry, geographic, sales, software. You can also showcase facts, figures, and other relevant content using this PPT layout. Grab it now.
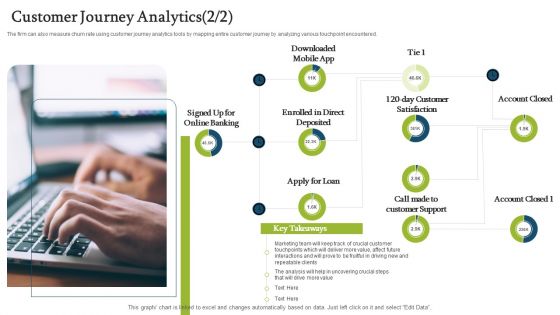
Forecasting And Managing Consumer Attrition For Business Advantage Customer Journey Analytics Direct Designs PDF
The firm can also measure churn rate using customer journey analytics tools by mapping entire customer journey by analyzing various touchpoint encountered.Deliver and pitch your topic in the best possible manner with this forecasting and managing consumer attrition for business advantage customer journey analytics direct designs pdf. Use them to share invaluable insights on signed up for online banking, enrolled in direct deposited, downloaded mobile app and impress your audience. This template can be altered and modified as per your expectations. So, grab it now.
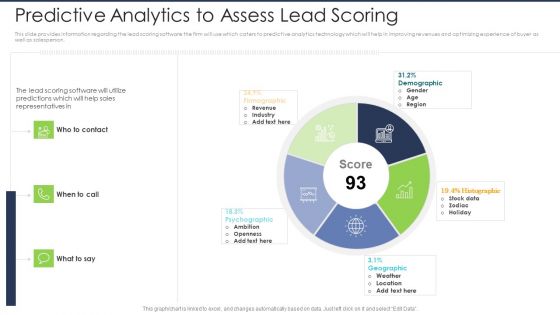
Lead Scoring AI Model Predictive Analytics To Assess Lead Scoring Ppt Inspiration Images PDF
This slide provides information regarding the lead scoring software the firm will use which caters to predictive analytics technology which will help in improving revenues and optimizing experience of buyer as well as salesperson. This is a lead scoring ai model predictive analytics to assess lead scoring ppt inspiration images pdf template with various stages. Focus and dispense information on five stages using this creative set, that comes with editable features. It contains large content boxes to add your information on topics like psychographic, firmographic, demographic, geographic, histographic. You can also showcase facts, figures, and other relevant content using this PPT layout. Grab it now.
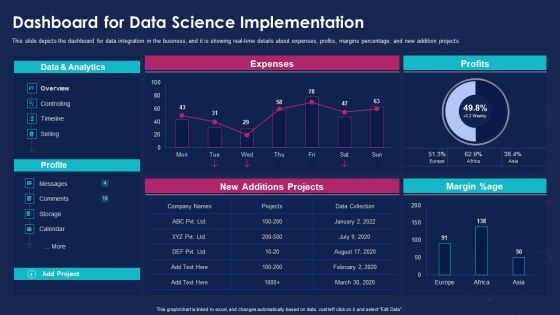
Data Analytics IT Dashboard For Data Science Implementation Ppt Portfolio Pictures PDF
This slide depicts the dashboard for data integration in the business, and it is showing real-time details about expenses, profits, margins percentage, and new addition projects. Deliver and pitch your topic in the best possible manner with this data analytics it dashboard for data science implementation ppt portfolio pictures pdf. Use them to share invaluable insights on data and analytics, margin percentage, profits, expenses, new additions projects and impress your audience. This template can be altered and modified as per your expectations. So, grab it now.
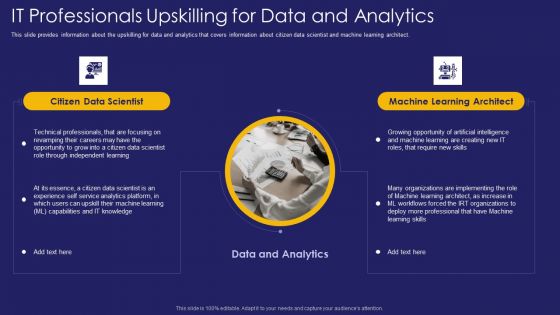
Role IT Team Digital Transformation It Professionals Upskilling For Data And Analytics Structure PDF
This slide provides information about the upskilling for data and analytics that covers information about citizen data scientist and machine learning architect. This is a role it team digital transformation it professionals upskilling for data and analytics structure pdf template with various stages. Focus and dispense information on two stages using this creative set, that comes with editable features. It contains large content boxes to add your information on topics like data, independent, learning. You can also showcase facts, figures, and other relevant content using this PPT layout. Grab it now.
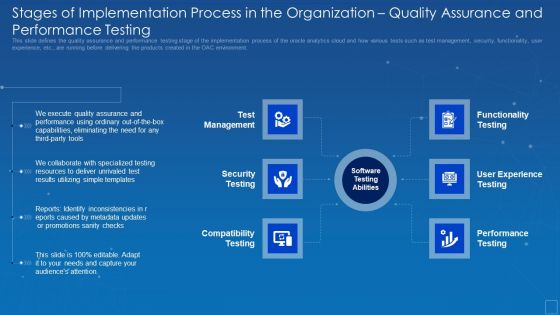
Oracle Cloud Data Analytics Administration IT Stages Implementation Organization Sample PDF
This slide defines the quality assurance and performance testing stage of the implementation process of the oracle analytics cloud and how various tests such as test management, security, functionality, user experience, etc., are running before delivering the products created in the OAC environment. This is a oracle cloud data analytics administration it stages implementation organization sample pdf template with various stages. Focus and dispense information on six stages using this creative set, that comes with editable features. It contains large content boxes to add your information on topics like eliminating, quality, assurance, performance, capabilities. You can also showcase facts, figures, and other relevant content using this PPT layout. Grab it now.
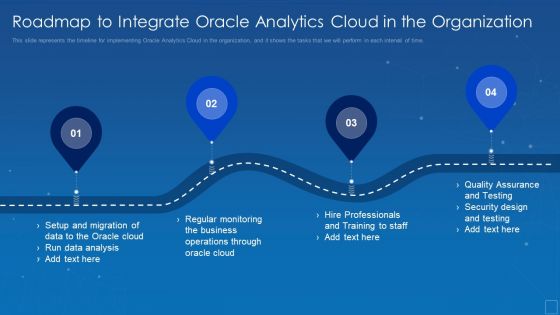
Roadmap To Integrate Oracle Analytics Cloud In The Organization Formats Infographics PDF
This slide represents the timeline for implementing Oracle Analytics Cloud in the organization, and it shows the tasks that we will perform in each interval of time. Presenting roadmap to integrate oracle analytics cloud in the organization formats infographics pdf to provide visual cues and insights. Share and navigate important information on four stages that need your due attention. This template can be used to pitch topics like. In addtion, this PPT design contains high resolution images, graphics, etc, that are easily editable and available for immediate download.
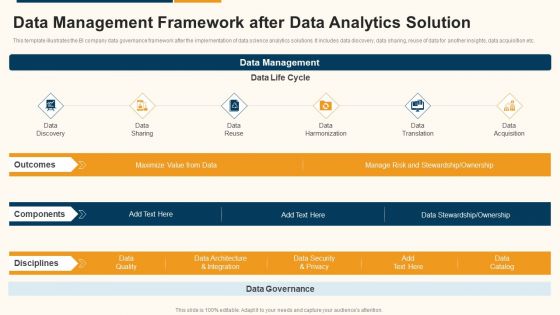
Data Interpretation And Analysis Playbook Data Management Framework After Data Analytics Solution Structure PDF
This template illustrates the BI company data governance framework after the implementation of data science analytics solutions. It includes data discovery, data sharing, reuse of data for another insights, data acquisition etc. This is a data interpretation and analysis playbook data management framework after data analytics solution structure pdf template with various stages. Focus and dispense information on six stages using this creative set, that comes with editable features. It contains large content boxes to add your information on topics like data discovery, data sharing, data reuse, data harmonization, data translation, data acquisition. You can also showcase facts, figures, and other relevant content using this PPT layout. Grab it now.

Data Interpretation And Analysis Playbook Business Intelligence And Predictive Analytics Challenges Template PDF
This template covers the problems while implementing BI and predictive analytics in the organization. The challenges are undefined KPIs and metrics, and unable to hire right data science talent. Presenting data interpretation and analysis playbook business intelligence and predictive analytics challenges template pdf to provide visual cues and insights. Share and navigate important information on two stages that need your due attention. This template can be used to pitch topics like security vulnerabilities, operationalizing, perform analysis, deployed. In addtion, this PPT design contains high resolution images, graphics, etc, that are easily editable and available for immediate download.

Data Interpretation And Analysis Playbook The Problem With Todays Bi Projects Data Analytics Playbook Introduction PDF
This template depicts that the big data under control is a significant challenge for businesses. It also illustrates that Organizations need for data and analytics has exceeded the volume of insights that companies can currently generate. This is a data interpretation and analysis playbook the problem with todays bi projects data analytics playbook introduction pdf template with various stages. Focus and dispense information on seven stages using this creative set, that comes with editable features. It contains large content boxes to add your information on topics like organization, analysts, business, data driven. You can also showcase facts, figures, and other relevant content using this PPT layout. Grab it now.
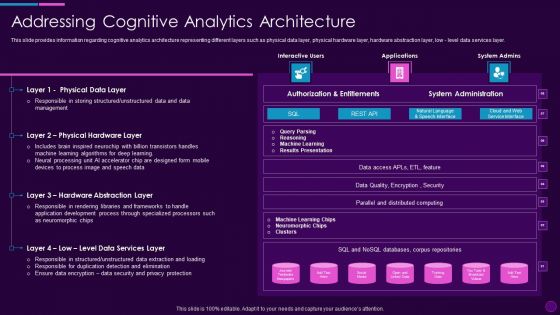
Cognitive Computing Action Plan Addressing Cognitive Analytics Architecture Ppt Slides Topics PDF
This slide provides information regarding cognitive analytics architecture representing different layers such as physical data layer, physical hardware layer, hardware abstraction layer, low - level data services layer. Deliver and pitch your topic in the best possible manner with this cognitive computing action plan addressing cognitive analytics architecture ppt slides topics pdf. Use them to share invaluable insights on physical data layer, physical hardware layer, hardware abstraction layer, level data services layer and impress your audience. This template can be altered and modified as per your expectations. So, grab it now.

Executing Advance Data Analytics At Workspace Technological Assessment Of Firm Sample PDF
The slide displays the current delivery gap the firm has been facing in context to infrastructure management capabilities by assessing them on certain focus areas such as real time synchronization, digital advisory services, customer analytics, etc. Presenting executing advance data analytics at workspace technological assessment of firm sample pdf to provide visual cues and insights. Share and navigate important information on four stages that need your due attention. This template can be used to pitch topics like technological assessment of firm current infrastructure management capabilities. In addtion, this PPT design contains high resolution images, graphics, etc, that are easily editable and available for immediate download.
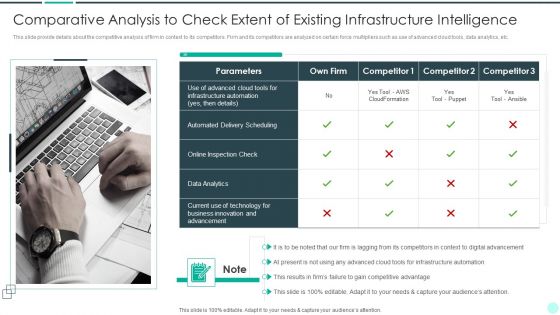
Executing Advance Data Analytics At Workspace Comparative Analysis To Check Extent Demonstration PDF
This slide provide details about the competitive analysis of firm in context to its competitors. Firm and its competitors are analyzed on certain force multipliers such as use of advanced cloud tools, data analytics, etc. Presenting executing advance data analytics at workspace comparative analysis to check extent demonstration pdf to provide visual cues and insights. Share and navigate important information on one stages that need your due attention. This template can be used to pitch topics like comparative analysis to check extent of existing infrastructure intelligence. In addtion, this PPT design contains high resolution images, graphics, etc, that are easily editable and available for immediate download.

Executing Advance Data Analytics At Workspace Determine Capabilities Enabling Intelligent Sample PDF
This slide covers information regarding capabilities that are required in order to enable intelligent infrastructure in terms of utilizing analytics algorithms, tracking infrastructure components, etc. Presenting executing advance data analytics at workspace determine capabilities enabling intelligent sample pdf to provide visual cues and insights. Share and navigate important information on three stages that need your due attention. This template can be used to pitch topics like processes, business, decommission, requirements. In addtion, this PPT design contains high resolution images, graphics, etc, that are easily editable and available for immediate download.
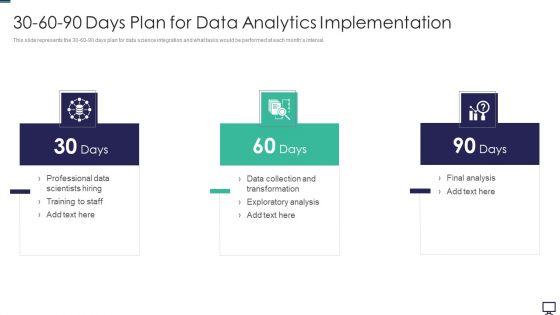
30 60 90 Days Plan For Data Analytics Implementation Ppt Ideas Layout PDF
This slide represents the 30 60 90 days plan for data science integration and what tasks would be performed at each months interval. This is a 30 60 90 days plan for data analytics implementation ppt ideas layout pdf template with various stages. Focus and dispense information on three stages using this creative set, that comes with editable features. It contains large content boxes to add your information on topics like 30 60 90 days plan for data analytics implementation. You can also showcase facts, figures, and other relevant content using this PPT layout. Grab it now.
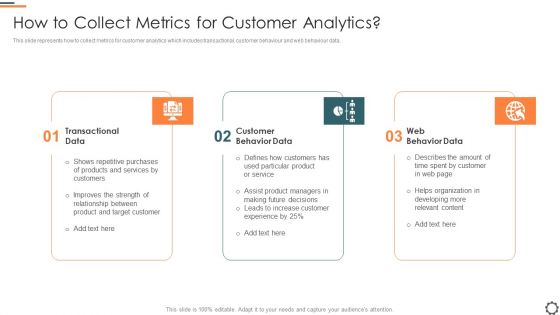
Agile Group For Product Development How To Collect Metrics For Customer Analytics Guidelines PDF
This slide represents how to collect metrics for customer analytics which includes transactional, customer behaviour and web behaviour data. This is a agile group for product development how to collect metrics for customer analytics guidelines pdf template with various stages. Focus and dispense information on three stages using this creative set, that comes with editable features. It contains large content boxes to add your information on topics like transactional data, customer behavior data, web behavior data. You can also showcase facts, figures, and other relevant content using this PPT layout. Grab it now.
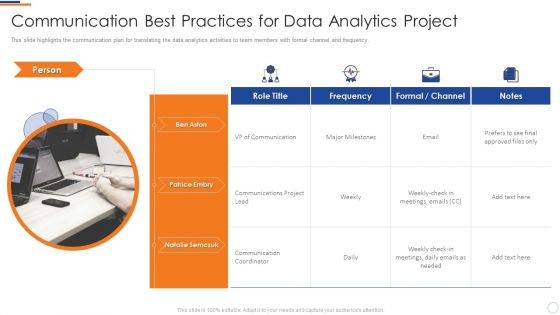
Business Intelligence And Big Communication Best Practices For Data Analytics Mockup PDF
This slide highlights the communication plan for translating the data analytics activities to team members with formal channel and frequency. Presenting business intelligence and big communication best practices for data analytics mockup pdf to provide visual cues and insights. Share and navigate important information on four stages that need your due attention. This template can be used to pitch topics like communications project lead, communication coordinator, vp communication. In addtion, this PPT design contains high resolution images, graphics, etc, that are easily editable and available for immediate download.
Business Intelligence And Big Data Analytics Project Plan Lifecycle Icons PDF
This slide shows the data analytics lifecycle covering multiple stages starting from presenting the business case to data identification, data validation, analysis and ending at data visualization and utilization of results. Deliver an awe inspiring pitch with this creative business intelligence and big data analytics project plan lifecycle icons pdf bundle. Topics like business case evaluation, data identification, data analysis, data visualization, data extraction can be discussed with this completely editable template. It is available for immediate download depending on the needs and requirements of the user.
Business Intelligence And Big Industry Data Analytics Value Stream Model Icons PDF
This slide illustrates the workflow related to performing the data analytics project along with key responsible owners to accomplish the activities. This is a business intelligence and big industry data analytics value stream model icons pdf template with various stages. Focus and dispense information on four stages using this creative set, that comes with editable features. It contains large content boxes to add your information on topics like business manager, it system management, data miner, data analyst. You can also showcase facts, figures, and other relevant content using this PPT layout. Grab it now.

 Home
Home