

 Home
Home 

SlideGeeks
-
PowerPoint Tutorial- Create Innovative 3D Arrows
Are you bored of creating the usual arrows for your presentation? Are you looking for ways to make your presentation more interesting and eye-catching? Well, we have a solution for your dull and boring presentation. It will not only make your presentation far more interesting and eye-catching but will totally... SlideGeeks
July 20, 2022
SlideGeeks
July 20, 2022
-
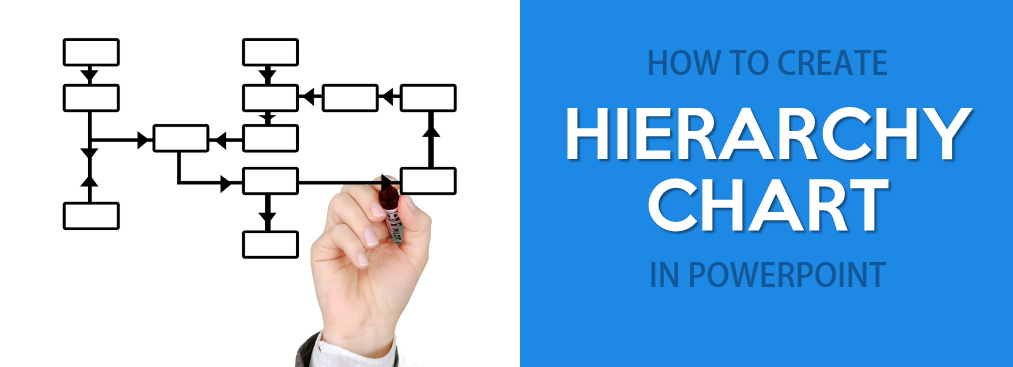
How to Create a Professional Hierarchy Chart in PowerPoint
Visualize your colleagues like never before. Create a Hierarchy Chart which helps employees to find a right person to talk to. It simplifies the structure of the company and it also increases the visibility and transparency of the company. Hierarchy Chart clearly enables to give a clear view on the...
SlideGeeks
May 30, 2018
-

How to Design Thank You Slides That Your Audiences Will Thank You For
Thank you – We have heard the term so often that we no longer acknowledge it. Clichéd thank you’s are as common as Keep Calm Memes doing rounds on the internet. The same trend is being followed by presenters all around the world. Most PowerPoint presentations are followed by a...
SlideGeeks
May 30, 2018
-

Turn boring organization charts into stunning ones using these designs
When it is time to outline a company’s structure or describe its hierarchy or relationships, nothing can beat a well-made organizational chart. It enables team members to know their duties, and at higher level, aids to coordinate all organizational activities efficiently. The main purpose of having an organization chart is...
SlideGeeks
May 30, 2018
-
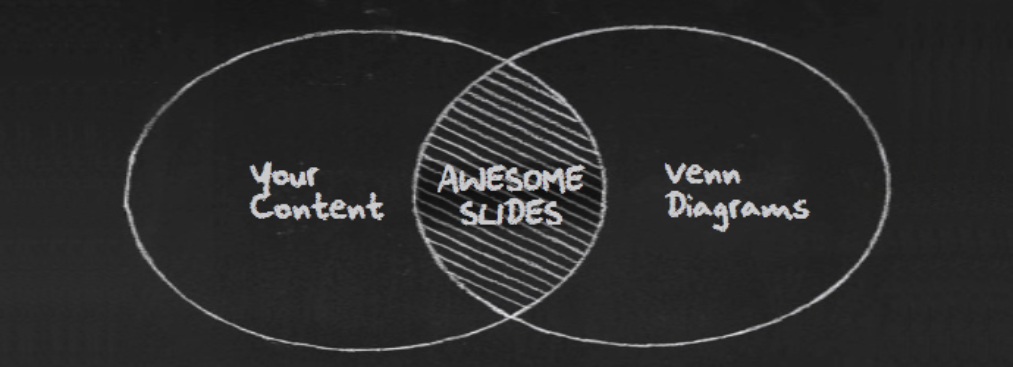
Venn Diagrams: How and When to Use These in Your Presentation
Venn diagrams are almost everywhere. They are the new age graphs and are now a pre-included feature of MS Office 2013. The advantage that Venn diagrams have over conventional graphs is that although both can be used to denote mathematical figures, Venn diagrams can also denote and compare non-mathematical figures...
SlideGeeks
February 20, 2019
-

How to Choose the Right Text and Background Colors for your Presentation
You would have given many PowerPoint presentations by now and would have seen others giving too. Were you ever guilty of picking wrong colors for your PPT templates? Have you ever seen the audience squinting their eyes to read the text displayed on the screen even if the font size...
SlideGeeks
May 30, 2018
-
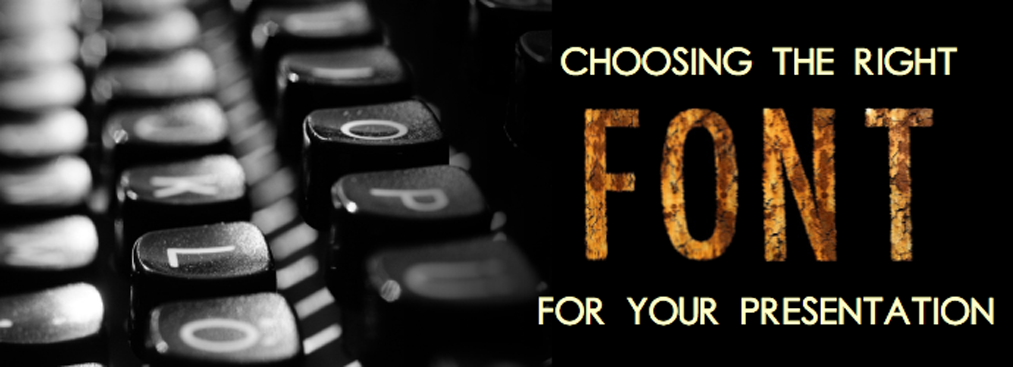
8 Mistakes You Must Avoid While Choosing Fonts For Your PowerPoint Presentation
People in ancient times spent hours to carve a single alphabet on walls of monuments. But today, when all it takes is a click, it should be well utilized to convert your presentation into a lasting and impactful one. Not so long ago, changing font style or size meant changing...
SlideGeeks
May 30, 2018
