Annual Operating Revenue And Total Expenses Comparison Ppt Infographic Template Rules PDF
- Google Slides is a new FREE Presentation software from Google.
- All our content is 100% compatible with Google Slides.
- Just download our designs, and upload them to Google Slides and they will work automatically.
- Amaze your audience with SlideGeeks and Google Slides.
-
Want Changes to This PPT Slide? Check out our Presentation Design Services
- WideScreen Aspect ratio is becoming a very popular format. When you download this product, the downloaded ZIP will contain this product in both standard and widescreen format.
-

- Some older products that we have may only be in standard format, but they can easily be converted to widescreen.
- To do this, please open the SlideGeeks product in Powerpoint, and go to
- Design ( On the top bar) -> Page Setup -> and select "On-screen Show (16:9)” in the drop down for "Slides Sized for".
- The slide or theme will change to widescreen, and all graphics will adjust automatically. You can similarly convert our content to any other desired screen aspect ratio.
Compatible With Google Slides

Get This In WideScreen
You must be logged in to download this presentation.
 Impress Your
 Audience
 100%
100% Editable
Google Slides
Features of these PowerPoint presentation slides:
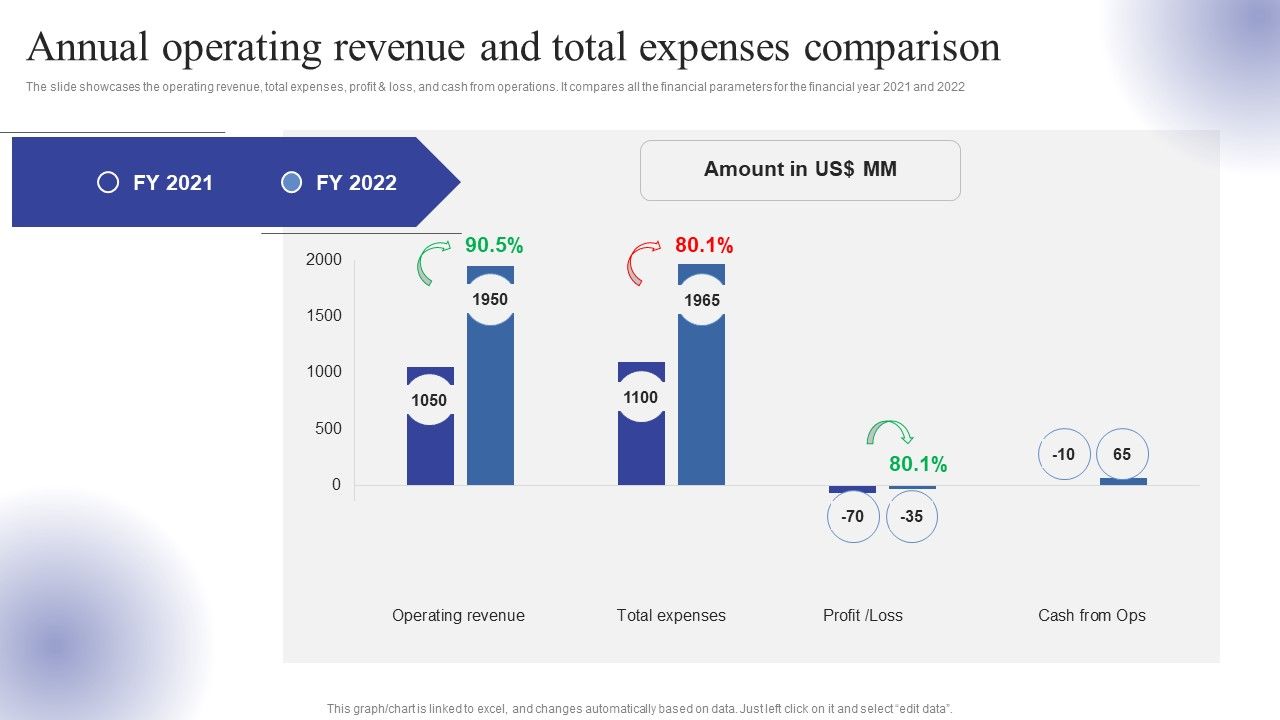
The slide showcases the operating revenue, total expenses, profit and loss, and cash from operations. It compares all the financial parameters for the financial year 2021 and 2022. Want to ace your presentation in front of a live audience Our Annual Operating Revenue And Total Expenses Comparison Ppt Infographic Template Rules PDF can help you do that by engaging all the users towards you.. Slidegeeks experts have put their efforts and expertise into creating these impeccable powerpoint presentations so that you can communicate your ideas clearly. Moreover, all the templates are customizable, and easy-to-edit and downloadable. Use these for both personal and commercial use.
People who downloaded this PowerPoint presentation also viewed the following :
Annual Operating Revenue And Total Expenses Comparison Ppt Infographic Template Rules PDF with all 2 slides:
Most Relevant Reviews
-
Helpful product design for delivering presentation.
-
Professional and unique presentations.

 Home
Home 


