Non Performing Assets Loans Graph Structure PDF
- Google Slides is a new FREE Presentation software from Google.
- All our content is 100% compatible with Google Slides.
- Just download our designs, and upload them to Google Slides and they will work automatically.
- Amaze your audience with SlideGeeks and Google Slides.
-
Want Changes to This PPT Slide? Check out our Presentation Design Services
- WideScreen Aspect ratio is becoming a very popular format. When you download this product, the downloaded ZIP will contain this product in both standard and widescreen format.
-

- Some older products that we have may only be in standard format, but they can easily be converted to widescreen.
- To do this, please open the SlideGeeks product in Powerpoint, and go to
- Design ( On the top bar) -> Page Setup -> and select "On-screen Show (16:9)” in the drop down for "Slides Sized for".
- The slide or theme will change to widescreen, and all graphics will adjust automatically. You can similarly convert our content to any other desired screen aspect ratio.
Compatible With Google Slides

Get This In WideScreen
You must be logged in to download this presentation.
 Impress Your
 Audience
 100%
100% Editable
Google Slides
Features of these PowerPoint presentation slides:
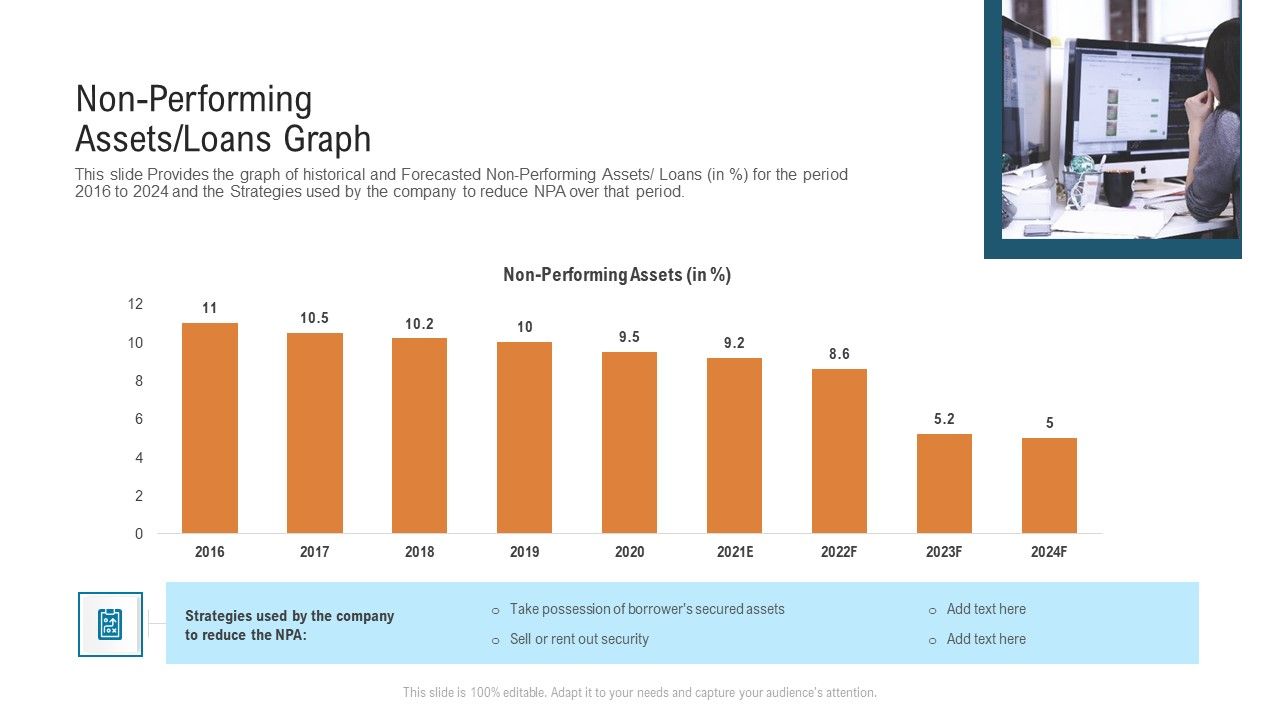
This slide Provides the graph of historical and Forecasted Non Performing Assets or Loans in percentagefor the period 2016 to 2024 and the Strategies used by the company to reduce NPA over that period. Deliver and pitch your topic in the best possible manner with this non performing assets loans graph structure pdf. Use them to share invaluable insights on non performing assets loans graph and impress your audience. This template can be altered and modified as per your expectations. So, grab it now.
People who downloaded this PowerPoint presentation also viewed the following :
Most Relevant Reviews
-
Qualitative and comprehensive slides.
-
Great designs, really helpful.

 Home
Home 


