Machine Learning Development And Operations Cycle IT Dashboard To Monitor Health Of Machine Demonstration PDF
- Google Slides is a new FREE Presentation software from Google.
- All our content is 100% compatible with Google Slides.
- Just download our designs, and upload them to Google Slides and they will work automatically.
- Amaze your audience with SlideGeeks and Google Slides.
-
Want Changes to This PPT Slide? Check out our Presentation Design Services
- WideScreen Aspect ratio is becoming a very popular format. When you download this product, the downloaded ZIP will contain this product in both standard and widescreen format.
-

- Some older products that we have may only be in standard format, but they can easily be converted to widescreen.
- To do this, please open the SlideGeeks product in Powerpoint, and go to
- Design ( On the top bar) -> Page Setup -> and select "On-screen Show (16:9)” in the drop down for "Slides Sized for".
- The slide or theme will change to widescreen, and all graphics will adjust automatically. You can similarly convert our content to any other desired screen aspect ratio.
Compatible With Google Slides

Get This In WideScreen
You must be logged in to download this presentation.
 Impress Your
 Audience
 100%
100% Editable
Google Slides
Features of these PowerPoint presentation slides:
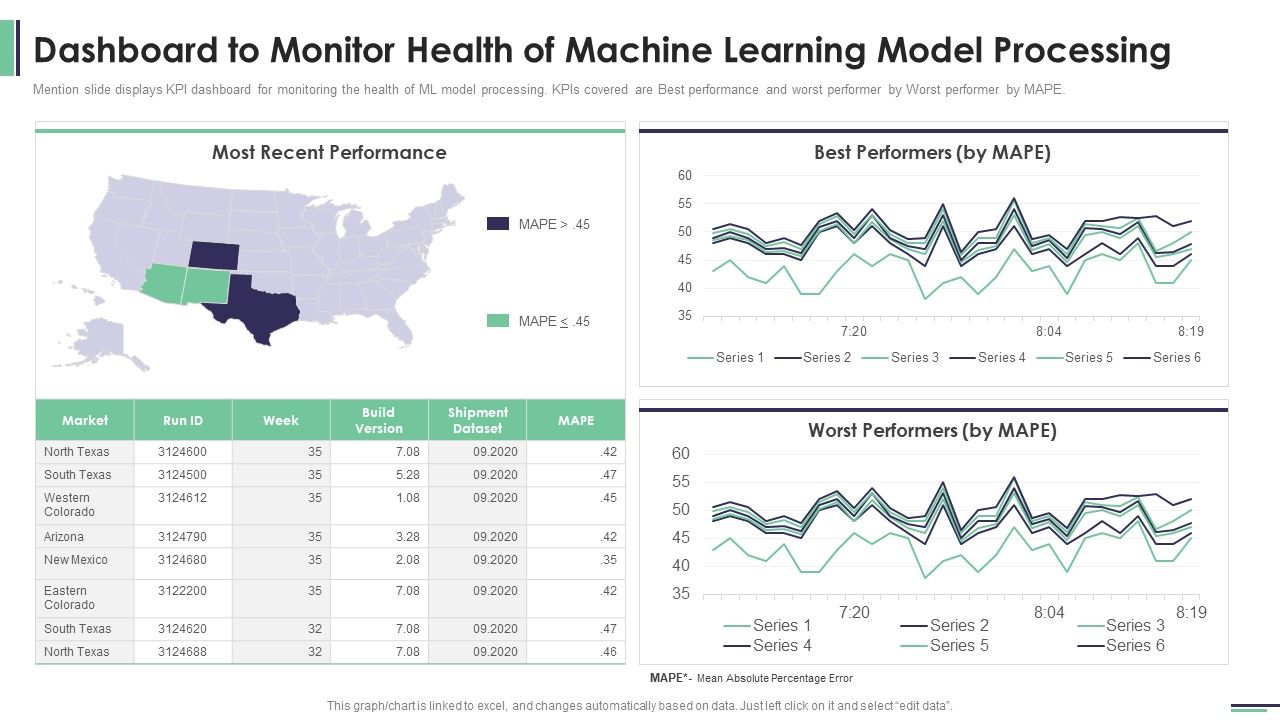
Mention slide displays KPI dashboard for monitoring the health of ML model processing. KPIs covered are Best performance and worst performer by Worst performer by MAPE.Deliver an awe inspiring pitch with this creative machine learning development and operations cycle it dashboard to monitor health of machine demonstration pdf bundle. Topics like most recent performance, best performers, worst performers can be discussed with this completely editable template. It is available for immediate download depending on the needs and requirements of the user.
People who downloaded this PowerPoint presentation also viewed the following :
Machine Learning Development And Operations Cycle IT Dashboard To Monitor Health Of Machine Demonstration PDF with all 2 slides:
Most Relevant Reviews
-
Enough space for editing and adding your own content.

 Home
Home 


