Yearly comparison graph PowerPoint Presentation Templates and Google Slides
-
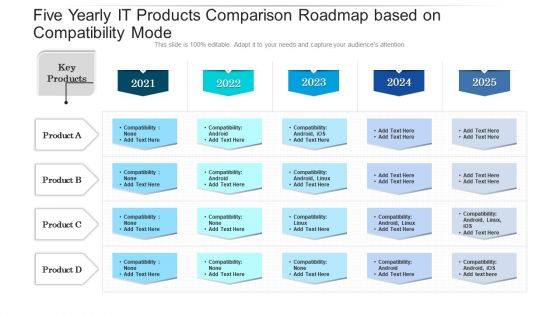
Five Yearly IT Products Comparison Roadmap Based On Compatibility Mode Graphics
Presenting our innovatively structured five yearly it products comparison roadmap based on compatibility mode graphics Template. Showcase your roadmap process in different formats like PDF, PNG, and JPG by clicking the download button below. This PPT design is available in both Standard Screen and Widescreen aspect ratios. It can also be easily personalized and presented with modified font size, font type, color, and shapes to measure your progress in a clear way.
-
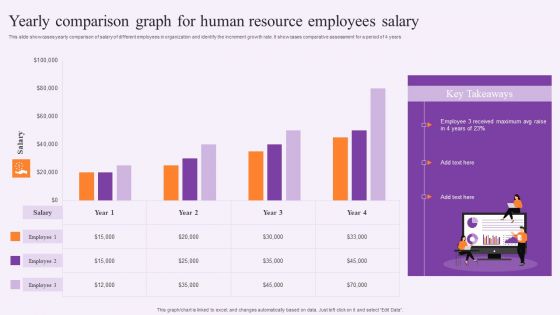
Yearly Comparison Graph For Human Resource Employees Salary Template PDF
This slide showcases yearly comparison of salary of different employees in organization and identify the increment growth rate. It showcases comparative assessment for a period of 4 years. Pitch your topic with ease and precision using this Yearly Comparison Graph For Human Resource Employees Salary Template PDF. This layout presents information on Human Resource, Employees Salary. It is also available for immediate download and adjustment. So, changes can be made in the color, design, graphics or any other component to create a unique layout.
-
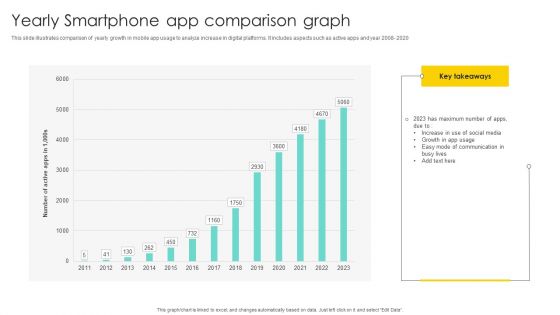
Yearly Smartphone App Comparison Graph Diagrams PDF
Showcasing this set of slides titled Yearly Smartphone App Comparison Graph Diagrams PDF. The topics addressed in these templates are Comparison Graph, Comparison Of Yearly, Growth In App . All the content presented in this PPT design is completely editable. Download it and make adjustments in color, background, font etc. as per your unique business setting.
-
Line Comparison Graph For Yearly Liquidity Ratio Analysis Comparison Topics PDF
This slide showcases liquidity ratios graph that can help in identifying cash richness and financial position of organization. It showcases comparison for last 6 years and it key components are current ratio, quick ratio and cash ratio. Showcasing this set of slides titled Line Comparison Graph For Yearly Liquidity Ratio Analysis Comparison Topics PDF. The topics addressed in these templates are Term Financing, Cash Shortage, Cash Ratio. All the content presented in this PPT design is completely editable. Download it and make adjustments in color, background, font etc. as per your unique business setting.
-
Yearly Comparison Graph Icon For Operating Profit Margin Topics PDF
Persuade your audience using this Yearly Comparison Graph Icon For Operating Profit Margin Topics PDF. This PPT design covers four stages, thus making it a great tool to use. It also caters to a variety of topics including Yearly Comparison Graph, Icon For Operating, Profit Margin. Download this PPT design now to present a convincing pitch that not only emphasizes the topic but also showcases your presentation skills.


